Application of Polyhedral Choice-Based Conjoint Analysis to
the Redesign of MIT Sloan School's Executive Education
Programs
by
Emily Hui
S.B., Mechanical Engineering
Massachusetts Institute of Technology, 2001
Submitted to the Department of Mechanical Engineering
in partial fulfillment of the requirements for the degree of
Master of Science in Mechanical Engineering
at the
MASSACHUSETTS INSTITUTE OF TECHNOLOGY
June 2003
MASSACHUSETTS INSTITUTE OF TECHNOLOGY
JUL 0 8 2003
LIBRARIES
©
Massachusetts Institute of Technology 2003. All rights reserved.
A u th o r ..
...
Department of Mechanical Engineering
May 9, 2003
Certified by...
John R. Hauser
Kirn Professor of Marketing
Thesis Supervisor
Certified by...
Esther and Harold
David Wallace
E. Edgerton Associate Professor of Mechanical Engineering
Thesis Supervisor
A ccepted by ...
...
Ain A. Sonin
Chairman, Department Committee on Graduate Students
Application of Polyhedral Choice-Based Conjoint Analysis to the
Redesign of MIT Sloan School's Executive Education Programs
by
Emily Hui
Submitted to the Department of Mechanical Engineering on May 9, 2003, in partial fulfillment of the
requirements for the degree of
Master of Science in Mechanical Engineering
Abstract
The MIT Sloan School decided to investigate opportunities to redesign its current executive education programs. A survey was created to assist in the redesign by providing data to obtain a better understanding of potential candidates' interests in program features. Choice-based conjoint using polyhedral methods was the data collection technique selected for use in this survey. This technique provides a more accurate measure of respondents' partial utilities while asking fewer questions. Additionally, it can be deployed in a time- and cost-sensitive on-line format. A market share simulator was created to provide the Sloan Executive Education Redesign Committee a means to measure market shares of different programs that potentially could be offered by the Sloan School. The results of this survey will be used by the Sloan School to help them finalize their plans for the program redesign. Additionally, the performance of the polyhedral choice-based conjoint method was evaluated and found to be accurate enough to be used in future surveys of this type.
Thesis Supervisor: John R. Hauser Title: Kirin Professor of Marketing
Thesis Supervisor: David Wallace
Acknowledgments
Thank you, Mom and Dad, for always thinking of me and being there for me every step of the way. Without your love, guidance, and support over the years, I would not be the person I am today.
With sincerest gratitude, I thank Michael Goertz, my fiance, who has never left my side since the day we met. You somehow found countless time and energy to support me emotionally and intellectually while opening my mind to new ways of thinking. Your encouragement through difficult times has helped me gain the personal strength I have today.
These acknowledgements would be far from complete without thanking my friend and men-tor, Rohan Abeyaratne. I have learned so much from you both in and outside of academia. Thank you for sharing your distinctive way of thinking with me. It has and will continue to guide me in life.
I would also like to thank John Hauser, David Wallace, and Olivier Toubia for their guidance and support for which this thesis would not have been possible otherwise.
Thanks to my friends, all of whom have supported me in different ways throughout my academic career.
Contents
1 Introduction
1.1 Study Objectives . . . . 2 Background
2.1 Current Sloan Executive Education Programs 2.2 Virtual Customer . . . . 2.3 Conjoint Data Collection Techniques...
2.3.1 Choice-Based Conjoint . . . . 2.3.2 2.3.3 Adaptive Conjoint . . . . Polyhedral Conjoint . . . . 3 Methods 3.1 Program Features . . . . . 3.2 Website Development . . . . . 3.3 Progression of Survey . . . .. 3.4 Implementation Details . . . .. 3.5 Pretest with Boston Consulting Gro 3.6 Recruiting Process . . . .
3.6.1 Targeted Respondents . . . 3.6.2 Lottery . . . . 3.7 Privacy and Security . . . . 3.8 Survey Distribution . . . . 3.9 Data Flow . . . . 3.10 Response Rate . . . . 3.11 Cluster Analysis . . . . 3.12 Significance Testing . . . . 3.13 Simulator . . . . 3.13.1 Specifying Program Profiles 3.13.2 Respondent's Simulated Cho 3.13.3 How Demographics Can Be I 3.13.4 Specifying Demographic Crit 3.13.5 Implementation Details . . 3.14 Pricing Analysis . . . . 3.14.1 Calculating Dollar Utilities
23 . . . . . . .. . . . 2 3 . . . . 2 5 . . . . 2 8 .. . . . . 35 up . . . . 36 . . . . 3 7 . . . . 3 7 . . . . 3 8 . . . . 3 9 . . . . 3 9 . . . . 4 1 . . . . 4 1 . . . . 4 2 . . . . 4 3 . . . . 4 3 . . . . 4 4 ice . . . . 44 .ncluded . . . . 44 eria . . . . 45 . . . . 4 5 . . . . 4 6 . . . . 4 6 13 . . . 13 15 15 16 17 18 18 19
4 Results 49
4.1 Response Rate . . . . 49
4.2 Respondent Demographics . . . . 54
4.3 Conjoint U tilities . . . . 55
4.3.1 GMAT Group. . . . . 55
4.3.2 MIT Alumni Group . . . . 61
4.4 Reliability of Polyhedral Choice-Based Conjoint Utilities . . . . 65
4.5 Correlation Test of Conjoint Utilities and Self-Explicated Rankings . . . . . 67
4.6 Cluster Analysis . . . . 69
4.7 Market Share Simulator . . . . 71
4.8 Statistical Significance of Utilities . . . . 73
4.9 Price A nalysis . . . . 74
4.10 Open Comments . . . . 77
5 Conclusions and Recommendations 79 5.1 Contributions to the Redesign Committee . . . . 79
5.2 Contributions to Future Executive Education Studies . . . . 80
A Description of Program Features 81
B Website Flow Diagram 85
C Answer Choices to Demographic Questions 87
D E-mail Invitation 89
List of Figures
2-1 Self-Explicated Question . . . . 20
3-1 Self-Explicated Questions Used in the Sloan Executive Education Survey . 26 3-2 Choice-Based Conjoint Question Used in the Sloan Executive Education Study 27 3-3 Survey Instructions and Outline in the Sloan Executive Education Study . 29 3-4 Demographic Questions in the Sloan Executive Education Study . . . . 31
3-5 Career Interests Questions in Sloan Executive Education Study . . . . 32
3-6 Open Comments Question in the Sloan Executive Education Study . . . . . 33
3-7 Closing Screen in the Sloan Executive Education Study . . . . 34
3-8 Error Message in the Sloan Executive Education Study . . . . 36
3-9 D ata Flow . . . . 42
4-1 Number of Completed Surveys on Each Day Since Initial E-mail Invitation for GM AT Population . . . . 51
4-2 Number of Completed Surveys on Each Day Since Initial E-mail Invitation for MIT Alumni Population . . . . ... 52
4-3 Completion Rate of Conjoint Quesions for GMAT and MIT Alumni Respon-dents . . . . 53
4-4 Average Partial Utilities of Program Features for the GMAT Respondents . 56 4-5 Average Utilities after GMAT Population Is Grouped according to Program Form at. . . . . 58
4-6 Average Utilities after GMAT Population Is Grouped according to Program Focus. . . . . 59
4-7 Average Partial Utilities of Program Format and Focus after GMAT Popu-lation Is Grouped according to Geographical Region . . . . 60
4-8 Average Partial Utilities of MIT Alumni Population. . . . . 62
4-9 Average Utilities after MIT Alumni Population Is Grouped according to Pro-gram Form at . . . . 63
4-10 Average Utilities after MIT alumni Population Is Grouped according to Pro-gram Focus. . . . . 64
4-11 Comparison of Average Hit Rates between Polyhedral and Self-Explicated Data... ... 66
B-1 W ebsite Flow Diagram . . . . 86
E-1 "Select Program Features" Excel Worksheet . . . . 94
List of Tables
3.1 Program Features and Levels . . . . 24
3.2 Data File Names and Descriptions . . . . 41
4.1 Percent Response for Each of the Three Targeted Groups . . . . 50
4.2 Demographic Information for the GMAT Respondents. . . . . 54
4.3 Demographic Information for the MIT Alumni Respondents . . . . 54
4.4 Breakdown of Respondents who Selected "Other" as an Answer in Demo-graphic Questions . . . . 55
4.5 Average Hit Rate Using Polyhedral and Self-Explicated Data . . . . 66
4.6 Convergence between Self-Explicated and Conjoint Rank Orders of Each Fea-ture ... ... 68
4.7 Distances between Final Cluster Centers . . . . 69
4.8 Final Cluster Centers in Utility Measures . . . . 70
4.9 Simulated Respondents' Preferences . . . . 71
4.10 Simulated Program Choice Dependent on Demographic Criteria . . . . 72
4.11 Feature Levels Showing Differences in Utilities with Significance Level beyond 0.05 . . . .. . .. . . . . .. . .. . . . . 73
4.12 Demographic Characteristics Showing Differences in Utilities with Signifi-cance Level beyond 0.05 . . . . 73
4.13 Median Willingness to Pay for GMAT Respondents . . . . 75
Chapter 1
Introduction
1.1
Study Objectives
The MIT Sloan School of Management offers two business administration degree programs under their executive education program. Both are year-long full-time residential programs geared toward mid-career professionals. There is increasing interest in revising the two programs due to market demand, giving each a different format, either full-time residential or part-time residential. The full-time residential format would demand the individual to remain in the vicinity of the MIT Sloan School campus to attend classes as a full-time student. The part-full-time residential format would allow the individual to continue full-time employment while attending the executive education program. The part-time residential format would consist of on-line coursework, weekend courses, intermittent week-long courses, or some combination of the three to allow the individuals residing nearby the option of working part- or full-time while going to school.
The objective of this study is to understand how prospective program candidates value potential program features. The primary goal is to determine the level of interest in the part-time residential format and the value of program features for those individuals preferring this format. The project deliverables include all the information collected in the surveys, relevant analysis performed on the data, and a market share simulator that manipulates and summarizes the collected data.
The data collected in this project will also contribute to the evaluation of the accuracy of the analysis method used to calculate the value of program features in comparison to other methods. The data required to implement other methods have been accounted for in
the overall design of the survey. However, this comparison is not within the scope of this study and is being investigated by Olivier Toubia, a doctoral candidate at the MIT Sloan School of Management.
Chapter 2
Background
2.1
Current Sloan Executive Education Programs
The Sloan School offers several different executive education programs, each with a different focus. Within these programs, there are currently two master's degree programs offered, the
Sloan Fellows and the Management of Technology programs. Detailed information about the programs can be accessed on-line through the MIT Sloan School Executive Education website. [1]
Sloan Fellows Program
Every year approximately fifty-five talented mid-career managers from all over the globe attend the world's oldest leadership program, the Sloan Fellows Program. The duration of the program is one year. In this program, students learn to overcome challenges of leadership, culture, and disciplines and gain many skills to help them become leaders of powerful organizations.
Management of Technology Program
This one-year master's program is geared toward the mid-career technical professional in-terested in leading successful technological ventures. This MBA program is unique because it goes beyond providing the core management skills and creates a focus on management within technology-based ventures. The students' environment includes an abundance of
technological resources, from research labs and highly specialized researchers to peers in the classroom, allowing them to advance their technological skills.
2.2
Virtual Customer
The Virtual Customer project, under development by the MIT Sloan School, takes advan-tage of the increasing resources and advances in information technologies and communi-cations to develop a more time- and cost-efficient product development process, which are critical aspects of this study.[2]
The Internet presents many new opportunities. Web-based surveys, an alternative to the traditional consumer research methods, allow respondents to complete the question-naire on a secure website at their own convenience with no geographical restriction. This is important to the success of this study because the targeted respondents, who could be located anywhere in the world, must have access to the survey. Time and money are saved by reducing paper and mailing costs and by not requiring an individual to interview the respondent in person. [3] [4] [5] [6] In addition, the elimination of the interviewer can remove interviewer errors and bias, which may be presented through his or her mood.[6] Moreover, the researcher, through secure means, can retrieve the survey data instantly over the In-ternet. The instant access to data allows researchers to complete data analysis in a very short period of time. A disadvantage of using the Internet is the uncertainty of how well the sample of responses represents the targeted market. Some individuals do not have ac-cess to the Internet and therefore would not be invited to complete the survey.[6] In this study, specific criteria were used to determine the target respondents. It was believed that these individuals had access to the web through a personal or office computer because of their backgrounds; they were therefore invited through their personal e-mail addresses to participate. Thus, in this study we expect little or no bias due to the use of web-based methods. [7]
Another advantage of using the Internet is that it can utilize the advances in computer and software resources, allowing researchers to represent the product concept through com-puter graphics. Software available today can be used to create virtual models which can be manipulated by the respondent, as used in the Virtual Customer Polaroid study.[8] This flexibility contributes to a more time- and cost-efficient product development process
com-pared to the traditional iterative process of designers making corresponding changes to the product concept or prototype every time respondents are questioned. The questionnaire can be finished in one sitting instead of having researchers run iterations of concept tests between designers and respondents. [8] [9]
It is important for researchers to maximize the amount of information obtained by ques-tioning a respondent in a given amount of time to reduce respondent fatigue. The polyhedral conjoint method is used to reduce the time, or respectively the number of questions, the respondent must complete to get the same amount of information as more traditional data collection methods.[9] This software algorithm selects the next question based on the re-spondent's previous answers. The general concept of this technique is to not ask questions which seem to have an obvious answer based on the respondent's previous answers or initial preferences.
For more detailed information on the Virtual Customer project, please refer to the paper, "The Virtual Customer" and the Virtual Customer website. [2] [10]
2.3
Conjoint Data Collection Techniques
By determining the value consumers place on various product features such as size or color and their respective levels, such as big or small and blue or red, designers can better understand where to focus their efforts during the development of a product. The conjoint questions used in this study provide more insight into respondents' values of feature levels by forcing the respondents to choose one feature level over another, whereas other traditional methods, such as self-explicated questions, require respondents to rank-order feature levels. Each feature level is assigned a value, or utility, as a result of the analysis. Conjoint analysis provides quantitative measures of relative preferences, or utilities, for features.
The choice of feature level is important to the respondent when the difference in the highest and lowest partial utilities for levels within the same feature is large. However, when the difference is small, the utilities are comparable, suggesting that the respondent shows little preference among the different levels within the feature. The feature level with the highest partial utility is valued most by the respondent when making a choice.
2.3.1
Choice-Based Conjoint
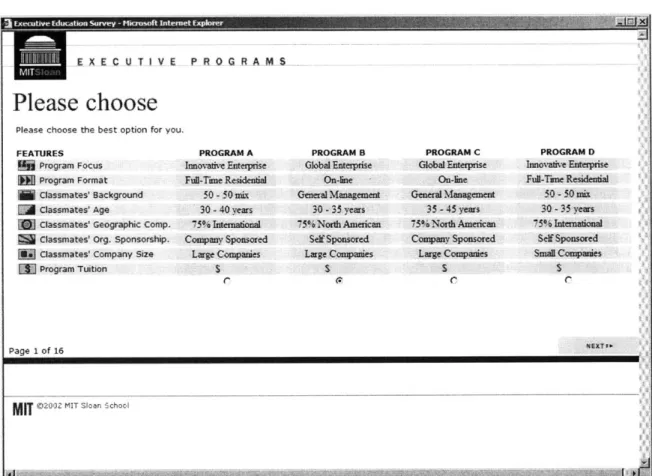
The four basic data collection methods are choice-based, full-profile, metric-pairs, and self-explicated. Of these four data collection methods, a type of choice-based conjoint method was selected for this study. In a choice-based conjoint method, respondents are presented with two or more product profiles, with each feature specified. The respondent then selects his or her choice given a set to choose from. The respondent continues to answer choice-based conjoint questions in this format. In this study, each question presented at most four programs to the respondent, each containing eight features. The respondent was then asked to select the profile he or she most preferred. Figure 3-2 shows an example of a choice-based conjoint question from this study.
Many other conjoint techniques ask the respondent to rate the choices. The availability of the product profiles in a choice-based conjoint is believed to put the respondent in a more realistic marketplace setting.[11]
Choice-based questions can ask the respondent to choose between two or more products, or profiles of features. The disadvantage of comparing more than two profiles is that the respondent can be overloaded with information, making it difficult for the respondent to make an accurate choice. The number of feature levels should also be taken into considera-tion. If the number of feature levels per profile to be compared is few, then the respondent will have an easier time comparing multiple profiles. Even if the respondent is asked to compare only two product profiles, this may be a tedious and difficult task resulting in invalid choices if the number of features per profile is high. Studies indicate that more than five or six features can overload the respondent with information.[11][12] Although there are eight features in this study, the survey was organized to minimize the respondent's fatigue and to provide them with quick reminders of the definition of various feature levels if nec-essary. The low drop-out rate of this survey may indicate a measure of success in reducing respondent overload and fatigue.
2.3.2
Adaptive Conjoint
Studies show that tailoring questions to different respondents can maximize the amount of information collected through conjoint questions.[13][14] This modification allows questions with obvious answers to be thrown out of the questionnaire. For example, if the respondent
does not value feature A, it would not be helpful to have multiple questions comparing feature A to several other features which are known to be of great importance to the respondent. By implementing a dynamic algorithm that adapts to each respondent, the time and energy of the respondent can be saved in addition to more optimal information being gathered.
The currently existing methods of adaptive conjoint analysis are Adaptive Conjoint Analysis [13] and polyhedral conjoint methods [9][14][15]. Sawtooth Software employs the ordinary least-squares-regression technique in their Adaptive Conjoint Analysis software package for metric-paired data collection. [13] A different method is employed in the polyhe-dral conjoint method, developed by Toubia, Hauser, and Simester at the MIT Sloan School of Management. This polyhedral method can be applied to either choice-based or metric-paired data collection methods. The polyhedral choice-based conjoint method, the only adaptive choice-based conjoint method currently available, is used in this study.[14] The polyhedral metric-paired conjoint method was applied in a previous study regarding laptop
bags. [9]
2.3.3 Polyhedral Conjoint
The polyhedral conjoint method was created to decrease the number of questions in a market research study without compromising the accuracy of the study. This method is unique in two aspects of conjoint analysis: dynamic question selection and partial utility calculation. The description below serves to provide a general background of the polyhedral choice-based conjoint method. The reader is asked to refer to a paper by Toubia, Simester, and Hauser for a more detailed explanation of this adaptive choice-based conjoint method.[14]
Brief Description
A region of space is represented by a number of axes. Each axis represents the possible utility values of a feature level. A point in space thus defines the utility values for all feature levels. The polyhedral method attempts to capture a region of space that is consistent with the respondent's answers. The region of space a polyhedron occupies is reduced in size as each additional question is answered. The purpose of the adaptive questions is to reduce the polyhedron's size rapidly. The analytic center is the point within the polyhedron's region
of space which best represents the respondent's partial utilities and can be interpreted as the maximum likelihood estimate.
Self-Explicated Questions
The polyhedral choice-based conjoint method requires that the lowest level in each feature category be identified. Self-explicated questions are used in this study to identify these feature levels. These questions ask respondents to rank feature levels separately on a pref-erence scale. (see Figure 2-1) The least preferred level within each feature is assigned a "zero" utility. This does not mean that the respondent holds zero utility for the level, but rather that the other levels' utilities are relative to the least preferred level.
Leading Innovative Enterprises 1k C C C C 5k C C C C C +9
This primary focus of this program is to develop leaders who can drive successful innovation in a global environment where old distinctions between technically trained entrepreneurs and general managers break down, and where large firms and entrepreneurial ventures increasingly interact as partners, customers, suppliers, and competitors. Designed for high-potential, mid-career professionals preparing for leadership roles in established organizations or new ventures, this program develops the skills that allow leaders to work successfully across both domains.
Figure 2-1: Self-Explicated Question
Question Selection
An important aspect of this algorithm is to choose the best question in order for the poly-hedron to converge more quickly to its analytic center. In order to maximize the amount of information from a limited number of questions, the algorithm selects questions based on feature levels that have the highest uncertainty in utility value. Subsequent questions are selected based on the same criteria after the current question is answered and conjoint utilities are updated. This process continues until a pre-determined number of questions
are answered, or until convergence.
Calculating Utilities
Two common methods of calculating utilities for choice-based conjoint analysis is to per-form logit estimation and hierarchical bayes. However, in polyhedral choice-based conjoint analysis, the utilities can also be calculated by analytic center estimation.[14] The analytic center of an ellipse fitted about the polyhedron is a good approximation of the polyhedron's center of gravity, the point which defines all partial utilities for the respondent. After
utili-ties are calculated, an optimal product is identified by combining feature levels which have high-valued utilities.
An assumption is made in the implementation of conjoint analysis. This assumption concerns the method used to evaluate a decision. It is assumed that the individual feature utilities are summed to come to the total utility of the product or service. The respondent's choice is then the product with the highest total utility.
The validity of the utilities between the polyhedral and hierarchical bayes methods will be compared as done in a previous study, which revealed that hierarchical bayes is more accurate for a more homogenous population with a relatively high response error, and the polyhedral metric-paired method is more accurate for a more heterogeneous population with a low response error. [14][15]
Testing Reliability of Utilities
Additional conjoint questions not used in the estimation of respondent utilities are often asked in surveys to evaluate the reliability of the estimated partial utilities. These questions are called holdout questions and are asked during the survey along with the other conjoint questions, appearing in the same format. In this study, answers to these holdout questions were compared to the predicted choice using the partial utilities estimated by the polyhedral method. Reliability is measured by how consistently the conjoint utilities can predict the answers to holdout questions, a measure called hit rate.
Chapter 3
Methods
An increase in market demand for part-time residential executive education programs has caused schools offering only full-time programs to rethink their offerings. Initially, this pressure instigated qualitative studies performed by two major consulting firms in conjunc-tion with MIT Sloan, which revealed that program format and focus are two key features to consider revising in a program redesign. Next, within the Sloan School, a committee composed of Sloan faculty, administrators, and Boston Consulting Group representatives had the task of determining which additional program features should be further studied in a user survey. The result of these studies was a set of eight program features that were to be designed into a choice-based conjoint survey.
The web-form survey was chosen for this study because respondents were spread geo-graphically and test data was required in a timely manner and on a limited budget. Further-more, the polyhedral choice-based conjoint method requires the use of a dynamic medium, such as a web-form.
3.1
Program Features
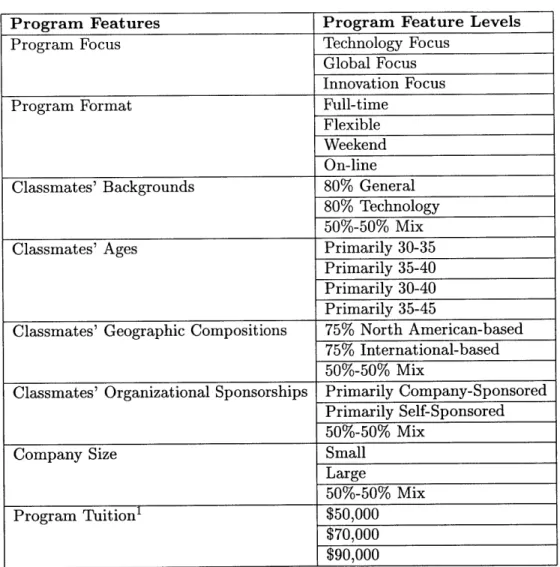
The eight program features and their respective levels are listed in Table 3.1. A description of each feature level as it appears in the survey is listed in Appendix A. Each program is de-scribed by one level from each of the eight categories, creating 11,664 possible combinations. Even though this is a large number of combinations, the use of the polyhedral choice-based conjoint method works to select feature combinations that will ultimately maximize the amount of information from each question and thereby rapidly reduce the polyhedron size.
Table 3.1: Program Features and Levels
Program Features Program Feature Levels
Program Focus Technology Focus
Global Focus Innovation Focus
Program Format Full-time
Flexible Weekend On-line
Classmates' Backgrounds 80% General
80% Technology
50%-50% Mix
Classmates' Ages Primarily 30-35
Primarily 35-40 Primarily 30-40 Primarily 35-45
Classmates' Geographic Compositions 75% North American-based 75% International-based
50%-50% Mix
Classmates' Organizational Sponsorships Primarily Company-Sponsored Primarily Self-Sponsored
50%-50% Mix
Company Size Small
Large
50%-50% Mix
Program Tuition1 $50,000
$70,000 $90,000
3.2
Website Development
Several key ideas regarding human interface were emphasized throughout the web devel-opment of the survey. One characteristic was to make the instructions and text clear and simple. The intent was to have the respondent spend most of his or her time answering questions and less time reading unnecessary text. Both the instructions and questions had to be clearly understood by the respondents since no one would be available to answer questions. Furthermore, the website needed to be visually appealing and professional and not overloaded with extraneous graphics.
The layout of the self-explicated questions was consistent between screens. Each screen presented a different feature, which was clearly labeled. Each page contained instructions at the top of every screen to remind the respondent of his or her task for each question. The descriptions of the feature levels per feature category as listed with these questions were carefully checked for consistent word choice. The radio buttons allowing the respondent to make a rating selection for each feature level were placed directly beside the feature level to avoid confusion. The buttons were also labeled with ratings 1, 5, and 9 to provide reference points on the scale for the respondent. (See Figure 3-1) The order of the feature levels and their respective descriptions were randomized for each respondent to prevent any order bias. [16]
The layouts of all conjoint questions were identical, as shown in Figure 3-2. Only the feature levels in the program profiles changed between questions. The instructions were also clearly positioned at the top of the screen. The shading was designed to help the reader sort through the list of features in each program.
Icons, as shown in Figure 3-2, were assigned to each of the feature categories to provide a visual reminder of the program feature that they represented throughout the survey. Furthermore, it was important to make available reminders of feature level descriptions as the respondent reviewed the program choices. A popup window was displayed with a description of the feature levels when the user clicked on the feature's icon. The levels and their descriptions appeared as in the self-explicated question but without the radio buttons. Another key characteristic of the web development was to keep the download time per survey screen as minimal as possible in order not to frustrate or waste respondents' time.
'For reasons of confidentiality the tuition values listed in this paper are not the real values used in the survey.
_E U TIVE P RORA MS
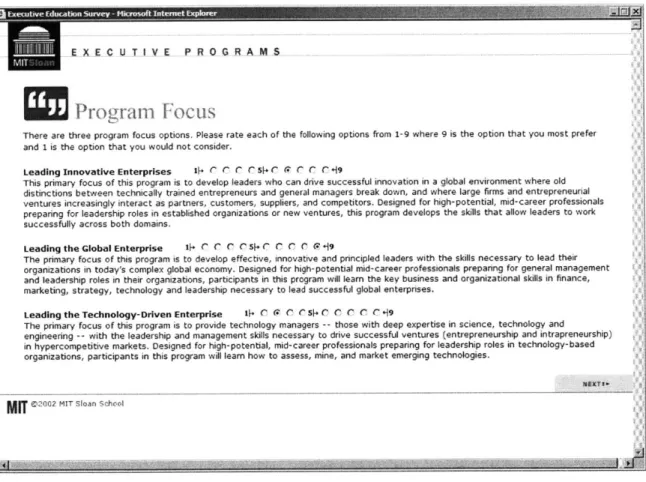
Program Focus
There are three program focus options. Please rate each of the following options from 1-9 where 9 is the option that you most prefer and 1 is the option that you would not consider.
Leading Innovative Enterprises 1F C C C C s. C rC C C r+i9
This primary focus of this program is to develop leaders who can drive successful innovation in a global environment where old distinctions between technically trained entrepreneurs and general managers break down, and where large firms and entrepreneurial ventures increasingly interact as partners, customers, suppliers, and competitors. Designed for high-potential, mid-career professionals preparing for leadership roles in established organizations or new ventures, this program develops the skills that allow leaders to work successfully across both domains.
Leading the Global Enterprise iF. C C C C s[+ C C C C r,+9
The primary focus of this program is to develop effective, innovative and principled leaders with the skills necessary to lead their organizations in today's complex global economy. Designed for high-potential mid-career professionals preparing for general management and leadership roles in their organizations, participants in this program will learn the key business and organizational skills in finance, marketing, strategy, technology and leadership necessary to lead successful global enterprises.
Leading the Technology-Driven Enterprise 0F C r C C sF. C C C C C +'9
The primary focus of this program is to provide technology managers -- those with deep expertise in science, technology and engineering -- with the leadership and management skills necessary to drive successful ventures (entrepreneurship and intrapreneurship) in hypercompetitive markets. Designed for high-potential, mid-career professionals preparing for leadership roles in technology-based organizations, participants in this program will learn how to assess, mine, and market emerging technologies.
MIT *C2 MIT Slean School
E X E C.UT-I V E P R OG R AM-S
Please choose
Please choose the best option for you. FEATURESProgram Focus
Program Format classmates' Sackground
Classmates' Age
Classmates' Geographic Comp. Classmates' Org. Sponsorship. classmates' Company size Program Tuition PROGRAM A Innovative Enterprise Fuiil-Tirue Residen"il 50 - 50 mix 30 - 40 years 715% Inkenuational Company Sponsored Large Cowanies r $ PROGRAM B Global Enterprise On-line -General Management 30 -35 years 75% Norh American StY Sponsored Large Companies $ PROGRAM C Global Enterprise On-line General Management 35 - 45 yeas 75% o American Coupany Sposored Large Companies S PROGRAM D bmovative Enterprise Fu-Tme Residential 50 - 50 mix 30 -35 years 7 5% Internationial Self Sponsored Smal Comnies $ NEXTtI* Page 1 of 16 .3
Mffl @ r 2 MIT SlCan Schoi
3.3
Progression of Survey
The respondent was presented with introductory screens to the survey, followed by survey questions. The progression from one screen to the next was fixed, meaning no screens could be skipped before completing. The survey progression is outlined below:
1. Log-in
2. Introduction to Survey
3. Instructions and Survey Outline 4. Confidentiality Statement 5. Data Collection
(a) Self-Explicated Questions and Feature Descriptions (b) Conjoint Questions
(c) Demographic Questions (d) Career Interest Questions
(e) Comments
6. Thank You
The following sections describe the function of each stage of the survey as outlined above. A flow diagram in Appendix B can be used as a reference to help the reader understand the progression of the survey.
Log-in
In order to control access to the website, at the log-in screen the respondent had to enter his or her user name and password as received by e-mail invitation. This security measure permitted only targeted respondents to complete the survey. Furthermore, after a respon-dent completed the survey using a particular user name and password, access was denied if re-entry into the survey was attempted using the same user name and password. This prevented individuals from completing the survey and entering the lottery multiple times.
Introduction to Survey
The next screen welcomed the respondent to the survey and provided general informa-tion regarding the purposes of the survey. Within the introducinforma-tion was a request for the
individual to make an impact on the improvement of the executive education programs by completing the survey.
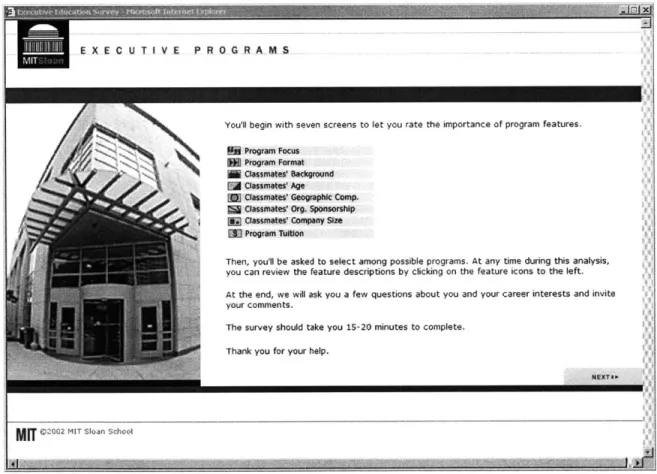
Instructions and Survey Overview
The purpose of the third screen was to present an overview of the survey. The respondent was informed of the two main sections of questions, self-explicated and conjoint questions. The image of the list of program features and their respective icons, as shown in Figure 3-3, presents the respondent with a preview of the screens to follow.
ll a ll il 11 1 , 1 1 M 1 1
E X E C U T I V E P R OG R A MS
N
Youll begin with seven screens to let you rate the importance of program features. UW Program FocusProgram Format Classmates' Background Classmates' Age
Classmates' Geographic Comp. Classmates' Org. Sponsorship [ Classmates' Company Size
3 Program TuItion
Then, you'll be asked to select among possible programs. At any time during this analysis,
you can review the feature descriptions by clicking on the feature icons to the left,
At the end, we will ask you a few questions about you and your career interests and invite your comments.
The survey should take you 15-20 minutes to complete. Thank you for your help.
NEXTs a
Confidentiality
The purpose of this next slide was to assure the respondent that he or she would maintain anonymity. He or she was also reminded of his or her voluntary participation and privilege to not complete the survey. These concerns were stressed in accordance with MIT COUHES (Committee on the Use of Humans as Experimental Subjects). This screen also provided information about the lottery in which the respondents would become participants after completing the survey.
Questions
The question types addressed in the next slides include: Self-Explicated, Conjoint, De-mographic, Career Interests, and Open Comments.
Self-Explicated Questions
The self-explicated questions were the first set of questions the respondent had to com-plete. Answers to the self-explicated questions identified the least preferred level in each feature. Each screen addressed a different program feature as listed at the top of each ques-tion in this secques-tion. (See Figure 3-1) Each feature level was listed with its descripques-tion as well as the rating scale. There were a total of seven self-explicated questions, one for each program feature except program tuition. The different levels of tuition were listed on the screen, but the respondent was not asked to rank his or her preference for this feature. It was assumed that the respondent preferred the most inexpensive tuition price and valued least the most expensive tuition value.
Conjoint Questions
After all self-explicated questions were answered, the set of choice-based conjoint ques-tions began. The respondent was asked to select one program profile out of the alternatives by selecting the radio button corresponding to the program of choice as shown in Figure 3-2. There was a maximum of twelve conjoint questions in the first group and sixteen conjoint questions in the second group.
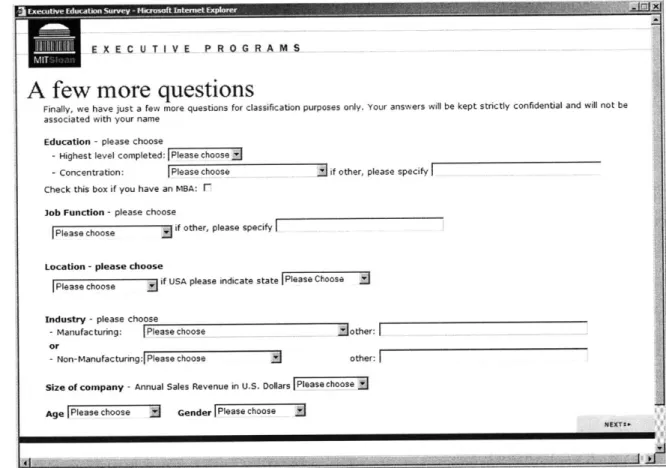
Demographic Questions
After the respondent completed the conjoint questions, he or she was asked to pro-vide demographic information about himself or herself. (See Figure 3-4) The questions asked for the respondent's age, gender, highest degree received (including MBA), field of concentration, current job function, geographical location, industry, and size of company.
This information was used to divide the respondents into different market segments. Ideal programs across different market segments (based on demographics) can now be compared to help determine the final format of the new programs. A criterion for the demographic data collection is that it shows respondents' interests based on their geographical location because the new programs will be tailored to both the local and distant students.
The respondents were provided with a pull-down menu listing possible answers to the questions. They could either select one of the choices or type in their own answers. A complete list of the possible answers appears in Appendix C.
e a
lil1111
11
1 ;.1. Ieli1A few more questions
Finally, we have just a few more questions for classification purposes only. Your answers will be kept strictly confidential and will not be
associated with your name
Education - please choose
- Highest level completed: Please choosej
-Concentration: Please choose - if other, please specify .
Check this box if you have an MBA:
Job Function - please choose
Please choose if other, please specify
Location -please choose
Please choose if USA please indicate state Please Choose
Industry - please choose
-Manufacturing: Please choose other:
or
-Non-Manufacturing: Please choose other:
Size of company -Annual Sales Revenue in U.S. Dollars Please choose Age I Please choose i Gender Please choose
NEXT--Figure 3-4: Demographic Questions in the Sloan Executive Education Study
Career Interest Questions
The last set of questions asked the respondent to provide information regarding interest
in the executive education program in relation to career interests. (See Figure 3-5) This
information helps the committee understand what drives respondents' decisions whether
or not to pursue an executive master's degree program. These questions were optional;
E X E CU T IVE P R OG R.AM S
A
few more
questions
1. We are interested in knowing why would you consider an Executive Masters Degree program. Please rate the reason stated below
from 1-9 , where 9 is the reason that best describes yours:
a. to pursue a career outside my present company or industry 1. C C C C 51- C r C C C -9 b. to enhance my skills and knowledge for future career development in my company . r C 5-. C C C C r 19
c. to enhance my career beyond my technical and professional specialization C r- C C C 51 C C C C C '19
d. to broaden my knowledge of global leadership with international managers around the world 1-.. C C C C 5- C C C C C +9
2. We are Interested In knowing why you would NOT consider an Executive Masters degree program. Please rate the reason stated
below from 1-9, where 9 is the reason that best describes yours:
a. don't see the benefit
b. can get same or more value through rotation and in-company programs c. can get same or more value through shorter, non-degree programs over time d. I would love to, but cannot step off the career ladder
sF. C C C C s1- C C C C C 19 si. C C C C s1- C C C C C '19
s[ CC Csk C C
0'~-11-. C C C C s1-. r C C C C '19
MIT
GV-2MTSonSh-aFigure 3-5: Career Interests Questions in Sloan Executive Education Study
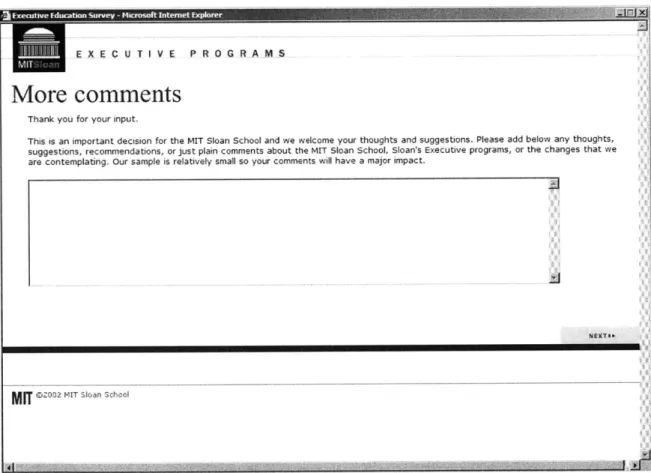
Open Comments
The next screen allowed respondents to provide comments about the Sloan executive program. (See Figure 3-6) These questions were also purely optional.
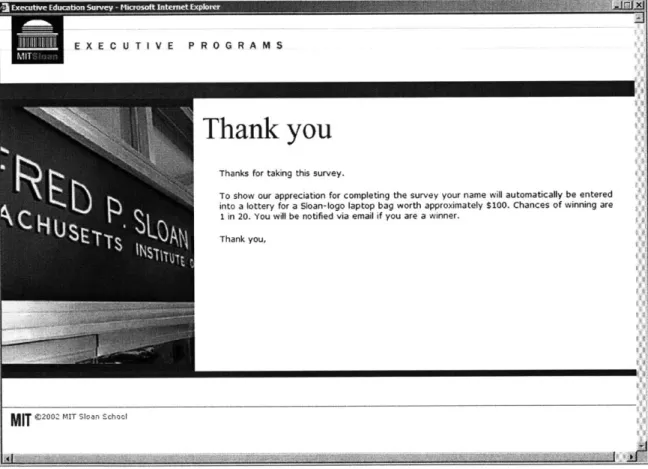
Closing Screen
The purpose of the final screen was to formally close the survey. The respondent was thanked and notified that his or her name was entered into the lottery for a laptop bag. (See Figure 3-7)
NEXT--Mfif 2032 MIT Sloan School
Figure 3-6: Open Comments Question in the Sloan Executive Education Study
E XE C U T 1 VE P RO0G RA-S
More comments
Thank you for your input.
This is an important decision for the MIT Sloan School and we welcome your thoughts and suggestions. Please add below any thoughts, suggestions, recommendations, or just plain comments about the MIT Sloan School, Sloan's Executive programs, or the changes that we
are contemplating. Our sample is relatively small so your comments will have a major impact.
EXEC U TIVE PROGRAMS
Thank you
Thanks for taking this survey.
To show our appreciation for completing the survey your name will automatically be entered into a lottery for a Sloan-logo laptop bag worth approximately $100. Chances of winning are
1 in 20. You will be notified via email if you are a winner. Thank you,
Q 2002 MI'a SlowSchoo'
3.4
Implementation Details
After the respondent logged into the survey, a new window opened without the browser navigational buttons. The respondent's navigation of the survey was then restricted. Fur-thermore, the back button option was removed from the right-click mouse menu. This ensured that the respondent progressed through the survey in its intended order without skipping any questions until the demographic question screen had been completed. This was necessary in the conjoint question section because each question depended on the an-swers to previous self-explicated and conjoint questions. Allowing respondents to change their answers would complicate the design of the system with little additional benefit.
A limitation of this survey (due to its accessibility through a web browser) is that the respondent could close the survey at any time by clicking on the "X" icon at the corner of the browser window. Therefore, all answers were saved in a database immediately after the respondent clicked on the "Next" button.
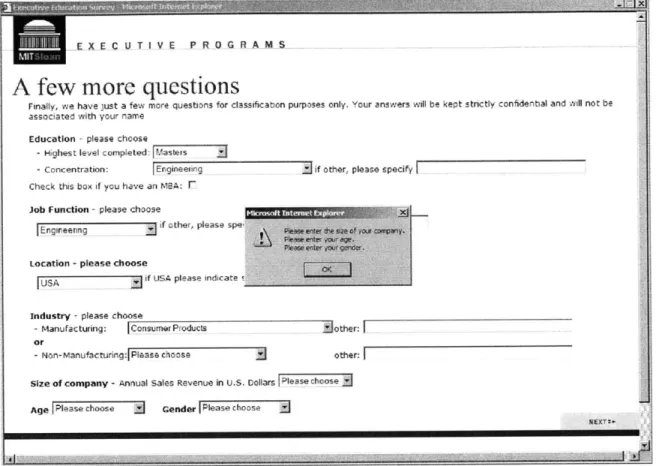
The demographic information is very important to the future development of the Sloan executive program because it provides information pertaining to different market segments. Therefore, the respondent could only move on to the next set of questions if all demographic questions were answered. Otherwise, an error message was displayed as shown in Figure 3-8. It was understood that some respondents might feel uncomfortable answering some personal questions, such as "Age" and "Gender." Therefore, an option was made available ("Prefer Not to Answer") in the demographic questionnaire to prevent respondents from dropping out of the survey. The choice "Unknown" appeared in the list of answers for "Company Size" because respondents may not have ready access to this information.
In this particular survey design, the respondent could re-login to the survey as long as the demographic questions had not been completed. Once this page was completed and the "Next" button was clicked, the respondent could not re-enter the survey after leaving that session. If the respondent quit before this page, he or she could re-login to the survey but must begin the survey over again. All new answers overrode the answers from the previous session. Respondents were not, however, told beforehand whether they could or could not re-enter the survey.
A few more questions
Finally, we have just a few more questions for classificabon purposes only. Your answers will be kept strictly confidental and wil not be
associated with your name
Education -please choose
-Highest level completed: vasters
-Concentration: Engineering if other, please speciFy Check this box if you have an MBA: r7
Job Function - please choose
jEngmneering if other, please spe
plwate e a0 ge.
Location -please choose
if USA please indicate
industry - please choose
Manufacturing: lConsumer Products other:
or
- Non-Manufacturing:1 Please choose other:
Size of company -Annual Sales Revenue in U.S. Dollars Please chaose Age j Please choose r-ender IPlease choose
Figure 3-8: Error Message in the Sloan Executive Education Study. The error message contains the demographic questions that have not been completed by the respondent.
3.5
Pretest with Boston Consulting Group
The pretest served to catch any grammatical or contextual errors within the survey and test the functionality and durability of the database, computer programs, and web server. The survey was made accessible to approximately thirty employees from the Boston Consulting Group, who had previously agreed to take part in the pretest. Each person received an e-mail listing a user name and password, providing access to the survey. The personal e-e-mail invitation requested that they complete the survey and report any contextual errors, issues with user interface, or general comments about the survey.
Comments from the Boston Consulting Group suggested that the "Back" option could be a source of confusion. Although the "Back" button from the web browser was disabled, the option was still available through the right-click mouse menu and an icon on the survey screen. Remembering that the order of the questions in the self-explicated question section
was randomized, respondents might be confused if they returned to the previous screen and saw a different order of features than that they had remembered. Therefore, the "Back" button was removed from the right-click mouse menu and the survey screen.
3.6
Recruiting Process
Sloan administrators were particularly interested in the responses of potential Sloan exec-utive education students. It was believed that these individuals would provide the most useful information to help Sloan administrators identify the key features in this type of program. Therefore, certain criteria were set to identify these individuals, who would then be asked to complete the survey. As an incentive, the respondents would be entered in a lottery for a Sloan-logo laptop bag.
3.6.1 Targeted Respondents
The candidates targeted for this study were primarily potential participants in the Sloan executive education programs because there is a desire to determine what interests prospec-tive students. The targeted respondents were divided into three main groups: prospecprospec-tive candidates with qualifying GMAT scores, MIT alumni, and potential Sloan Fellows from specific companies. Past Management of Technology students were not approached in this survey because it was believed that those individuals might favor a program similar to the one they had experienced and would, therefore, not provide valuable data for the develop-ment of a new program. Instead, the targeted candidates should be prospective students in the present market.
Group 1: GMAT
The candidates in the first group were those who showed interest in the executive education programs, held qualifying GMAT scores from within the last two years, showed certain educational goals, fell within a pre-determined age range, and were geographically located eastward of Mississippi River. The candidates were selected from the Graduate Management Admissions Council using the Graduate Management Admissions Search Service (GMASS). This group was subdivided into three smaller sections: G1, G2, and G3. Candidates in
Massachusetts, lower New Hampshire, or Rhode Island. Candidates in G2 had to be within a one hour flight of campus, defined to include those located in New York, New Jersey, or Connecticut. Candidates in G3 included all other candidates eastward of the Mississippi River. The responses of those candidates in G1 will play an important role in developing the program suitable for a flexible format because these are the individuals who are most likely to take part in the flexible format program due to their geographical location. Group 2: MIT Alumni
The second group of candidates for the survey consisted of both MIT bachelor's graduates from the years 1989 to 1994 and MIT master's graduates from the years 1984 to 1990 from both the Science and Engineering disciplines. A total of 1326 e-mail addresses of MIT alumni were retrieved from the MIT Alumni Association. These individuals were targeted because of their present ages and technological backgrounds, both matching typical prospective Management of Technology students.
Group 3: Potential Sloan Fellows
Many companies have repeatedly supported employees attending the Sloan Fellows program throughout the years. Therefore, it was important to select candidates for this survey from those companies since it is believed that their support will continue. The third group of candidates included past Sloan Fellows and human resource personnel, who are responsible for selecting employees to attend the program, from those companies. The selected individ-uals were asked to complete the survey and also to nominate four to five individindivid-uals within their companies, possible students for the executive education programs, to complete the survey. However, due to privacy concerns, this group had low participation.
3.6.2 Lottery
A lottery to win a laptop bag worth approximately $100 in retail value was held for all respondents who completed the questionnaire. This lottery was used as an incentive for the respondents to enter and complete the survey. The respondents were informed of the lottery in the e-mail invitation and in the survey instructions of the lottery. (See Appendix D) The chances of winning were 1 in 10 for the first group of individuals invited to complete the survey, the GMAT group. Due to budget restrictions and an unexpectedly high response
from the first group of respondents, the number of laptop bags available for the respondents in the remaining two groups was limited, reducing their chances of winning to 1 in 20. Corrections were made to the e-mail invitation and survey instructions to reflect this change.
3.7
Privacy and Security
The entire survey was hosted on a private and secure web server administrated by the MIT Sloan School of Management. Only a select group of individuals involved in maintaining the survey were given access to the machine.
A list of user names and respective passwords was generated and input into the survey database, allowing only those individuals with correct user names and passwords to access the survey. Each user name and password was distributed to a respondent through a per-sonal e-mail with an explanation of the survey. By having the survey on-line and providing a user name and password, the respondent had access to the survey at any time until the survey was closed.
Guidelines from the MIT COUHES were followed to protect the anonymity of all respon-dents. After the target respondents had been identified through GMASS, only their e-mail addresses were required to invite them to participate in the survey. The e-mail addresses were used to send personal e-mail invitations to each of the targeted respondents and to identify the winners of the lottery.
The lottery for laptop bags was performed immediately after the survey was closed for each group of respondents. Only the winners of the lottery were sent an e-mail informing them they had won a laptop bag. The laptop bags were ordered in advance so that they could be immediately distributed to the winning respondents. After the winners were selected and the laptop bags were distributed, there was no longer a need to keep a record of the respondents' names and personal information. Therefore, abiding by MIT COUHES regulations, the names and all personal information were destroyed to maintain respondents' anonymity.
3.8
Survey Distribution
The e-mail notifications for the entire survey were allotted into three groups: the first being GMAT, the next being MIT alumni, and the last being potential Sloan Fellows. Each
personal e-mail invitation explained the purpose of the survey and requested the recipients' participation. The first period of the survey was open to individuals in the GMAT group. Within this group, the e-mails were sent staggered across two days to prevent overloading the web-based survey system. A copy of the e-mail invitation appears in Appendix D.
Changes made to the software after the pretest caused technical difficulties for the first batch of respondents invited to take the survey. The section of conjoint questions was skipped for the 127 respondents from this first batch. The technical error was fixed immediately after it was discovered. A separate e-mail informing them of the technical error was sent to these respondents.
The survey was open to the GMAT group for a total of 13 days. Eight days after the initial e-mail invitations, this first group was given a reminder to complete the survey. The reminder e-mail can be viewed in Appendix D. The survey was closed on the 13th day. The survey was closed for each group when a sufficient number of surveys were completed. Individuals were prompted with a screen notifying them that the survey was closed if they attempted to access it after this point.
The second group of e-mails was sent to the MIT alumni group. A personal e-mail invitation, similar to the one sent to the GMAT group, was distributed. A reminder e-mail was distributed four days after the initial invitation. The survey was closed on the tenth day, after having obtained a satisfactory number of responses.
The third group of e-mails was distributed to contacts within companies, who had previously supported employees who attended the Sloan Fellows program. These contacts were asked to complete the survey and also to nominate four to five employees who were potential Sloan Fellow candidates to complete the survey. After the e-mail addresses of the potential Sloan Fellow candidates were received, a personal e-mail was sent to each candidate. Unfortunately, most contacts in human relations did not provide names or e-mail addresses for further employee contacts within their companies because of concerns about protecting employees' privacy. The survey for this group was closed after only six days because of the low response rate.
3.9
Data Flow
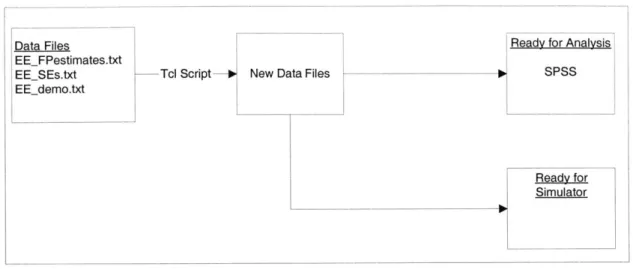
Respondents' answers to the survey questions were recorded in four separate files, EEFPestimates, EEFPques.txt, EESEs.txt, and EE-demos.txt. The files and their de-scriptions are listed in Table 3.2. The files contain place holders for those people who did not respond and those who did not finish.
Table 3.2: Data File Names and Descriptions
Filename Information
EEiFPestimates.txt -rows of conjoint estimates of all feature levels for each respondent -one row per conjoint question
EEFPques.txt -contains the conjoint question asked and the respondent's choice EESEs.txt -numerical ranks of all the features in the self-explicated questions EE-demos.txt -respondent's user name and password
-answers to the demographic questions and career interest questions
Figure 3-9 shows the steps required to format the data files so that they were compatible with the simulator and to SPSS (Statistical Product and Services Solutions, a statistical analysis software package) for analysis. In this study, it was pre-determined that in order for respondents to be considered valid, the respondents must have answered at least eight conjoint questions. A script file using the Tcl scripting language was written in order to format the three relevant files, EEFPestimates.txt, EESEs.txt, and EE.demos.txt, to include only those valid respondents for analysis purposes. The script recorded only the last row of conjoint estimates for those respondents who answered the minimum number of conjoint questions. If the respondent answered less than eight conjoint questions, the script disregarded those respondents' answers. These new files were then hand formatted to remove any extraneous information, such as headings, and then exported into SPSS for analysis. The minimum number of conjoint questions required to include the respondent in the study can be easily adjusted in the script to allow for flexibility in the analysis.
3.10
Response Rate
A response rate under 10% has been reported for web surveys with only a single invitation in the Harris Interactive report, and another source reports a 13% response rate.[7][17]
Data Files Ready for Analysis EE_FPestimates.txt
EE_SEs.txt -Tcl Script-0 New Data Files 0 SPSS
EEdemo.txt
Ready for Simulator
Figure 3-9: Data Flow
A study showed that reminder e-mails helped increase response rate for an e-mail survey by 25%.[18] It was assumed that some respondents in this study were interested in taking the survey but wanted to wait until a more convenient time. A reminder e-mail, which included the closing date of the survey, was e-mailed to the target respondents to encourage participation before the closing date.
The response rate was calculated by dividing the number of respondents who completed the survey by the total number of respondents who received a request to complete the survey. The target respondents were requested to complete the survey through e-mail invitation. It was assumed in the response rate calculation that the target respondents received the e-mail invitation if no error e-mail message was returned to the sender.
3.11
Cluster Analysis
Researchers will often group respondents into several different clusters based on their partial utilities to identify benefit segments. The number of clusters can be specified depending on their planned purpose or inferred from the cluster characteristics. Products or services can then be tailored to each market segment, represented by a cluster. [19] [20] [21]
There are two general approaches to clustering, hierarchical and non-hierarchical. The hierarchical "top-down" method begins with all objects in one cluster. The cluster is then subdivided repeatedly until all objects are left in one of the total specified number of clusters. In the hierarchical "bottom-up" method, the objects begin in their individual