SUPPLEMENTARY TABLES AND FIGURES
Hock, R., A., Bliss, R. Giesen, B. Marzeion, Y. Hirabayashi, M. Huss, V. Radic, A. Slangen (2019).
GlacierMIP - A model intercomparison of global-scale glacier mass-balance models and
projections. J. Glaciol.
Supplementary Tables
Table S1. General Circulation Models (GCM) used by participating glacier models. (p. 2) Table S2. Initial regional glacier area (km2) in 2015 for five glacier models. (p. 3)
Table S3. Initial regional glacier mass (mm sea-level equivalent, SLE) in 2015 for all six glacier models. (p. 4)
Supplementary Figures
Fig. S1. Projected time series of glacier evolution 2015 – 2100 for 19 regions, and globally excluding the Antarctic and Greenland periphery, based on RCP2.6. (p. 5)
Fig. S2. Projected time series of glacier evolution 2015 – 2100 for 19 regions, and globally excluding the Antarctic and Greenland periphery, based on RCP4.5. (p. 6)
Fig. S3. Fig. S3. Projected rates of mass change in m w.e. a-1 (specific mass balances) 2015 – 2100 for
19 regions, and globally excluding the Antarctic and Greenland periphery, based on RCP2.6. (p. 7) Fig. S4. Fig. S3. Projected rates of mass change in m w.e. a-1 (specific mass balances) 2015 – 2100 for
19 regions, and globally excluding the Antarctic and Greenland periphery, based on RCP4.5. (p. 8) Fig. S5. Fig. S3. Projected rates of mass change in m w.e. a-1 (specific mass balances) 2015 – 2100 for
19 regions, and globally excluding the Antarctic and Greenland periphery, based on RCP8.5. (p. 9) Fig. S6. Projected rates of glacier net mass loss (m SLE a-1) 2015 – 2100 for 19 RGI regions from six
glacier models using RCP2.6. (p. 10)
Fig. S7. Projected rates of glacier net mass loss (m SLE a-1) 2015 – 2100 for 19 RGI regions from six
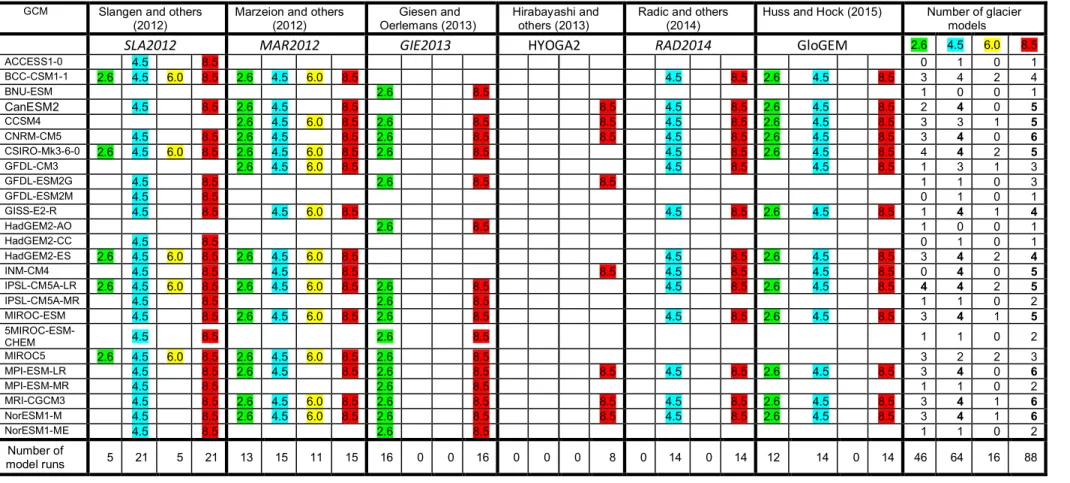
Table S1. General Circulation Models (GCM) used by participating glacier models identified by their references and short names. The numbers 2.6, 4.5, 6.0 and 8.5 refer to the emission scenarios RCP2.6, RCP4.5, RCP6.0 and RCP8.5, respectively. The last four columns denote the number of glacier models forced by the same GCM and emission scenario (highlighted in bold if number >= 4). In total there are 214 model runs.
GCM Slangen and others
(2012) Marzeion and others (2012) Oerlemans (2013) Giesen and Hirabayashi and others (2013) Radic and others (2014) Huss and Hock (2015) Number of glacier models
SLA2012 MAR2012 GIE2013 HYOGA2 RAD2014 GloGEM 2.6 4.5 6.0 8.5
ACCESS1-0 4.5 8.5 0 1 0 1 BCC-CSM1-1 2.6 4.5 6.0 8.5 2.6 4.5 6.0 8.5 4.5 8.5 2.6 4.5 8.5 3 4 2 4 BNU-ESM 2.6 8.5 1 0 0 1 CanESM2 4.5 8.5 2.6 4.5 8.5 8.5 4.5 8.5 2.6 4.5 8.5 2 4 0 5 CCSM4 2.6 4.5 6.0 8.5 2.6 8.5 8.5 4.5 8.5 2.6 4.5 8.5 3 3 1 5 CNRM-CM5 4.5 8.5 2.6 4.5 8.5 2.6 8.5 8.5 4.5 8.5 2.6 4.5 8.5 3 4 0 6 CSIRO-Mk3-6-0 2.6 4.5 6.0 8.5 2.6 4.5 6.0 8.5 2.6 8.5 4.5 8.5 2.6 4.5 8.5 4 4 2 5 GFDL-CM3 2.6 4.5 6.0 8.5 4.5 8.5 4.5 8.5 1 3 1 3 GFDL-ESM2G 4.5 8.5 2.6 8.5 8.5 1 1 0 3 GFDL-ESM2M 4.5 8.5 0 1 0 1 GISS-E2-R 4.5 8.5 4.5 6.0 8.5 4.5 8.5 2.6 4.5 8.5 1 4 1 4 HadGEM2-AO 2.6 8.5 1 0 0 1 HadGEM2-CC 4.5 8.5 0 1 0 1 HadGEM2-ES 2.6 4.5 6.0 8.5 2.6 4.5 6.0 8.5 4.5 8.5 2.6 4.5 8.5 3 4 2 4 INM-CM4 4.5 8.5 4.5 8.5 8.5 4.5 8.5 4.5 8.5 0 4 0 5 IPSL-CM5A-LR 2.6 4.5 6.0 8.5 2.6 4.5 6.0 8.5 2.6 8.5 4.5 8.5 2.6 4.5 8.5 4 4 2 5 IPSL-CM5A-MR 4.5 8.5 2.6 8.5 1 1 0 2 MIROC-ESM 4.5 8.5 2.6 4.5 6.0 8.5 2.6 8.5 4.5 8.5 2.6 4.5 8.5 3 4 1 5 5MIROC-ESM-CHEM 4.5 8.5 2.6 8.5 1 1 0 2 MIROC5 2.6 4.5 6.0 8.5 2.6 4.5 6.0 8.5 2.6 8.5 3 2 2 3 MPI-ESM-LR 4.5 8.5 2.6 4.5 8.5 2.6 8.5 8.5 4.5 8.5 2.6 4.5 8.5 3 4 0 6 MPI-ESM-MR 4.5 8.5 2.6 8.5 1 1 0 2 MRI-CGCM3 4.5 8.5 2.6 4.5 6.0 8.5 2.6 8.5 8.5 4.5 8.5 2.6 4.5 8.5 3 4 1 6 NorESM1-M 4.5 8.5 2.6 4.5 6.0 8.5 2.6 8.5 8.5 4.5 8.5 2.6 4.5 8.5 3 4 1 6 NorESM1-ME 4.5 8.5 2.6 8.5 1 1 0 2 Number of model runs 5 21 5 21 13 15 11 15 16 0 0 16 0 0 0 8 0 14 0 14 12 14 0 14 46 64 16 88
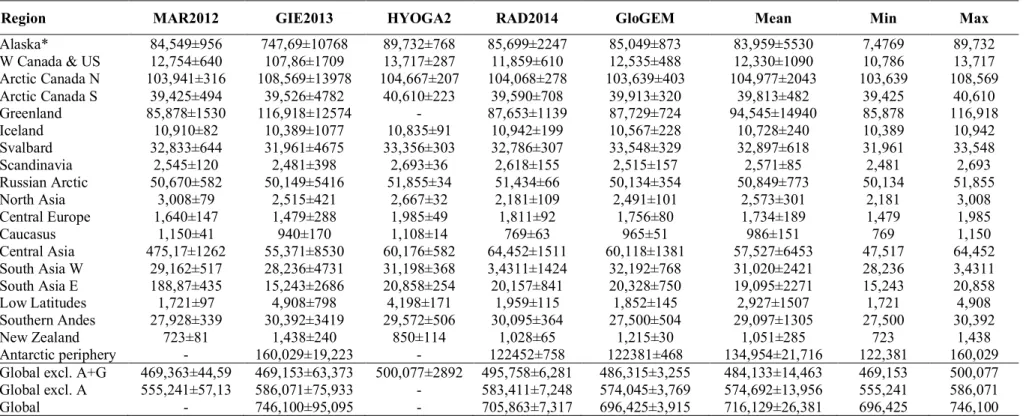
Table S2. Initial regional glacier area (km2) in 2015 for five glacier models. Values refer to arithmetic mean ± standard deviation of all model runs
with the same glacier model forced by each model’s set of GCM and RCP. Areas in 2015 vary for the same model since model simulations start before 2015, and the evolving area depends on the climate scenario. Mean refers to the arithmetic mean of all six models’ multi-scenario means (± their standard deviation). Min and Max refers to the minimum and maximum area of the models’ multi-scenario means. Global area, global area excluding the Antarctic periphery (A), and global area excluding the Antarctic and Greenland periphery (A+G) are also given. Area data for SLA2012 are not available.
Region MAR2012 GIE2013 HYOGA2 RAD2014 GloGEM Mean Min Max
Alaska* 84,549±956 747,69±10768 89,732±768 85,699±2247 85,049±873 83,959±5530 7,4769 89,732 W Canada & US 12,754±640 107,86±1709 13,717±287 11,859±610 12,535±488 12,330±1090 10,786 13,717 Arctic Canada N 103,941±316 108,569±13978 104,667±207 104,068±278 103,639±403 104,977±2043 103,639 108,569 Arctic Canada S 39,425±494 39,526±4782 40,610±223 39,590±708 39,913±320 39,813±482 39,425 40,610 Greenland 85,878±1530 116,918±12574 - 87,653±1139 87,729±724 94,545±14940 85,878 116,918 Iceland 10,910±82 10,389±1077 10,835±91 10,942±199 10,567±228 10,728±240 10,389 10,942 Svalbard 32,833±644 31,961±4675 33,356±303 32,786±307 33,548±329 32,897±618 31,961 33,548 Scandinavia 2,545±120 2,481±398 2,693±36 2,618±155 2,515±157 2,571±85 2,481 2,693 Russian Arctic 50,670±582 50,149±5416 51,855±34 51,434±66 50,134±354 50,849±773 50,134 51,855 North Asia 3,008±79 2,515±421 2,667±32 2,181±109 2,491±101 2,573±301 2,181 3,008 Central Europe 1,640±147 1,479±288 1,985±49 1,811±92 1,756±80 1,734±189 1,479 1,985 Caucasus 1,150±41 940±170 1,108±14 769±63 965±51 986±151 769 1,150 Central Asia 475,17±1262 55,371±8530 60,176±582 64,452±1511 60,118±1381 57,527±6453 47,517 64,452 South Asia W 29,162±517 28,236±4731 31,198±368 3,4311±1424 32,192±768 31,020±2421 28,236 3,4311 South Asia E 188,87±435 15,243±2686 20,858±254 20,157±841 20,328±750 19,095±2271 15,243 20,858 Low Latitudes 1,721±97 4,908±798 4,198±171 1,959±115 1,852±145 2,927±1507 1,721 4,908 Southern Andes 27,928±339 30,392±3419 29,572±506 30,095±364 27,500±504 29,097±1305 27,500 30,392 New Zealand 723±81 1,438±240 850±114 1,028±65 1,215±30 1,051±285 723 1,438 Antarctic periphery - 160,029±19,223 - 122452±758 122381±468 134,954±21,716 122,381 160,029
Global excl. A+G 469,363±44,59 469,153±63,373 500,077±2892 495,758±6,281 486,315±3,255 484,133±14,463 469,153 500,077
Global excl. A 555,241±57,13 586,071±75,933 - 583,411±7,248 574,045±3,769 574,692±13,956 555,241 586,071
Global - 746,100±95,095 - 705,863±7,317 696,425±3,915 716,129±26,381 696,425 746,100
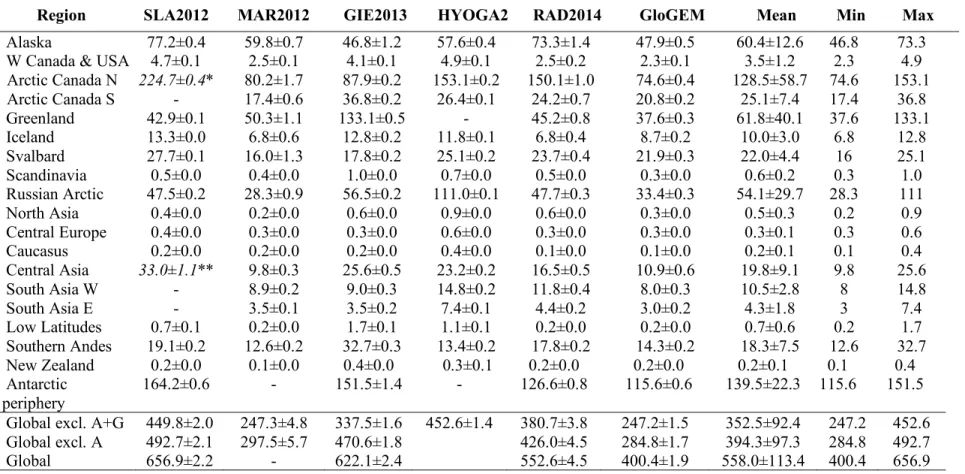
Table S3. Initial regional glacier mass (mm sea-level equivalent, SLE) in 2015 for all six glacier models. Values refer to arithmetic mean ± standard deviation of all model runs with the same glacier model forced by each model’s set of GCM and RCP. Volumes in 2015 vary for the same model since model simulations start before 2015, and the evolving volume depends on the climate scenario. Mean refers to the arithmetic mean of all 6 models’ multi-scenario means (± their standard deviation). Min and Max refers to the minimum and maximum mass of the models’ multi-multi-scenario means. Global volume, global volume excluding the Antarctic periphery (A), and global area excluding the Antarctic and Greenland periphery (A+G) are also given.
Region SLA2012 MAR2012 GIE2013 HYOGA2 RAD2014 GloGEM Mean Min Max
Alaska 77.2±0.4 59.8±0.7 46.8±1.2 57.6±0.4 73.3±1.4 47.9±0.5 60.4±12.6 46.8 73.3 W Canada & USA 4.7±0.1 2.5±0.1 4.1±0.1 4.9±0.1 2.5±0.2 2.3±0.1 3.5±1.2 2.3 4.9 Arctic Canada N 224.7±0.4* 80.2±1.7 87.9±0.2 153.1±0.2 150.1±1.0 74.6±0.4 128.5±58.7 74.6 153.1 Arctic Canada S - 17.4±0.6 36.8±0.2 26.4±0.1 24.2±0.7 20.8±0.2 25.1±7.4 17.4 36.8 Greenland 42.9±0.1 50.3±1.1 133.1±0.5 - 45.2±0.8 37.6±0.3 61.8±40.1 37.6 133.1 Iceland 13.3±0.0 6.8±0.6 12.8±0.2 11.8±0.1 6.8±0.4 8.7±0.2 10.0±3.0 6.8 12.8 Svalbard 27.7±0.1 16.0±1.3 17.8±0.2 25.1±0.2 23.7±0.4 21.9±0.3 22.0±4.4 16 25.1 Scandinavia 0.5±0.0 0.4±0.0 1.0±0.0 0.7±0.0 0.5±0.0 0.3±0.0 0.6±0.2 0.3 1.0 Russian Arctic 47.5±0.2 28.3±0.9 56.5±0.2 111.0±0.1 47.7±0.3 33.4±0.3 54.1±29.7 28.3 111 North Asia 0.4±0.0 0.2±0.0 0.6±0.0 0.9±0.0 0.6±0.0 0.3±0.0 0.5±0.3 0.2 0.9 Central Europe 0.4±0.0 0.3±0.0 0.3±0.0 0.6±0.0 0.3±0.0 0.3±0.0 0.3±0.1 0.3 0.6 Caucasus 0.2±0.0 0.2±0.0 0.2±0.0 0.4±0.0 0.1±0.0 0.1±0.0 0.2±0.1 0.1 0.4 Central Asia 33.0±1.1** 9.8±0.3 25.6±0.5 23.2±0.2 16.5±0.5 10.9±0.6 19.8±9.1 9.8 25.6 South Asia W - 8.9±0.2 9.0±0.3 14.8±0.2 11.8±0.4 8.0±0.3 10.5±2.8 8 14.8 South Asia E - 3.5±0.1 3.5±0.2 7.4±0.1 4.4±0.2 3.0±0.2 4.3±1.8 3 7.4 Low Latitudes 0.7±0.1 0.2±0.0 1.7±0.1 1.1±0.1 0.2±0.0 0.2±0.0 0.7±0.6 0.2 1.7 Southern Andes 19.1±0.2 12.6±0.2 32.7±0.3 13.4±0.2 17.8±0.2 14.3±0.2 18.3±7.5 12.6 32.7 New Zealand 0.2±0.0 0.1±0.0 0.4±0.0 0.3±0.1 0.2±0.0 0.2±0.0 0.2±0.1 0.1 0.4 Antarctic periphery 164.2±0.6 - 151.5±1.4 - 126.6±0.8 115.6±0.6 139.5±22.3 115.6 151.5 Global excl. A+G 449.8±2.0 247.3±4.8 337.5±1.6 452.6±1.4 380.7±3.8 247.2±1.5 352.5±92.4 247.2 452.6 Global excl. A 492.7±2.1 297.5±5.7 470.6±1.8 426.0±4.5 284.8±1.7 394.3±97.3 284.8 492.7
Global 656.9±2.2 - 622.1±2.4 552.6±4.5 400.4±1.9 558.0±113.4 400.4 656.9
*Volume includes both Arctic Canada N and S
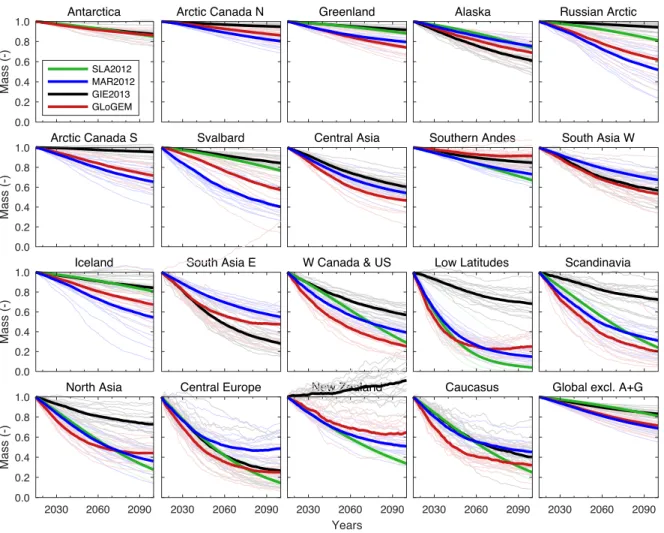
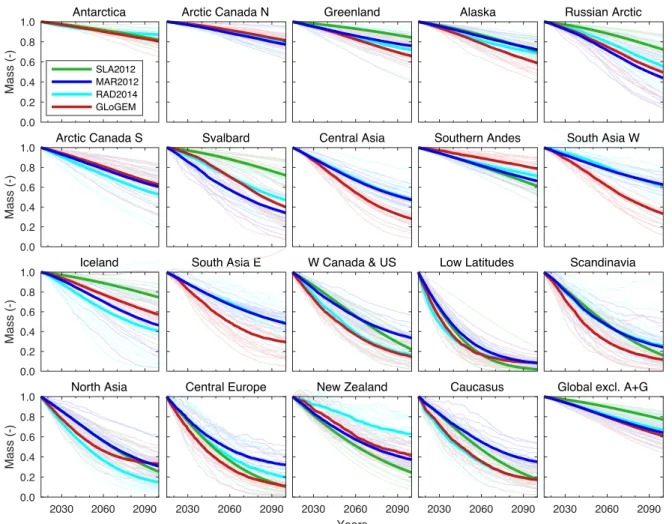
Fig. S1. Projected time series of glacier evolution 2015 – 2100 for 19 regions, and globally excluding the Antarctic and Greenland periphery (A+G), based on RCP2.6. Glacier mass is normalized to mass in 2015. Thick lines show multi-GCM means and thin lines mark the results from individual GCMs. Projections for the two Arctic Canada and three High Mountain Asia regions are not available spatially differentiated from SLA2012. Regions are sorted according to initial glacier mass in 2015.
Antarctica 0.0 0.2 0.4 0.6 0.8 1.0 Mass (-) SLA2012 MAR2012 GIE2013 GLoGEM
Arctic Canada N Greenland Alaska Russian Arctic
Arctic Canada S 0.0 0.2 0.4 0.6 0.8 1.0 Mass (-)
Svalbard Central Asia Southern Andes South Asia W
Iceland 0.0 0.2 0.4 0.6 0.8 1.0 Mass (-)
South Asia E W Canada & US Low Latitudes Scandinavia
North Asia 2030 2060 2090 0.0 0.2 0.4 0.6 0.8 1.0 Mass (-) Central Europe 2030 2060 2090 New Zealand 2030 2060 2090 Years Caucasus 2030 2060 2090
Global excl. A+G
Fig. S2. Projected time series of glacier evolution 2015 – 2100 for 19 regions, and globally excluding the Antarctic and Greenland periphery (A+G), based on RCP4.5. Glacier mass is normalized to mass in 2015. Thick lines show multi-GCM means and thin lines mark the results from individual GCMs. Projections for the two Arctic Canada and three High Mountain Asia regions are not available spatially differentiated from SLA2012. Regions are sorted according to initial glacier mass in 2015. Antarctica 0.0 0.2 0.4 0.6 0.8 1.0 Mass (-) SLA2012 MAR2012 RAD2014 GLoGEM
Arctic Canada N Greenland Alaska Russian Arctic
Arctic Canada S 0.0 0.2 0.4 0.6 0.8 1.0 Mass (-)
Svalbard Central Asia Southern Andes South Asia W
Iceland 0.0 0.2 0.4 0.6 0.8 1.0 Mass (-)
South Asia E W Canada & US Low Latitudes Scandinavia
North Asia 2030 2060 2090 0.0 0.2 0.4 0.6 0.8 1.0 Mass (-) Central Europe 2030 2060 2090 New Zealand 2030 2060 2090 Years Caucasus 2030 2060 2090
Global excl. A+G
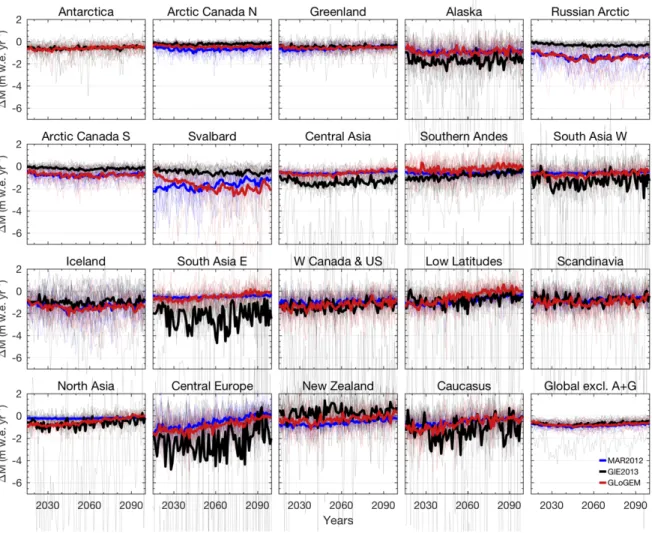
Fig. S3. Projected rates of mass change in m w.e. a-1 (specific mass balances) 2015 – 2100 for 19
regions, and globally excluding the Antarctic and Greenland periphery (A+G), based on RCP2.6. Thick lines show multi-GCM means and thin lines mark the results from individual GCMs. Regions are sorted according to initial glacier mass in 2015.
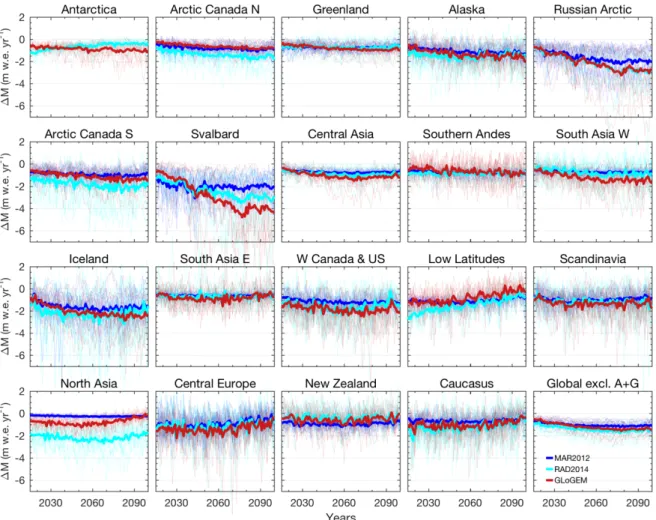
Fig. S4. Projected rates of mass change in m w.e. a-1 (specific mass balances) 2015 – 2100 for 19
regions, and globally excluding the Antarctic and Greenland periphery (A+G), based on RCP4.5. Thick lines show multi-GCM means and thin lines mark the results from individual GCMs. Regions are sorted according to initial glacier mass in 2015.
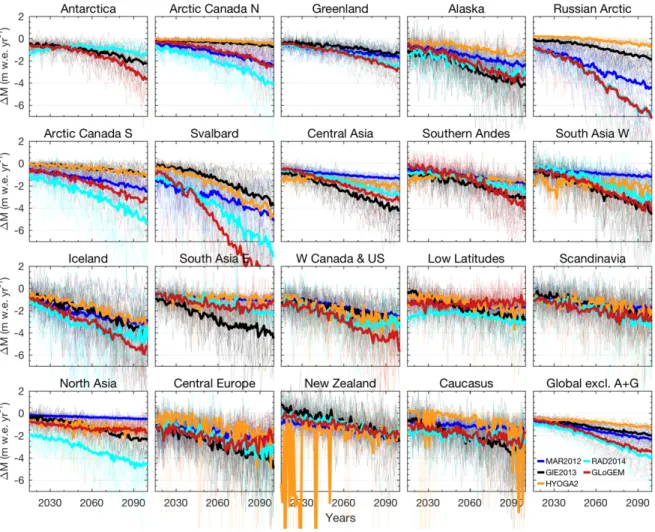
Fig. S5. Projected rates of mass change in m w.e. a-1 (specific mass balances) 2015 – 2100 for 19
regions, and globally excluding Antarctica and Greenland periphery (A+G), based on RCP8.5. Thick lines show multi-GCM means and thin lines mark the results from individual GCMs. Regions are sorted according to initial glacier mass in 2015.
Fig. S6. Projected rates of glacier net mass loss (m SLE a-1) 2015 – 2100 for 19 RGI regions from six
glacier models using RCP2.6. Also shown are global mass losses excluding the Antarctic and Greenland periphery (A+G), based on RCP2.6. Projections for the two Arctic Canada and three High Mountain Asia regions are not available spatially differentiated from SLA2012. Regions are sorted according to initial glacier mass in 2015.
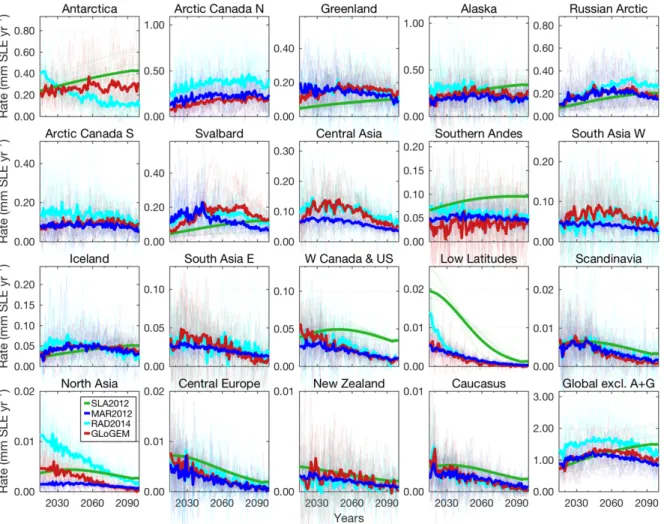
Fig. S7. Projected rates of glacier net mass loss (m SLE a-1) 2015 – 2100 for 19 RGI regions from six
glacier models using RCP4.5. Also shown are global mass losses excluding the Antarctic and Greenland periphery (A+G). Projections for the two Arctic Canada and three High Mountain Asia regions are not available spatially differentiated from SLA2012. Regions are sorted according to initial glacier mass in 2015.