Supporting Information
Supporting Figure Legends
Figure S1. Example of a thermal performance curve. Topt is the optimal temperature, the
temperature at which performance is maximal (umax); CTmin and CTmax are the critical
thermal limits that permit performance; B is the performance breadth, the range over which performance is above some arbitrary level. Modified after Gilchrist (1995). Also see Introduction and Materials and Methods.
Figure S2. Mean temperatures for all locations-of-origin (± 10-40 km) for the populations
examined in this study. The dashed horizontal line represents the 12°C limit for the development of D. melanogaster. For details see Material and Methods.
Figure S3. The area of the wing used for wing area measurements. For details see Material
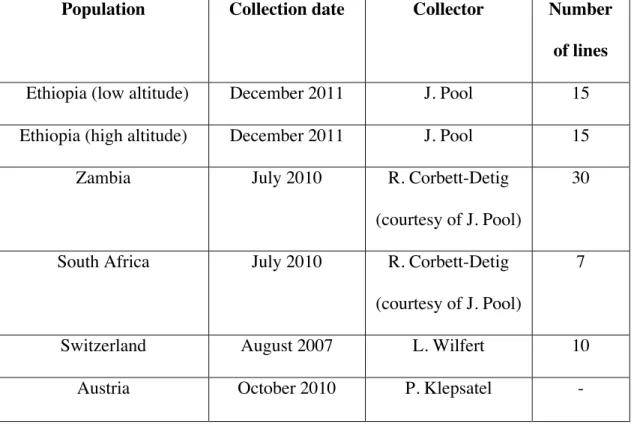
Table S1. Populations, collection dates, collectors and the number of isofemale lines for
each of the populations used in this study. Also see Table 1 and Materials and Methods for further details.
Population Collection date Collector Number of lines
Ethiopia (low altitude) December 2011 J. Pool 15
Ethiopia (high altitude) December 2011 J. Pool 15
Zambia July 2010 R. Corbett-Detig
(courtesy of J. Pool)
30
South Africa July 2010 R. Corbett-Detig
(courtesy of J. Pool)
7
Switzerland August 2007 L. Wilfert 10
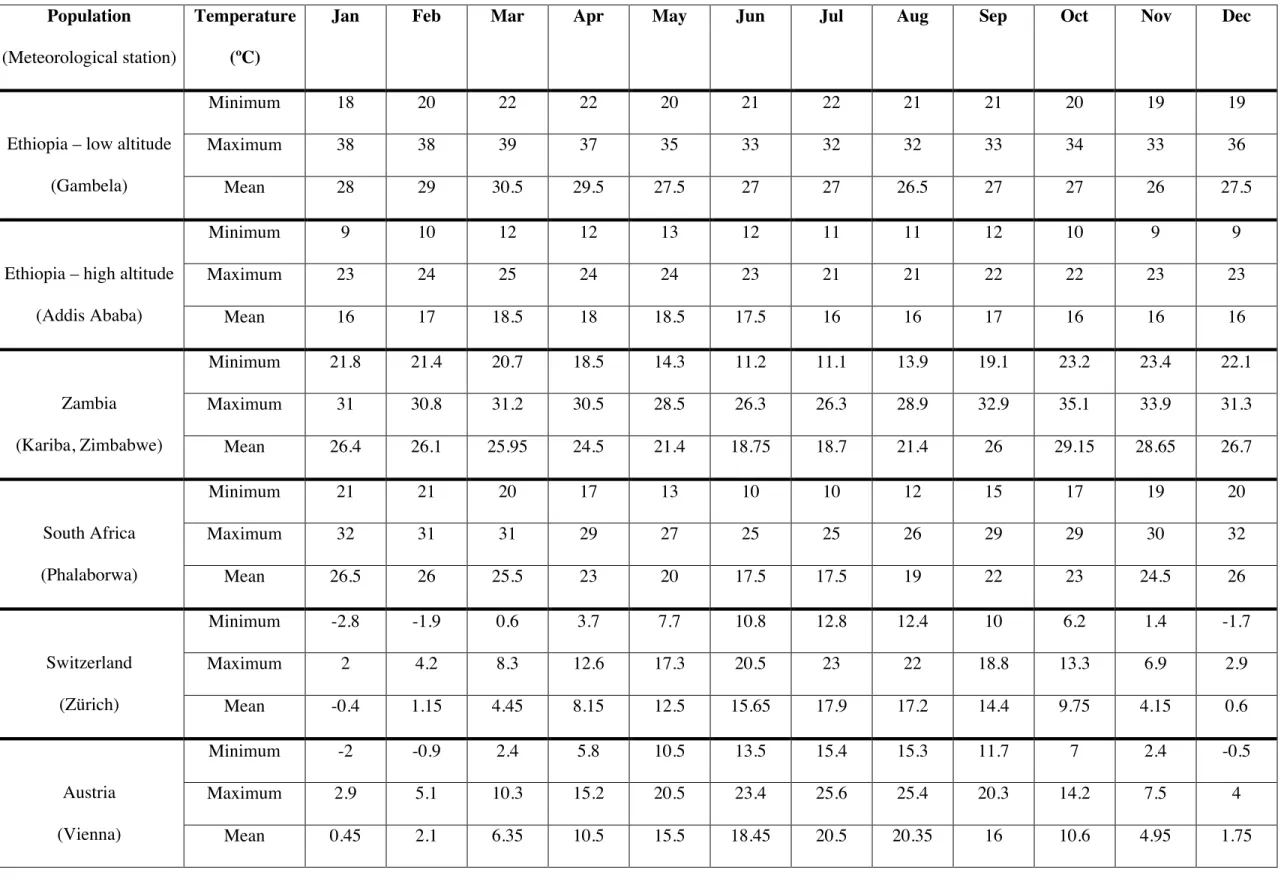
Table S2. Climate data. Average daily minimum, maximum and mean air temperatures for all locations-of-origin (±10-40 km). Data obtained from the World Meteorological
Organization (worldweather.wmo.int). See Materials and Methods for further details; also see Table 1 and Figure S2.
Population
(Meteorological station)
Temperature (ºC)
Jan Feb Mar Apr May Jun Jul Aug Sep Oct Nov Dec
Ethiopia – low altitude (Gambela)
Minimum 18 20 22 22 20 21 22 21 21 20 19 19
Maximum 38 38 39 37 35 33 32 32 33 34 33 36
Mean 28 29 30.5 29.5 27.5 27 27 26.5 27 27 26 27.5
Ethiopia – high altitude (Addis Ababa) Minimum 9 10 12 12 13 12 11 11 12 10 9 9 Maximum 23 24 25 24 24 23 21 21 22 22 23 23 Mean 16 17 18.5 18 18.5 17.5 16 16 17 16 16 16 Zambia (Kariba, Zimbabwe) Minimum 21.8 21.4 20.7 18.5 14.3 11.2 11.1 13.9 19.1 23.2 23.4 22.1 Maximum 31 30.8 31.2 30.5 28.5 26.3 26.3 28.9 32.9 35.1 33.9 31.3 Mean 26.4 26.1 25.95 24.5 21.4 18.75 18.7 21.4 26 29.15 28.65 26.7 South Africa (Phalaborwa) Minimum 21 21 20 17 13 10 10 12 15 17 19 20 Maximum 32 31 31 29 27 25 25 26 29 29 30 32 Mean 26.5 26 25.5 23 20 17.5 17.5 19 22 23 24.5 26 Switzerland (Zürich) Minimum -2.8 -1.9 0.6 3.7 7.7 10.8 12.8 12.4 10 6.2 1.4 -1.7 Maximum 2 4.2 8.3 12.6 17.3 20.5 23 22 18.8 13.3 6.9 2.9 Mean -0.4 1.15 4.45 8.15 12.5 15.65 17.9 17.2 14.4 9.75 4.15 0.6 Austria (Vienna) Minimum -2 -0.9 2.4 5.8 10.5 13.5 15.4 15.3 11.7 7 2.4 -0.5 Maximum 2.9 5.1 10.3 15.2 20.5 23.4 25.6 25.4 20.3 14.2 7.5 4 Mean 0.45 2.1 6.35 10.5 15.5 18.45 20.5 20.35 16 10.6 4.95 1.75
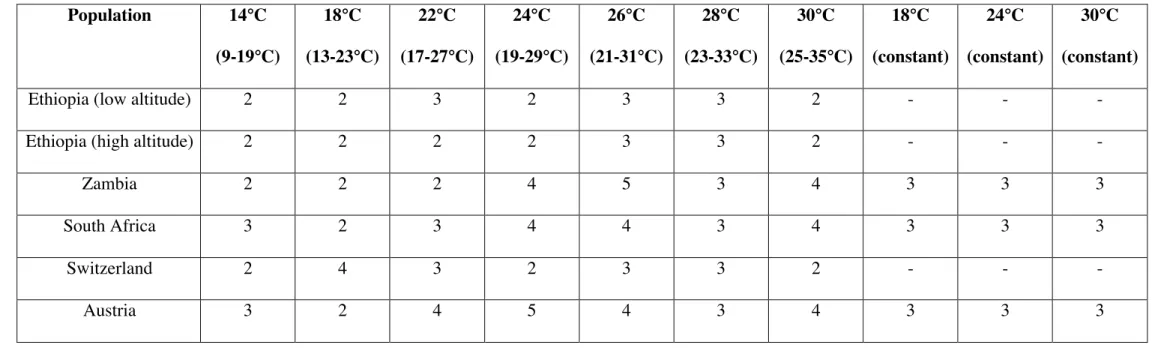
Table S3. Number of replicate cages used in fecundity experiments. See Materials and Methods for further details. Population 14°C (9-19°C) 18°C (13-23°C) 22°C (17-27°C) 24°C (19-29°C) 26°C (21-31°C) 28°C (23-33°C) 30°C (25-35°C) 18°C (constant) 24°C (constant) 30°C (constant)
Ethiopia (low altitude) 2 2 3 2 3 3 2 - - -
Ethiopia (high altitude) 2 2 2 2 3 3 2 - - -
Zambia 2 2 2 4 5 3 4 3 3 3
South Africa 3 2 3 4 4 3 4 3 3 3
Switzerland 2 4 3 2 3 3 2 - - -
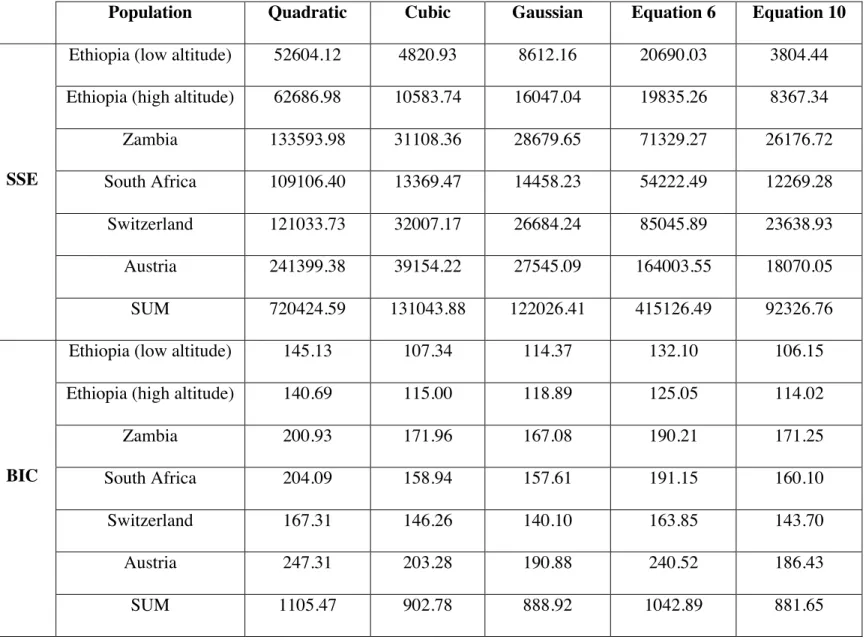
Table S4. Sums of squared errors (SSE) and values of Bayesian Information Criterion (BIC) for different functions
(quadratic, cubic, Gaussian, functions (6) and (10) from Logan et al. (1976)) fitted to fecundity data. See Materials and Methods for further details.
Population Quadratic Cubic Gaussian Equation 6 Equation 10
SSE
Ethiopia (low altitude) 52604.12 4820.93 8612.16 20690.03 3804.44
Ethiopia (high altitude) 62686.98 10583.74 16047.04 19835.26 8367.34
Zambia 133593.98 31108.36 28679.65 71329.27 26176.72 South Africa 109106.40 13369.47 14458.23 54222.49 12269.28 Switzerland 121033.73 32007.17 26684.24 85045.89 23638.93 Austria 241399.38 39154.22 27545.09 164003.55 18070.05 SUM 720424.59 131043.88 122026.41 415126.49 92326.76 BIC
Ethiopia (low altitude) 145.13 107.34 114.37 132.10 106.15
Ethiopia (high altitude) 140.69 115.00 118.89 125.05 114.02
Zambia 200.93 171.96 167.08 190.21 171.25
South Africa 204.09 158.94 157.61 191.15 160.10
Switzerland 167.31 146.26 140.10 163.85 143.70
Austria 247.31 203.28 190.88 240.52 186.43
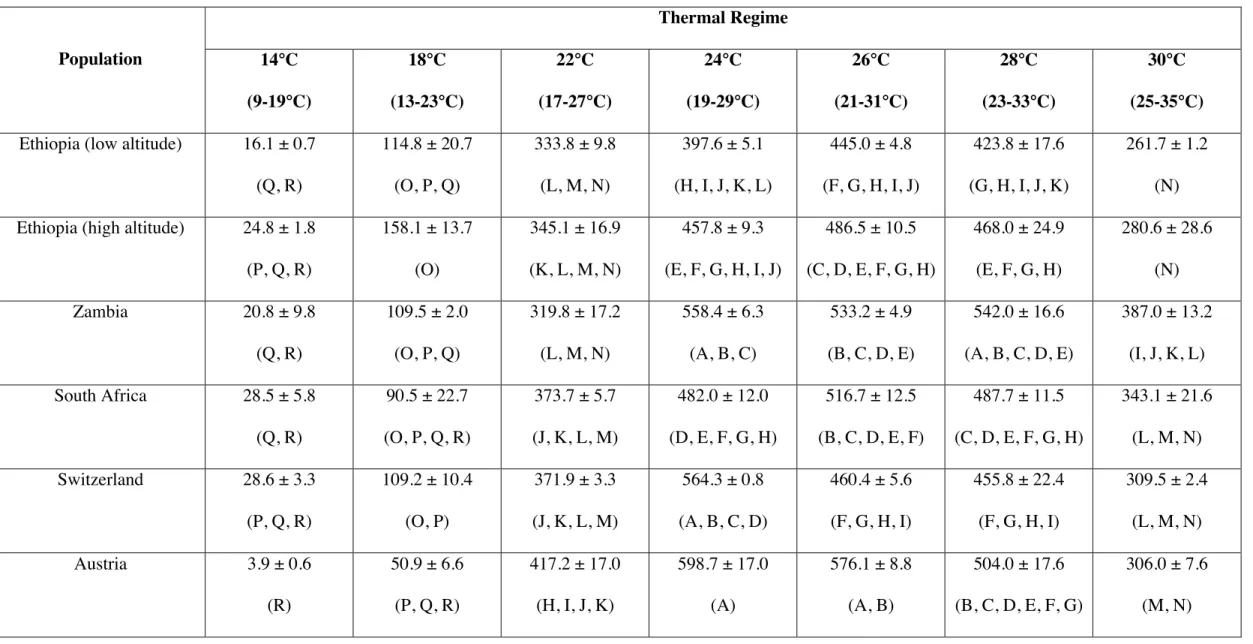
Table S5. Means and standard errors of the mean for absolute fecundity, measured at different (mean) temperatures. For ANOVA results see main text; values not connected by
the same letter are significantly different (Tukey’s HSD test; P < 0.05).
Population Thermal Regime 14°C (9-19°C) 18°C (13-23°C) 22°C (17-27°C) 24°C (19-29°C) 26°C (21-31°C) 28°C (23-33°C) 30°C (25-35°C)
Ethiopia (low altitude) 16.1 ± 0.7 (Q, R) 114.8 ± 20.7 (O, P, Q) 333.8 ± 9.8 (L, M, N) 397.6 ± 5.1 (H, I, J, K, L) 445.0 ± 4.8 (F, G, H, I, J) 423.8 ± 17.6 (G, H, I, J, K) 261.7 ± 1.2 (N) Ethiopia (high altitude) 24.8 ± 1.8
(P, Q, R) 158.1 ± 13.7 (O) 345.1 ± 16.9 (K, L, M, N) 457.8 ± 9.3 (E, F, G, H, I, J) 486.5 ± 10.5 (C, D, E, F, G, H) 468.0 ± 24.9 (E, F, G, H) 280.6 ± 28.6 (N) Zambia 20.8 ± 9.8 (Q, R) 109.5 ± 2.0 (O, P, Q) 319.8 ± 17.2 (L, M, N) 558.4 ± 6.3 (A, B, C) 533.2 ± 4.9 (B, C, D, E) 542.0 ± 16.6 (A, B, C, D, E) 387.0 ± 13.2 (I, J, K, L) South Africa 28.5 ± 5.8 (Q, R) 90.5 ± 22.7 (O, P, Q, R) 373.7 ± 5.7 (J, K, L, M) 482.0 ± 12.0 (D, E, F, G, H) 516.7 ± 12.5 (B, C, D, E, F) 487.7 ± 11.5 (C, D, E, F, G, H) 343.1 ± 21.6 (L, M, N) Switzerland 28.6 ± 3.3 (P, Q, R) 109.2 ± 10.4 (O, P) 371.9 ± 3.3 (J, K, L, M) 564.3 ± 0.8 (A, B, C, D) 460.4 ± 5.6 (F, G, H, I) 455.8 ± 22.4 (F, G, H, I) 309.5 ± 2.4 (L, M, N) Austria 3.9 ± 0.6 (R) 50.9 ± 6.6 (P, Q, R) 417.2 ± 17.0 (H, I, J, K) 598.7 ± 17.0 (A) 576.1 ± 8.8 (A, B) 504.0 ± 17.6 (B, C, D, E, F, G) 306.0 ± 7.6 (M, N)
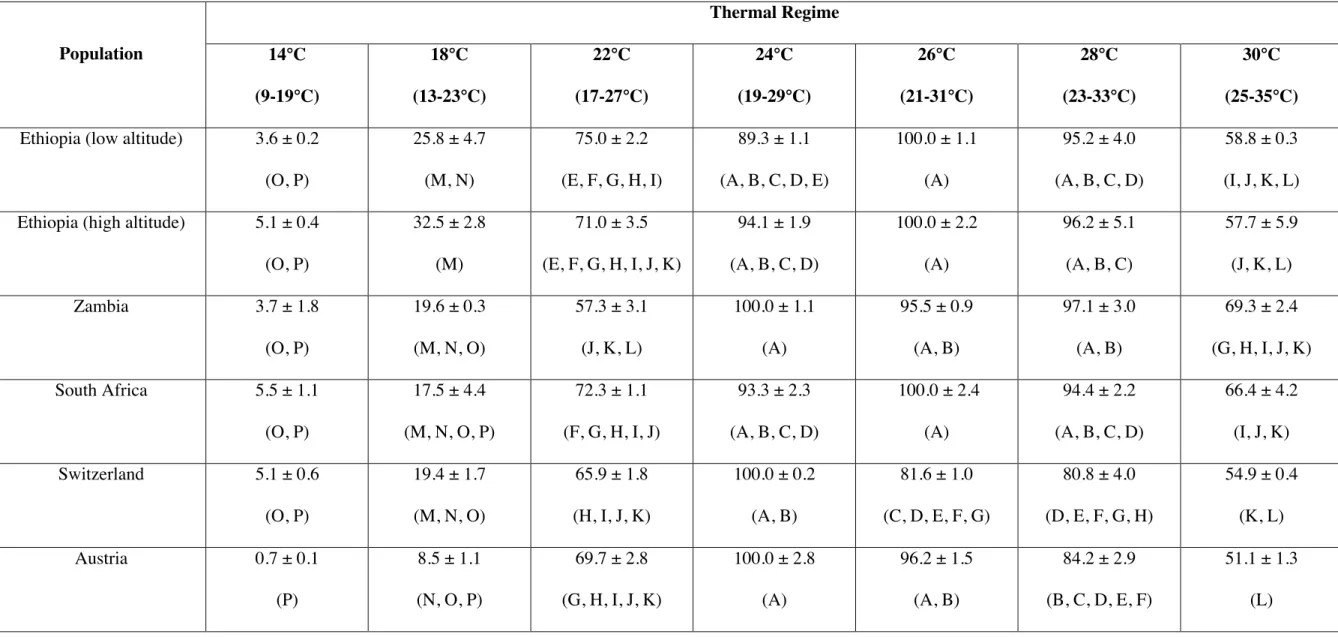
Table S6. Means and standard errors of the mean for relative fecundity, measured at different (mean) temperatures. For ANOVA results see main text; values not connected by the
same letter are significantly different (Tukey’s HSD test; P < 0.05).
Population Thermal Regime 14°C (9-19°C) 18°C (13-23°C) 22°C (17-27°C) 24°C (19-29°C) 26°C (21-31°C) 28°C (23-33°C) 30°C (25-35°C)
Ethiopia (low altitude) 3.6 ± 0.2 (O, P) 25.8 ± 4.7 (M, N) 75.0 ± 2.2 (E, F, G, H, I) 89.3 ± 1.1 (A, B, C, D, E) 100.0 ± 1.1 (A) 95.2 ± 4.0 (A, B, C, D) 58.8 ± 0.3 (I, J, K, L) Ethiopia (high altitude) 5.1 ± 0.4
(O, P) 32.5 ± 2.8 (M) 71.0 ± 3.5 (E, F, G, H, I, J, K) 94.1 ± 1.9 (A, B, C, D) 100.0 ± 2.2 (A) 96.2 ± 5.1 (A, B, C) 57.7 ± 5.9 (J, K, L) Zambia 3.7 ± 1.8 (O, P) 19.6 ± 0.3 (M, N, O) 57.3 ± 3.1 (J, K, L) 100.0 ± 1.1 (A) 95.5 ± 0.9 (A, B) 97.1 ± 3.0 (A, B) 69.3 ± 2.4 (G, H, I, J, K) South Africa 5.5 ± 1.1 (O, P) 17.5 ± 4.4 (M, N, O, P) 72.3 ± 1.1 (F, G, H, I, J) 93.3 ± 2.3 (A, B, C, D) 100.0 ± 2.4 (A) 94.4 ± 2.2 (A, B, C, D) 66.4 ± 4.2 (I, J, K) Switzerland 5.1 ± 0.6 (O, P) 19.4 ± 1.7 (M, N, O) 65.9 ± 1.8 (H, I, J, K) 100.0 ± 0.2 (A, B) 81.6 ± 1.0 (C, D, E, F, G) 80.8 ± 4.0 (D, E, F, G, H) 54.9 ± 0.4 (K, L) Austria 0.7 ± 0.1 (P) 8.5 ± 1.1 (N, O, P) 69.7 ± 2.8 (G, H, I, J, K) 100.0 ± 2.8 (A) 96.2 ± 1.5 (A, B) 84.2 ± 2.9 (B, C, D, E, F) 51.1 ± 1.3 (L)
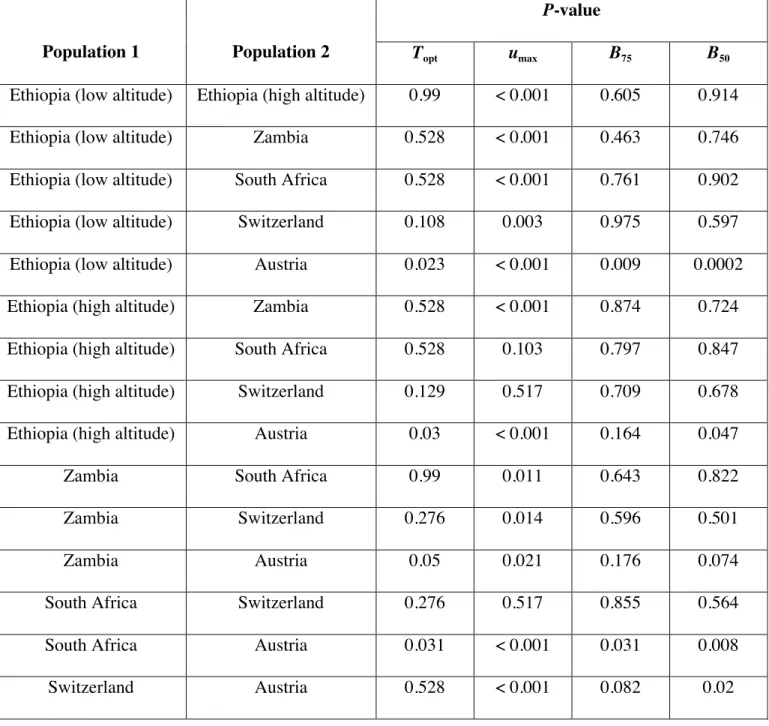
Table S7. Bootstrap P-values for pairwise comparisons of different parameters of fecundity
performance curves. Topt is the optimal temperature, the temperature at which performance is
maximal (umax); B75 and B50 are the 75% and 50% performance breadths, respectively. P-values
were corrected for multiple testing using the Benjamini-Hochberg procedure.
Population 1 Population 2
P-value
Topt umax B75 B50
Ethiopia (low altitude) Ethiopia (high altitude) 0.99 < 0.001 0.605 0.914
Ethiopia (low altitude) Zambia 0.528 < 0.001 0.463 0.746
Ethiopia (low altitude) South Africa 0.528 < 0.001 0.761 0.902
Ethiopia (low altitude) Switzerland 0.108 0.003 0.975 0.597
Ethiopia (low altitude) Austria 0.023 < 0.001 0.009 0.0002
Ethiopia (high altitude) Zambia 0.528 < 0.001 0.874 0.724
Ethiopia (high altitude) South Africa 0.528 0.103 0.797 0.847
Ethiopia (high altitude) Switzerland 0.129 0.517 0.709 0.678
Ethiopia (high altitude) Austria 0.03 < 0.001 0.164 0.047
Zambia South Africa 0.99 0.011 0.643 0.822
Zambia Switzerland 0.276 0.014 0.596 0.501
Zambia Austria 0.05 0.021 0.176 0.074
South Africa Switzerland 0.276 0.517 0.855 0.564
South Africa Austria 0.031 < 0.001 0.031 0.008
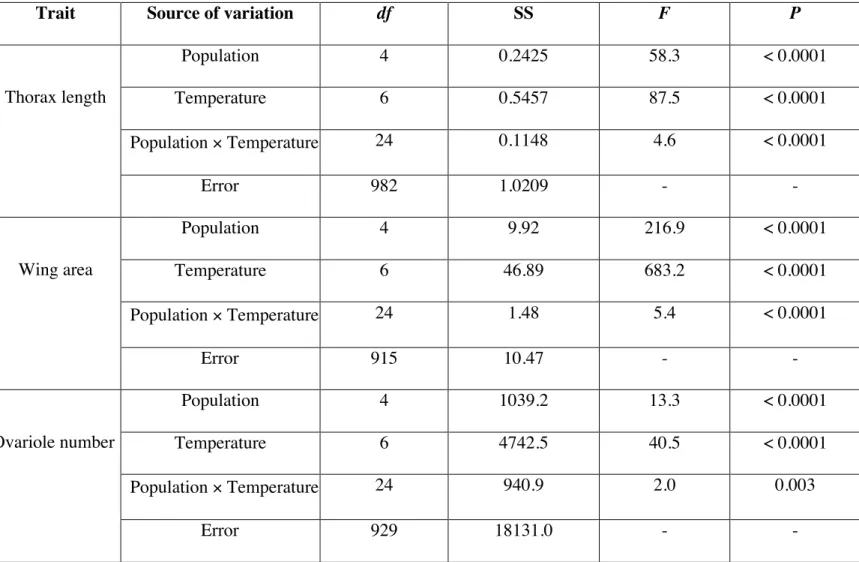
Table S8. Fully-factorial, two-way fixed-effects ANOVA models for morphological traits.
Trait Source of variation df SS F P
Thorax length Population 4 0.2425 58.3 < 0.0001 Temperature 6 0.5457 87.5 < 0.0001 Population × Temperature 24 0.1148 4.6 < 0.0001 Error 982 1.0209 - - Wing area Population 4 9.92 216.9 < 0.0001 Temperature 6 46.89 683.2 < 0.0001 Population × Temperature 24 1.48 5.4 < 0.0001 Error 915 10.47 - - Ovariole number Population 4 1039.2 13.3 < 0.0001 Temperature 6 4742.5 40.5 < 0.0001 Population × Temperature 24 940.9 2.0 0.003 Error 929 18131.0 - -
Wing loading Population 4 0.171 18.4 < 0.0001 Temperature 6 1.469 105.4 < 0.0001 Population × Temperature 24 0.186 3.3 < 0.0001 Error 914 2.124 - - Ovariole index Population 4 1527.8 19.8 < 0.0001 Temperature 6 8592.6 74.1 < 0.0001 Population × Temperature 24 1646.3 3.6 < 0.0001 Error 926 17896.6 - -
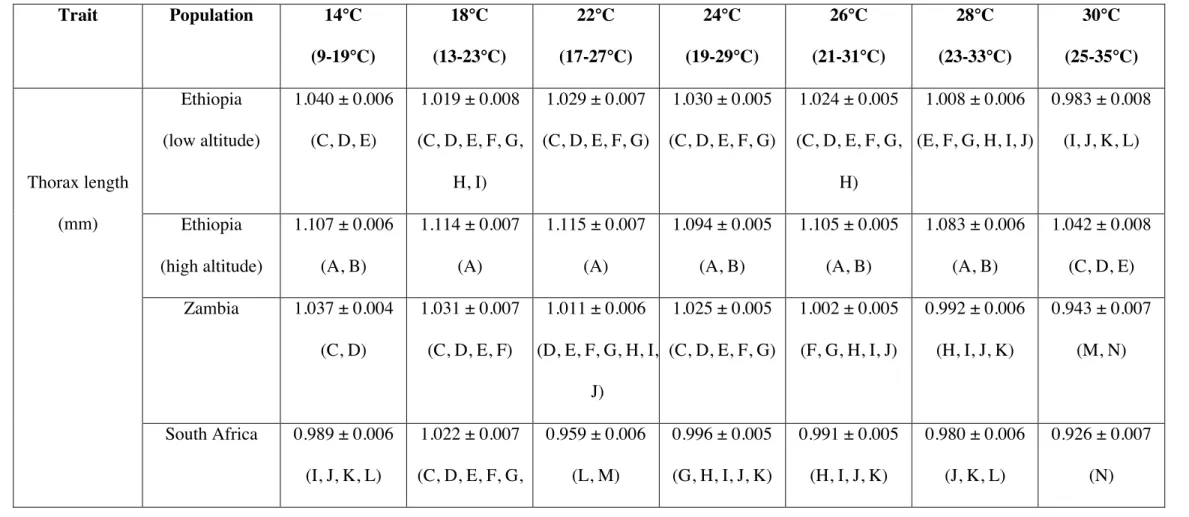
Table S9. Means and standard errors of the mean for morphological traits, measured at different (mean) temperatures. For ANOVA results see
Table S8; values not connected by the same letter are significantly different (Tukey’s HSD test; P < 0.05).
Trait Population 14°C (9-19°C) 18°C (13-23°C) 22°C (17-27°C) 24°C (19-29°C) 26°C (21-31°C) 28°C (23-33°C) 30°C (25-35°C) Thorax length (mm) Ethiopia (low altitude) 1.040 ± 0.006 (C, D, E) 1.019 ± 0.008 (C, D, E, F, G, H, I) 1.029 ± 0.007 (C, D, E, F, G) 1.030 ± 0.005 (C, D, E, F, G) 1.024 ± 0.005 (C, D, E, F, G, H) 1.008 ± 0.006 (E, F, G, H, I, J) 0.983 ± 0.008 (I, J, K, L) Ethiopia (high altitude) 1.107 ± 0.006 (A, B) 1.114 ± 0.007 (A) 1.115 ± 0.007 (A) 1.094 ± 0.005 (A, B) 1.105 ± 0.005 (A, B) 1.083 ± 0.006 (A, B) 1.042 ± 0.008 (C, D, E) Zambia 1.037 ± 0.004 (C, D) 1.031 ± 0.007 (C, D, E, F) 1.011 ± 0.006 (D, E, F, G, H, I, J) 1.025 ± 0.005 (C, D, E, F, G) 1.002 ± 0.005 (F, G, H, I, J) 0.992 ± 0.006 (H, I, J, K) 0.943 ± 0.007 (M, N) South Africa 0.989 ± 0.006 (I, J, K, L) 1.022 ± 0.007 (C, D, E, F, G, 0.959 ± 0.006 (L, M) 0.996 ± 0.005 (G, H, I, J, K) 0.991 ± 0.005 (H, I, J, K) 0.980 ± 0.006 (J, K, L) 0.926 ± 0.007 (N)
H) Austria 1.078 ± 0.006 (B) 1.041 ± 0.007 (C, D) 1.046 ± 0.006 (C) 1.036 ± 0.005 (C, D, E) 1.034 ± 0.005 (C, D, E, F) 1.017 ± 0.006 (C, D, E, F, G, H, I) 0.966 ± 0.007 (K, L, M) Wing area (mm2 ) Ethiopia (low altitude) 2.156 ± 0.022 (E) 2.026 ± 0.026 (F, G, H) 1.889 ± 0.021 (I, J, K, L) 1.794 ± 0.019 (K, L, M) 1.750 ± 0.024 (M, N) 1.639 ± 0.018 (N, O) 1.554 ± 0.024 (O, P, Q, R) Ethiopia (high altitude) 2.651 ± 0.022 (A) 2.504 ± 0.023 (B) 2.350 ± 0.022 (C) 2.203 ± 0.019 (D, E) 2.148 ± 0.024 (E, F) 2.037 ± 0.017 (G) 1.839 ± 0.023 (J, K, L, M) Zambia 1.853 ± 0.027 (J, K, L, M) 1.901 ± 0.021 (I, J, K) 1.625 ± 0.019 (O, P) 1.643 ± 0.018 (N, O) 1.531 ± 0.022 (P, Q, R) 1.485 ± 0.017 (Q, R) 1.263 ± 0.019 (S) South Africa 1.986 ± 0.022 (G, H, I) 1.915 ± 0.021 (H, I, J) 1.584 ± 0.02 (O, P, Q) 1.641 ± 0.018 (N, O) 1.542 ± 0.022 (O, P, Q, R) 1.453 ± 0.017 (R) 1.277 ± 0.019 (S) Austria 2.301 ± 0.022 (C, D) 2.166 ± 0.021 (E) 1.881 ± 0.019 (I, J, K, L) 1.835 ± 0.019 (J, K, L, M) 1.784 ± 0.022 (L, M) 1.642 ± 0.017 (N, O) 1.483 ± 0.019 (Q, R) Ethiopia 28.2 ± 0.9 34.8 ± 1.1 35.2 ± 0.8 36.6 ± 0.8 33.9 ± 0.8 34.7 ± 0.6 30.5 ± 1.3
Ovariole number
(low altitude) (O) (F, G, H, I, J,
K, L, M, N) (F, G, H, I, J, K, L, M, N) (D, E, F, G, H, I, J, K, L) (H, I, J, K, L, M, N) (G, H, I, J, K, L, M, N) (M, N, O) Ethiopia (high altitude) 32.5 ± 0.9 (L, M, N, O) 36.1 ± 0.9 (E, F, G, H, I, J, K, L) 39.3 ± 0.8 (A, B, C, D, E, F) 40.0 ± 0.8 (A, B, C, D, E) 39.6 ± 0.8 (A, B, C, D, E, F) 38.6 ± 0.6 (B, C, D, E, F, G, H) 35.8 ± 1.2 (E, F, G, H, I, J, K, L, M) Zambia 31.0 ± 0.8 (N, O) 33.6 ± 0.9 (I, J, K, L, M, N) 36.7 ± 0.8 (D, E, F, G, H, I, J, K, L) 38.4 ± 0.8 (B, C, D, E, F, G, H) 37.9 ± 0.8 (C, D, E, F, G, H, I) 38.8 ± 0.6 (B, C, D, E, F, G) 34.1 ± 1.0 (H, I, J, K, L, M, N) South Africa 32.8 ± 0.9 (K, L, M, N) 37.0 ± 0.9 (C, D, E, F, G, H, I, J, K) 35.8 ± 0.8 (E, F, G, H, I, J, K, L) 36.4 ± 0.8 (D, E, F, G, H, I, J, K, L) 38.4 ± 0.8 (B, C, D, E, F, G, H) 37.4 ± 0.6 (C, D, E, F, G, H, I, J) 33.1 ± 1.0 (J, K L, M, N) Austria 37.4 ± 1.1 (C, D, E, F, G, H, I, J, K, L) 38.8 ± 0.9 (B, C, D, E, F, G) 42.8 ± 0.8 (A, B) 41.2 ± 0.8 (A, B, C) 43.9 ±0.7 (A) 40.8 ± 0.6 (A, B, C, D) 38.7 ± 1.0 (B, C, D, E, F, G) Ethiopia 0.523 ± 0.007 0.523 ± 0.011 0.578 ± 0.008 0.611 ± 0.008 0.616 ± 0.013 0.626 ± 0.009 0.617 ± 0.012
Wing loading (low altitude) (K, L, M) (J, K, L, M) (F, G, H, I, J) (B, C, D, E, F, G, H) (A, B, C, D, E, F) (A, B, C, D, E, F) (A, B, C, D, E, F, G) Ethiopia (high altitude) 0.513 ± 0.007 (L, M) 0.558 ± 0.008 (H, I, J, K, L) 0.590 ± 0.009 (E, F, G, H, I) 0.598 ± 0.008 (D, E, F, G, H) 0.640 ± 0.013 (A, B, C, D, E) 0.625 ± 0.008 (A, B, C, D, E, F) 0.618 ± 0.012 (A, B, C, D, E, F) Zambia 0.600 ± 0.009 (C, D, E, F, G, H) 0.578 ± 0.008 (F, G, H, I) 0.637 ± 0.008 (A, B, C, D, E) 0.660 ± 0.008 (A, B) 0.660 ± 0.012 (A, B) 0.659 ± 0.008 (A, B) 0.665 ± 0.01 (A) South Africa 0.485 ± 0.007 (M) 0.559 ± 0.008 (H, I, J, K, L) 0.563 ± 0.008 (G, H, I, J, K) 0.599 ± 0.008 (D, E, F, G, H) 0.634 ± 0.012 (A, B, C, D, E) 0.650 ± 0.008 (A, B, C) 0.625 ± 0.01 (A, B, C, D, E, F) Austria 0.545 ± 0.007 (I, J, K, L) 0.524 ± 0.009 (K, L, M) 0.610 ± 0.008 (C, D, E, F, G) 0.607 ± 0.008 (C, D, E, F, G, H) 0.620 ± 0.012 (A, B, C, D, E, F) 0.643 ± 0.008 (A, B, C, D) 0.612 ± 0.01 (B, C, D, E, F) Ethiopia 25.3 ± 0.9 33.9 ± 1.1 32.3 ± 0.9 33.5 ± 0.8 31.4 ± 1.0 34.0 ± 0.8 34.2 ± 1.7
Ovariole index
(low altitude) (N, O) (F, G, H, I, J) (G, H, I, J, K) (F, G, H, I, J) (H, I, J, K, L) (F, G, H, I) (E, F, G, H, I, J) Ethiopia (high altitude) 24.0 ± 0.9 (O) 26.1 ± 1.0 (M, N, O) 28.5 ± 0.9 (K, L, M, N, O) 30.5 ± 0.8 (I, J, K, L, M, N) 29.4 ± 1.0 (J, K, L, M, N) 30.6 ± 0.8 (I, J, K, L, M, N) 31.9 ± 1.5 (G, H, I, J, K, L) Zambia 27.7 ± 0.9 (L, M, N, O) 30.7 ± 0.9 (I, J, K, L, M) 35.6 ± 0.8 (D, E, F, G, H) 35.8 ± 0.7 (D, E, F, G, H) 36.1 ± 0.9 (B, C, D, E, F) 39.9 ± 0.8 (A, B, C, D) 40.9 ± 1.3 (A, B, C) South Africa 33.5 ± 0.9 (F, G, H, I) 34.7 ± 0.9 (E, F, G, H, I) 40.8 ± 0.8 (A, B, C) 36.8 ± 0.7 (C, D, E, F, G) 39.8 ± 0.9 (A, B, C, D) 39.9 ± 0.8 (A, B, C, D) 40.3 ± 1.3 (A, B) Austria 28.8 ± 1.1 (I, J, K, L, M) 34.3 ± 0.9 (F, G, H, I) 37.4 ± 0.8 (B, C, D, E, F) 37.0 ± 0.7 (C, D, E, F) 39.8 ± 0.9 (A, B, C, D) 38.8 ± 0.8 (A, B, C, D, E) 43.0 ± 1.3 (A)
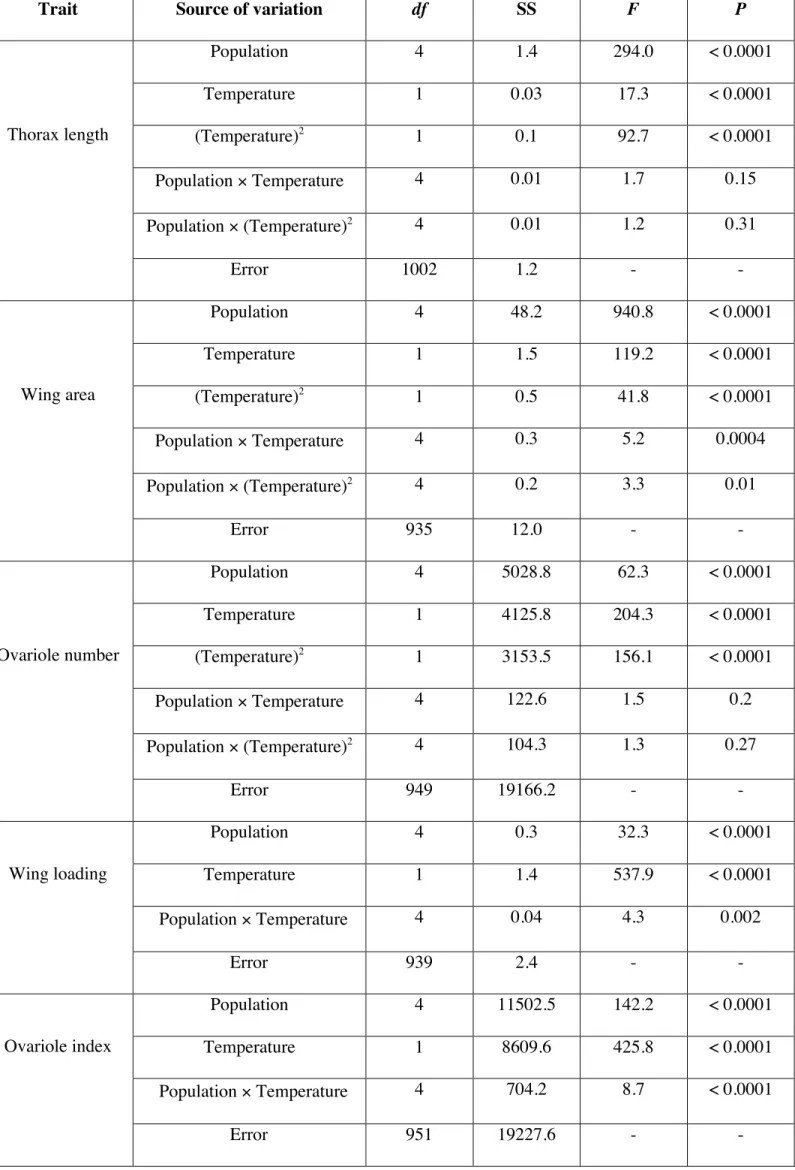
Table S10. Multiple nonlinear (for thorax length, wing area, ovariole number) and linear (for wing loading, ovariole
index) regression. See Materials and Methods for further details.
Trait Source of variation df SS F P
Thorax length Population 4 1.4 294.0 < 0.0001 Temperature 1 0.03 17.3 < 0.0001 (Temperature)2 1 0.1 92.7 < 0.0001 Population × Temperature 4 0.01 1.7 0.15 Population × (Temperature)2 4 0.01 1.2 0.31 Error 1002 1.2 - - Wing area Population 4 48.2 940.8 < 0.0001 Temperature 1 1.5 119.2 < 0.0001 (Temperature)2 1 0.5 41.8 < 0.0001 Population × Temperature 4 0.3 5.2 0.0004 Population × (Temperature)2 4 0.2 3.3 0.01 Error 935 12.0 - - Ovariole number Population 4 5028.8 62.3 < 0.0001 Temperature 1 4125.8 204.3 < 0.0001 (Temperature)2 1 3153.5 156.1 < 0.0001 Population × Temperature 4 122.6 1.5 0.2 Population × (Temperature)2 4 104.3 1.3 0.27 Error 949 19166.2 - - Wing loading Population 4 0.3 32.3 < 0.0001 Temperature 1 1.4 537.9 < 0.0001 Population × Temperature 4 0.04 4.3 0.002 Error 939 2.4 - - Ovariole index Population 4 11502.5 142.2 < 0.0001 Temperature 1 8609.6 425.8 < 0.0001 Population × Temperature 4 704.2 8.7 < 0.0001 Error 951 19227.6 - -
Table S11. Estimated parameters from multiple nonlinear regression for thorax length; also
see Table S10.
Term Estimate P
Intercept 1.046 ± 0.003 <0.0001
Population[Ethiopia – low altitude] -0.007 ± 0.002 0.003
Population[Ethiopia – high altitude] 0.068 ± 0.002 <0.0001
Population[Zambia] -0.02 ± 0.002 <0.0001 Population[South Africa] -0.046 ± 0.002 <0.0001 Population[Austria] 0.005 ± 0.002 0.02 Temperature 0.0029 ± 0.0007 <0.0001 (Temperature)2 -0.0004 ± 0.00004 <0.0001 Population[Ethiopia – low altitude] × (Temperature-8.84366) -0.0011 ± 0.0015 0.47 Population[Ethiopia – high altitude] × (Temperature-8.84366) 0.0025 ± 0.0015 0.09
Population[Zambia] × (Temperature-8.84366) -0.0003 ± 0.0013 0.85
Population[South Africa] × (Temperature-8.84366) 0.0016 ± 0.0014 0.25
Population[Austria] × (Temperature-8.84366) -0.0028 ± 0.0014 0.05
Population[Ethiopia – low altitude] × ((Temperature)2
-106.93) 0.0001 ± 9.3e-5 0.11 Population[Ethiopia – high altitude] × ((Temperature)2
-106.93) -0.0001 ± 9.3e-5 0.2 Population[Zambia] × ((Temperature)2
-106.93) -5.5e-5 ± 8.2e-5 0.51
Population[South Africa] × ((Temperature)2
-106.93) -6.0e-5 ± 8.6e-5 0.49
Population[Austria] × ((Temperature)2
Table S12. Estimated parameters from multiple nonlinear regression for wing area; also see
Table S10.
Term Estimate P
Intercept 2.198 ± 0.009 <0.0001
Population[Ethiopia – low altitude] -0.009 ± 0.008 0.23
Population[Ethiopia – high altitude] 0.411 ± 0.008 <0.0001
Population[Zambia] -0.223 ± 0.007 <0.0001 Population[South Africa] -0.21 ± 0.007 <0.0001 Population[Austria] 0.031 ± 0.007 <0.0001 Temperature -0.027 ± 0.003 <0.0001 (Temperature)2 -0.001 ± 0.0002 <0.0001 Population[Ethiopia – low altitude] × (Temperature-9.15579) -0.003 ± 0.005 0.63 Population[Ethiopia – high altitude] × (Temperature-9.15579) -0.0004 ± 0.005 0.94
Population[Zambia] × (Temperature-9.15579) 0.022 ± 0.005 <0.0001
Population[South Africa] × (Temperature-9.15579) -0.005 ± 0.005 0.29
Population[Austria] × (Temperature-9.15579) -0.014 ± 0.005 0.006
Population[Ethiopia – low altitude] × ((Temperature)2
-110.893) 0.0005 ± 0.0003 0.11
Population[Ethiopia – high altitude] × ((Temperature)2
-110.893) -0.0003 ± 0.0003 0.34
Population[Zambia] × ((Temperature)2-110.893) -0.001 ± 0.0003 0.002
Population[South Africa] × ((Temperature)2
-110.893) 0.0003 ± 0.0003 0.26
Population[Austria] × ((Temperature)2
Table S13. Estimated parameters from multiple nonlinear regression for ovariole number;
also see Table S10.
Term Estimate P
Intercept 32.0 ± 0.4 <0.0001
Population[Ethiopia – low altitude] -3.17 ± 0.3 <0.0001
Population[Ethiopia – high altitude] 0.86 ± 0.3 0.004
Population[Zambia] -0.8 ± 0.28 0.005 Population[South Africa] -0.77 ± 0.29 0.007 Population[Austria] 3.88 ± 0.29 <0.0001 Temperature 1.4 ± 0.1 <0.0001 (Temperature)2 -0.07 ± 0.01 <0.0001 Population[Ethiopia – low altitude] × (Temperature-9.12241) 0.33 ± 0.2 0.09 Population[Ethiopia – high altitude] × (Temperature-9.12241) 0.16 ± 0.2 0.44
Population[Zambia] × (Temperature-9.12241) 0.01 ± 0.2 0.97
Population[South Africa] × (Temperature-9.12241) -0.4 ± 0.2 0.05
Population[Austria] × (Temperature-9.12241) -0.12 ± 0.21 0.55
Population[Ethiopia – low altitude] × ((Temperature)2
-110.469) -0.02 ± 0.01 0.06
Population[Ethiopia – high altitude] × ((Temperature)2
-110.469) -0.01 ± 0.01 0.65
Population[Zambia] × ((Temperature)2
-110.469) 0.01 ± 0.01 0.53
Population[South Africa] × ((Temperature)2
-110.469) 0.02 ± 0.01 0.16
Population[Austria] × ((Temperature)2
Table S14. Estimated parameters from multiple linear regression for wing loading; also see
Table S10.
Term Estimate P
Intercept 0.532 ± 0.003 <0.0001
Population[Ethiopia – low altitude] -0.013 ± 0.003 0.0002
Population[Ethiopia – high altitude] -0.007 ± 0.003 0.03
Population[Zambia] 0.037 ± 0.003 <0.0001
Population[South Africa] -0.011 ± 0.003 0.0004
Population[Austria] -0.005 ± 0.003 0.12
Temperature 0.007 ± 0.0003 <0.0001
Population[Ethiopia – low altitude] × (Temperature-9.16122) 0.0002 ± 0.0007 0.78 Population[Ethiopia – high altitude] × (Temperature-9.16122) 0.0002 ± 0.0006 0.74
Population[Zambia] × (Temperature-9.16122) -0.0017 ± 0.0007 0.008
Population[South Africa] × (Temperature-9.16122) 0.0022 ± 0.0006 0.0005
Table S15. Estimated parameters from multiple linear regression for ovariole index; also
see Table S10.
Term Estimate P
Intercept 29.03 ± 0.3 < 0.0001
Population[Ethiopia – low altitude] -2.28 ± 0.3 < 0.0001
Population[Ethiopia – high altitude] -5.64 ± 0.3 < 0.0001
Population[Zambia] 1.11 ± 0.28 < 0.0001
Population[South Africa] 3.85 ± 0.29 < 0.0001
Population[Austria] 2.95 ± 0.29 < 0.0001
Temperature 0.58 ± 0.03 < 0.0001
Population[Ethiopia – low altitude] × (Temperature-9.16122) -0.18 ± 0.06 0.003 Population[Ethiopia – high altitude] × (Temperature-9.16122) -0.1 ± 0.06 0.07
Population[Zambia] × (Temperature-9.16122) 0.26 ± 0.05 < 0.0001
Population[South Africa] × (Temperature-9.16122) -0.09 ± 0.05 0.11
Table S16. Parameter estimates for reaction norms of morphological traits, with standard errors of the mean. Values in bold are significantly
different from the overall mean (α = 0.05) (analysis of means, ANOM; see Materials and Methods for further details).
Trait Population Intercept Slope Quadratic
coefficient Optimal temperature (°C) Maximum value Thorax length
Ethiopia (low altitude) 1.033 ± 0.006 0.0019 ± 0.0017 -0.0003 ± 0.0001 17.43 ± 1.83 1.037 ± 0.004
Ethiopia (high altitude) 1.105 ± 0.006 0.0055 ± 0.0017 -0.0005 ± 0.0001 19.08 ± 0.68 1.119 ± 0.004
Zambia 1.034 ± 0.004 0.0027 ± 0.0014 -0.0005 ± 8.9 e-5 16.87 ± 0.93 1.038 ± 0.003
South Africa 0.992 ± 0.006 0.0046 ± 0.0016 -0.0005 ± 9.6 e-5 18.73 ± 0.79 1.003 ± 0.003
Austria 1.067 ± 0.006 0.0001 ± 0.0016 -0.0003 ± 9.6 e-5 14.25 ± 2.26 1.067 ± 0.006
Wing area
Ethiopia (low altitude) 2.155 ± 0.02 -0.030 ± 0.006 -0.0005 ± 0.0004 - 0.44 ± 9.43 2.367 ± 0.208
Ethiopia (high altitude) 2.645 ± 0.02 -0.028 ± 0.006 -0.0013 ± 0.0004 7.95 ± 2.82 2.719 ± 0.07
Zambia 1.884 ± 0.023 -0.006 ± 0.006 -0.0019 ± 0.0003 13.98 ± 1.21 1.879 ± 0.023
South Africa 1.999 ± 0.02 -0.033 ± 0.005 -0.0007 ± 0.0003 3.47 ± 5.1 2.16 ± 0.132
Ovariole number
Ethiopia (low altitude) 28.43 ± 0.78 1.74 ± 0.22 -0.098 ± 0.014 22.92 ± 0.39 36.14 ± 0.53
Ethiopia (high altitude) 32.08 ± 0.79 1.56 ± 0.22 -0.080 ± 0.014 23.81 ± 0.52 39.74 ± 0.49
Zambia 30.37 ± 0.71 1.41 ± 0.2 -0.067 ± 0.012 24.54 ± 0.61 37.84 ± 0.44
South Africa 32.86 ± 0.78 1.03 ± 0.21 -0.058 ± 0.013 22.91 ± 0.58 37.41 ± 0.48
Austria 36.31 ± 0.93 1.28 ± 0.24 -0.068 ± 0.013 23.49 ± 0.53 42.38 ± 0.47
Wing loading
Ethiopia (low altitude) 0.518 ± 0.008 0.0076 ± 0.0007 Ethiopia (high altitude) 0.523 ± 0.008 0.0076 ± 0.0007
Zambia 0.585 ± 0.008 0.0056 ± 0.0007
South Africa 0.501 ± 0.007 0.0095 ± 0.0007
Austria 0.535 ± 0.007 0.0065 ± 0.0007
Ovariole index
Ethiopia (low altitude) 28.36 ± 0.66 0.40 ± 0.07
Ethiopia (high altitude) 24.32 ± 0.66 0.48 ± 0.06
Zambia 27.75 ± 0.60 0.84 ± 0.06
South Africa 33.68 ± 0.64 0.49 ± 0.06
Table S17. Analysis of Means (ANOM) of estimated reaction norm parameters for thorax
length (α = 0.05). See Materials and Methods for further details.
Parameter Population Lower limit Estimate Upper limit Limit exceeded
Intercept
Ethiopia (low altitude) 1.03 1.03 1.06
Ethiopia (high altitude) 1.03 1.1 1.06 upper
Zambia 1.03 1.03 1.06
South Africa 1.03 0.99 1.06 lower
Austria 1.03 1.07 1.06 upper
Slope
Ethiopia (low altitude) -0.001 0.002 0.007
Ethiopia (high altitude) -0.001 0.006 0.007
Zambia -0.001 0.003 0.007
South Africa -0.001 0.005 0.007
Austria -0.001 0.0001 0.007
Quadratic coefficient
Ethiopia (low altitude) -0.001 -0.0003 -0.0002
Ethiopia (high altitude) -0.001 -0.0005 -0.0002
Zambia -0.001 -0.0005 -0.0002
South Africa -0.001 -0.0005 -0.0002
Austria -0.001 -0.0003 -0.0002
Optimal temperature
Ethiopia (low altitude) 13.56 17.43 22.91
Ethiopia (high altitude) 16.5 19.08 19.98
Zambia 15.86 16.87 20.62
(°C) Austria 12.46 14.25 24.01
Maximum value
Ethiopia (low altitude) 1.04 1.04 1.06 lower
Ethiopia (high altitude) 1.04 1.12 1.06 upper
Zambia 1.04 1.04 1.06 lower
South Africa 1.04 1.00 1.06 lower
Table S18. Analysis of Means (ANOM) of estimated reaction norm parameters for wing
area (α = 0.05). See Materials and Methods for further details.
Parameter Population Lower limit Estimate Upper limit Limit exceeded
Intercept
Ethiopia (low altitude) 2.16 2.16 2.27 lower
Ethiopia (high altitude) 2.16 2.65 2.27 upper
Zambia 2.16 1.88 2.27 lower
South Africa 2.16 2.0 2.27 lower
Austria 2.17 2.31 2.27 upper
Slope
Ethiopia (low altitude) -0.04 -0.03 -0.01
Ethiopia (high altitude) -0.04 -0.03 -0.01
Zambia -0.04 -0.006 -0.01 upper
South Africa -0.04 -0.03 -0.01
Austria -0.04 -0.04 -0.01
Quadratic coefficient
Ethiopia (low altitude) -0.002 -0.0005 -0.00001
Ethiopia (high altitude) -0.002 -0.0013 -6.43e-5
Zambia -0.002 -0.002 -0.0001 lower
South Africa -0.002 -0.0007 -0.0001
Austria -0.002 -0.0006 -0.0001
Optimal temperature
Ethiopia (low altitude) -12.06 -0.44 36.15
Ethiopia (high altitude) 4.83 7.95 19.27
Zambia 8.95 13.98 15.14
(°C) Austria -3.05 0.55 27.14
Maximum value
Ethiopia (low altitude) 1.45 2.37 2.51
Ethiopia (high altitude) 1.80 2.72 2.16 upper
Zambia 1.92 1.88 2.04 lower
South Africa 1.64 2.16 2.32
Table S19. Analysis of Means (ANOM) of estimated reaction norm parameters for
ovariole number (α = 0.05). See Materials and Methods for further details.
Parameter Population Lower limit Estimate Upper limit Limit exceeded
Intercept
Ethiopia (low altitude) 29.68 28.43 33.68 lower
Ethiopia (high altitude) 29.67 32.08 33.69
Zambia 29.87 30.37 33.48
South Africa 29.69 32.86 33.67
Austria 29.3 36.31 34.06 upper
Slope
Ethiopia (low altitude) 0.83 1.74 1.97
Ethiopia (high altitude) 0.83 1.56 1.97
Zambia 0.88 1.41 1.91
South Africa 0.85 1.03 1.94
Austria 0.8 1.28 2.0
Quadratic coefficient
Ethiopia (low altitude) -0.11 -0.1 -0.04
Ethiopia (high altitude) -0.11 -0.08 -0.04
Zambia -0.11 -0.07 -0.04
South Africa -0.11 -0.06 -0.04
Austria -0.11 -0.07 -0.04
Optimal temperature
Ethiopia (low altitude) 22.42 22.92 24.41
Ethiopia (high altitude) 22.09 23.81 24.73
Zambia 21.85 24.54 24.97
(°C) Austria 22.07 23.49 24.75
Maximum value
Ethiopia (low altitude) 37.44 36.14 40.13 lower
Ethiopia (high altitude) 37.52 39.74 40.05
Zambia 37.66 37.84 39.91
South Africa 37.55 37.41 40.02 lower
Table S20. Analysis of Means (ANOM) of estimated reaction norm parameters for wing
loading (α = 0.05). See Materials and Methods for further details.
Parameter Population Lower limit Estimate Upper limit Limit exceeded
Intercept
Ethiopia (low altitude) 0.51 0.52 0.55
Ethiopia (high altitude) 0.51 0.52 0.55
Zambia 0.51 0.59 0.55 upper
South Africa 0.51 0.5 0.55 lower
Austria 0.51 0.54 0.55
Slope
Ethiopia (low altitude) 0.006 0.008 0.009
Ethiopia (high altitude) 0.006 0.008 0.009
Zambia 0.006 0.006 0.009
South Africa 0.006 0.01 0.009 upper
Table S21. Analysis of Means (ANOM) of estimated reaction norm parameters for ovariole
index (α = 0.05). See Materials and Methods for further details.
Parameter Population Lower limit Estimate Upper limit Limit exceeded
Intercept
Ethiopia (low altitude) 27.25 28.36 30.72
Ethiopia (high altitude) 27.3 24.32 30.67 lower
Zambia 27.45 27.75 30.52
South Africa 27.35 33.68 30.62 upper
Austria 27.16 31.03 30.81 upper
Slope
Ethiopia (low altitude) 0.42 0.4 0.76 lower
Ethiopia (high altitude) 0.43 0.48 0.75
Zambia 0.44 0.84 0.74 upper
South Africa 0.43 0.49 0.74