HAL Id: hal-03090824
https://hal.inria.fr/hal-03090824
Submitted on 30 Dec 2020
HAL is a multi-disciplinary open access
archive for the deposit and dissemination of
sci-entific research documents, whether they are
pub-lished or not. The documents may come from
teaching and research institutions in France or
abroad, or from public or private research centers.
L’archive ouverte pluridisciplinaire HAL, est
destinée au dépôt et à la diffusion de documents
scientifiques de niveau recherche, publiés ou non,
émanant des établissements d’enseignement et de
recherche français ou étrangers, des laboratoires
publics ou privés.
MRI Vocal Tract Sagittal Slices Estimation during
Speech Production of CV
Ioannis Douros, Ajinkya Kulkarni, Yu Xie, Chrysanthi Dourou, Jacques
Felblinger, Karyna Isaieva, Pierre-André Vuissoz, Yves Laprie
To cite this version:
Ioannis Douros, Ajinkya Kulkarni, Yu Xie, Chrysanthi Dourou, Jacques Felblinger, et al.. MRI Vocal
Tract Sagittal Slices Estimation during Speech Production of CV. EUSIPCO 2020 - 28th European
Signal Processing Conference, Jan 2021, Amsterdam / Virtual, Netherlands. �hal-03090824�
MRI Vocal Tract Sagittal Slices Estimation during
Speech Production of CV
Ioannis K. Douros
Universit´e de Lorraine, CNRS, INRIA, LORIA F-54000 Nancy, France
Ajinkya Kulkarni
Universit´e de Lorraine, CNRS, INRIA, LORIA F-54000 Nancy, France
Yu Xie
Department of Neurology Zhongnan Hospital of Wuhan University
Wuhan 430071, China [email protected]
Chrysanthi Dourou
School of Electrical and Computer Engineering National Technical University of Athens
Athens 15773, Greece [email protected]
Jacques Felblinger
Universit´e de Lorraine, INSERM 1433, CIC-IT, CHRU de Nancy F-54000 Nancy, France
Karyna Isaieva
Universit´e de Lorraine, INSERM U1254, IADI F-54000 Nancy, France
Pierre-Andr´e Vuissoz
Universit´e de Lorraine, INSERM U1254, IADI F-54000 Nancy, France
Yves Laprie
Universit´e de Lorraine, CNRS, INRIA, LORIA F-54000 Nancy, France
Abstract—In this paper we propose an algorithm for estimating vocal tract para sagittal slices in order to have a better overview of the behaviour of the articulators during speech production. The first step is to align the consonant-vowel (CV) data of the sagittal plains between them for the train speaker. Sets of transformations that connect the midsagittal frames with the neighbouring ones is acquired for the train speaker. Another set of transformations is calculated which transforms the midsagittal frames of the train speaker to the corresponding midsagittal frames of the test speaker and is used to adapt to the test speaker domain the previously computed sets of transformations. The newly adapted transformations are applied to the midsagittal frames of the test speaker in order to estimate the neighbouring sagittal frames. Several mono speaker models are combined to produce the final frame estimation. To evaluate the results, image cross-correlation between the original and the estimated frames was used. Results show good agreement between the original and the estimated frames.
Index Terms—image transformation, rtMRI data, speech re-sources enrichment, vocal tract
I. INTRODUCTION
Recent advancement in real-time magnetic resonance imag-ing (rt-MRI) techniques has shown promisimag-ing success en-compassing non-medical studies such as turbulent flow [1] to noninvasive monitoring of surgical operations. One of many applications of rt-MRI is a study of the articulatory speech pro-duction model by investigating vocal tract movements during speech production [2]. This certainly helps in the development
of the articulatory model to bridge between speech research encompassing phonetics, phonology, speech disorders, and language acquisition [3].
Magnetic resonance imaging (MRI) is a modality widely used for speech studies because it has several advantages over other approaches like X-ray, EMA or ultrasound since it is a non-invasive, non-ionizing method that can provide rich information about the vocal tract and its dynamics [4]. With the advances in real-time MRI, one can acquire 2D dynamic images with a good compromise between contrast spatial resolution and temporal resolution to study speech dynamics and analyze fast speech movements. Furthermore, rt-MRI captures the dynamics of vocal tract movement during speech production, providing an accurate estimate of the mechanism of articulators such as the tongue, velum, etc [5]. The growth in rt-MRI protocols has facilitated analysis of vocal tract shaping during speech production, allowing to quantifying the articulator’s movements in space and time, including structural/morphological characteristics of speakers in conjunction with their articulation dynamics and acoustics [6].
As stated earlier,rt-MRI one can acquire 2D dynamic images with a good compromise between contrast spatial resolution and temporal resolution to study speech dynamics and analyze fast speech movements. Even though there are sequences to acquire 3D rt-MRI images [7] more progress is still required
for the 3D rt-MRI sequences to reach the quality level of 2D ones. However, information about the articulators outside the midsagittal plane is still required in order to better understand speech production as it plays an important role in area function estimation [11] and is useful for improving speech synthesis [12].The volumetric information also plays a vital role in diagnosing speech-related disorders. The reduced volume of the tongue is a clear indication of altercations in articulatory patterns in comparison to healthy subjects [8]. Glossectomy generally affects the dynamics of speech production indicated by a study of advanced tongue cancer patients to undergo glossectomy observation. The study of Vowel frequency anal-ysis (F1 and F2) and qualitative assessment by observers indicated that speech production was significantly altered post-glossectomy [9].
One way is to use the rtMRI of the midsagittal plane and 3D volumetric information of static positions in order to estimate the 3D dynamics [10]. Such an approach provides interesting results, but this is quite hard to have a qualitative validation method that gives an idea of how good the estimation is. In this work, we addressed this problem by acquiring 2D rt-MRI data on the midsagittal and its neighboring planes in order to directly synthesize non-midsagittal frames for every time point and additionally develop a qualitative validation of the results using image cross-correlation between the original and the synthesized images.
II. MATERIALS ANDMETHODS
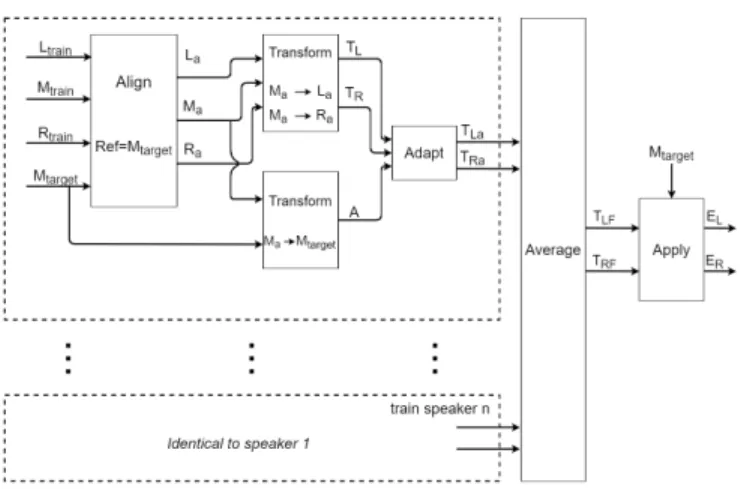
The main idea of the algorithm is divided in four steps: 1) Find an image transformation between the frames on midsagittal and the rest sagittal planes of the train speaker. 2) Find an image transformation between the midsagittal frames of the train and the test speaker. 3) Use the transformation from step two to properly adapt the transformation of step one. 4) Combine the resulting transformations of all train speakers to acquire the final estimations. An overview of the algorithm can be seen in Fig. 1
Fig. 1. Visual representation of the proposed algorithm
A. Data Acquisition
For this work, eight (four male, four female) native speakers of French were used. The age of subjects was between 21 and 36 years old with average age of 27.25 Subjects had no previous speaking or hearing problems recorded. The data was acquired on Siemens Prisma 3T scanner (Siemens, Erlan-gen, Germany) located in Nancy Central Regional University Hospital under the approved medical protocol “METHODO” (ClinicalTrials.gov Identifier: NCT02887053). For acquiring dynamic data, we used a 2D rtMRI sequence. In our approach, we used radial RF-spoiled FLASH sequence [13] with TR = 2.22 ms, TE = 1.47 ms, FOV = 19.2×19.2 cm2, flip angle
= 5 degrees, and slice thickness is 8 mm. Pixel bandwidth is 1670 Hz/pixel. The number of radial spokes is 9, and the resulting image resolution is 136 × 136. The acquisition time was 44 sec. Images were recorded at a frame rate of 50 frames per second with the algorithm presented in [13], using a 64 channel head-neck antenna.
B. Image transformation
One common choice for image transformations is the use of non-rigid ones. Even though they are more complex and computationally expensive compared to the rigid transforma-tions, they have some significant advantages over them. One of them is that they can adapt one image to another not only at global scale but also at local. This property makes them more flexible since it gives the ability to use them for trans-formations between the same images of different subjects with good results. In this work, we used a diffeomorphic demons algorithm [14], [15] in order to calculate the transformation between images. The algorithm calculates a displacement field which shows how much and in which direction each pixel of the moving images should move in order to match the target one. As the similarity measurement between the two images it uses mean square error of the pixels’ intensity therefore histogram matching is required at the beginning of the process. C. Frame alignment
Working at a frame level with dynamic sequences with different length will probably require frame alignment between them so that one can make comparisons between the same frame of different sequences. Interesting ideas for this issue are the use of similarities measurements between the frames of different sequence to find which frame of the modified sequence matches better each frame of the reference sequence, or use various types of interpolation to create additional frames at the required time points. Such methods however are quite complex and may not give appropriate results for vocal tract images. In this work, we chose to use another approach. This problem was divided in two parts. First, piece wise linear alignment was used in order to make sequences have the same length by forcing the boundaries of the modified sequence to be the same as the reference and then linearly extending or compressing the internal samples. Second, the frames of the modified sequence that are temporally closer to
the each reference frame are selected to constitute the final frame aligned sequence.
III. EXPERIMENTS
A. Speech Task
In this work we studied 12 CV syllables (/fi/, /fa/, /fu/, /pi/, /pa/, /pu/, /si/, /sa/, /su/, /ti/, /ta/, /tu/). rtMRI images of the vocal tract on parallel sagittal planes were acquired during the phonation of the CVs from eight subjects. The chosen planes were the midsagittal (M) its left (L) and right (R) adjacent planes. Data in each plane were acquired in different acquisi-tion on the same session. In order to remove coarticulaacquisi-tion effects from previous CVs, subjects were instructed before each CV to breath from the nose with mouth and lips closed so that the vocal tract is returned back to the ”neutral” silence position. To constrain the vowel at the end of the CV, subjects were also instructed to pronounce /p/ at the end of each CV. Therefore in practice, subjects were pronouncing /sil//C//V//p/. Even though images could had been automatically labelled, we chose to manually label them to achieve better temporal accuracy.
Fig. 2. Articulation of /i/ of four speakers during /ti/. One can notice differences in speakers’ anatomy, heads’ position and articulation
B. Data preprocessing
The first step was to manually make phonetic labels for all the frames of the dynamic sequences. Silence data were discarded and every CV was grouped independently, with every group containing the CV data from every plane. To synthesise a dynamic 3D acquisition composed from multiple 2D dynamic ones, frame alignment was applied to the CV groups. Midsagittal plane was chosen as a reference. In practice, linear piecewise alignment was used to time align L and R planes with the reference. C and V parts of L and R CV are independently and linearly extended or compressed until the duration of both C and V of them matches with those from the reference CV. The resulting sequences are time aligned with M (C and V in all planes have the same duration) but not frame aligned (each sample does not correspond to the same time point). Frames in L and R planes that are temporally closer to the M frames are selected to create the final aligned sequences on L and R planes. A visual explanation can be seen in Fig. 3. From now on, only the newly aligned sequences (along with the midsagittal one) will be used.
C. 3D extension
For the 3D extension, multiple mono speaker models were created and then they were properly combined to give the final frames estimation. To create the mono speaker model
(a) Time alignment
(b) Frame alignment
Fig. 3. The two-step procedure of frame alignment. Linear piece wise alignment is applied between the reference (Ref) and the modified sequence to adjust the length and then the closest frame to each of the reference frames are selected from the modified sequence (SP1 in the example of the figure)
of a target CV, frame alignment between M frames of target speaker and M, L, R frames of the train speaker was applied using target speaker’s frames as reference. The output was the frame aligned sequences of all planes of the train speaker (Ma, La, Ra).
For all the image transformations in this work (both at this and at the later steps) we used MATLAB imregdemons function with 3 pyramid levels with values 100, 50, 25 for the image resolution and accumulated field smoothing of 1.3 for the smoothing of the deformation field. We also applied histogram matching before the image transformation to have a similar contrast between the images. Two sets of image transformations TL, TR between Ma, La and Ma, Ra were
computed that transformed the Ma frames to the
correspond-ing La or Ra frames respectively. Additionally, another set of
image transformations A was calculated that transforms each frame of Ma to the corresponding midsagittal frame of the
test speaker. If I is the total number of images of M plane of the test speaker then i denotes the specific time frame (i = 1, 2, .., I). Therefore TL(i), TR(i), A(i) will refer to the
transformation of frame i.
Since TL(i), TR(i) were derived from the train speaker they
can not be directly used on the test speaker. A(i) was applied to TL(i), TR(i) in order to adapt them to the test speaker space.
the output of this step is TLa(i), TRa(i) transformations that
take as an input the i midsagittal image of the test speaker and give as an output the estimation of the i image of the test speaker on L or R plane respectively.
The same process is repeated and TLa(i), TRa(i) were
collected for all train speakers. All TLa(i), TRa(i) are averaged
to give the final transformations TF(i), TF(i). TLF(i), TRF(i)
are then applied to all i images of the test speaker on the M plane to get the final multi-speaker estimations of frames on L EL(i) and R ER(i) planes.
Fig. 4. Selected frames for /ti/ of speaker 8 of right plane. Top: original images Bottom: synthesised images
D. Evaluation
For the purpose of evaluation, we used 8-fold cross valida-tion using seven speakers for train and one for test on the 12 studied CVs. The non-midsagittal frames of CVs of the test speaker were compared with EL(i). ER(i). Since the
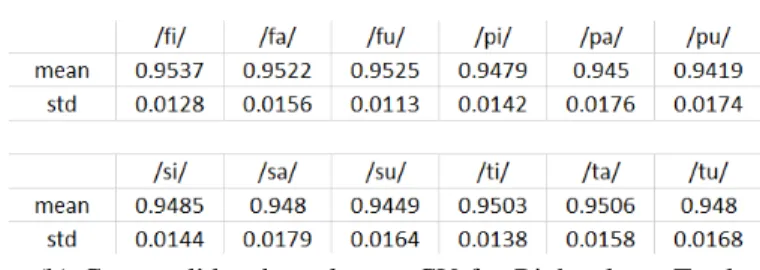
non-midsagittal frames of the test speakers were already aligned with the midsagittal ones at the preprocessing step, there is no need here for any alignment. Histogram matching was applied between the original and the synthesised frames. To validate the results, cross-correlation between the synthesized and the original images, normalized by the autocorrelation of the original images, was used. Results can be seen in Fig. 5
IV. CONCLUSIONS
Our numerical results (Fig. 5) show that synthesised images are quite similar to the original ones with an average similarity of 0.9552 across all CVs and all planes (maximum value could be 1 which would show identical images). This fact can also be noticed by visually inspecting the original and the synthesised images in Fig. 4 as the biggest part of the vocal tract is
(a) Cross validated results per CV for Left plane. Total average for all CVs is 0.9617 with std 0.0023
(b) Cross validated results per CV for Right plane. Total average for all CVs is 0.9486 with std 0.0035
Fig. 5. Cross validated results per CV for Left and Right plane. Total combined average for all CVs in both planes is 0.9552 with std 0.0073
almost identical between them. The main differences can be noticed at the palate and at the epiglottis/larynx where in the original images these regions are a little more blurry. This improvement in quality in the synthesised images is because they were based on images from the midsagittal plane where this region is more clear than on the Left or Right plane. We should note however that the fact that synthesised images look better in these regions, does not necessarily mean that they depict the true better. It should be at the judge of the user at which cases synthesised images represent the truth better. Additionally, the algorithm is quite robust since the standard deviation of the total average is 0.0073. This can also be inferred by examining the differences in anatomy, head position and articulation styles between subjects (Fig. 2) and checking how close the synthesised images with the original ones are.
This algorithm can be easily transformed to a fully auto-mated algorithm by using standard techniques to replace the manual labeling at the pre processing step. The presented algorithm can be used to enrich information of midsagittal vocal tract slices. However, more work needs to be done towards the direction of generalizing these results by exploring cases like VCV, CVC, whole words or phrases. Finally, one could think of estimating further sagittal planes of the vocal tract.
REFERENCES
[1] V Wedeen; A Crawley; R Weisskoff; G Holmvang MS Cohen (1990). ”Real time MR imaging of structured fluid flow”. Society for Magnetic Resonance in Medicine: 164.
[2] Ramanarayanan, V., Tilsen, S., Proctor, M., T¨oger, J., Goldstein, L., Nayak, K. S., Narayanan, S. (2018). Analysis of speech production real-time MRI. Computer Speech Language, 52, 1-22.
[3] Laprie, Y., Elie, B., Tsukanova, A., Vuissoz, P. A. (2018, September). Centerline articulatory models of the velum and epiglottis for articu-latory synthesis of speech. In 2018 26th European Signal Processing Conference (EUSIPCO) (pp. 2110-2114). IEEE.
[4] Toutios, A., Narayanan, S. S. (2016). Advances in real-time magnetic resonance imaging of the vocal tract for speech science and technology research. APSIPA Transactions on Signal and Information Processing, 5.
[5] Niebergall, A., Zhang, S., Kunay, E., Keydana, G., Job, M., Uecker, M., Frahm, J. (2013). Real-time MRI of speaking at a resolution of 33 ms: undersampled radial FLASH with nonlinear inverse reconstruction. Magnetic Resonance in Medicine, 69(2), 477-485.
[6] Narayanan, S., Nayak, K., Lee, S., Sethy, A., Byrd, D. (2004). An ap-proach to real-time magnetic resonance imaging for speech production. The Journal of the Acoustical Society of America, 115(4), 1771-1776. [7] Lim, Yongwan, et al. ”3D dynamic MRI of the vocal tract during natural
speech.” Magnetic resonance in medicine 81.3 (2019): 1511-1520. [8] Michi, K. I., Imai, S., Yamashita, Y., Suzuki, N. (1989). Improvement
of speech intelligibility by a secondary operation to mobilize the tongue after glossectomy. Journal of Cranio-Maxillofacial Surgery, 17(4), 162-166.
[9] Hagedorn, C., Lammert, A., Bassily, M., Zu, Y., Sinha, U., Goldstein, L., Narayanan, S. S. (2014, May). Characterizing post-glossectomy speech using real-time MRI. In International Seminar on Speech Production, Cologne, Germany.
[10] Ioannis K, Douros, Anastasiia Tsukanova, Karyna Isaieva, Pierre-Andr´e Vuissoz, Yves Laprie. Towards a method of dynamic vocal tract shapes generation by combining static 3D and dynamic 2D MRI speech data. INTERSPEECH 2019 - 20th Annual Conference of the International Speech CommunicationAssociation, Sep 2019, Graz, Austria. [11] Skordilis, Z. I., Toutios, A., T¨oger, J., Narayanan, S. (2017, March).
Estimation of vocal tract area function from volumetric Magnetic Res-onance Imaging. In 2017 IEEE International Conference on Acoustics, Speech and Signal Processing (ICASSP) (pp. 924-928). IEEE. [12] Birkholz, P., Jackel, D. (2003, August). A three-dimensional model
of the vocal tract for speech synthesis. In Proceedings of the 15th international congress of phonetic sciences (pp. 2597-2600).
[13] Uecker, M., Zhang, S., Voit, D., Karaus, A., Merboldt, K. D., Frahm, J. (2010). Real-time MRI at a resolution of 20 ms. NMR in Biomedicine, 23(8), 986-994.
[14] Vercauteren, Tom, Xavier Pennec, Aymeric Perchant and Nicholas Ayache. “Diffeomorphic demons: Efficient non-parametric image reg-istration.” NeuroImage 45 (2009): s61-s72.
[15] J.-P. Thirion. Image matching as a diffusion process: an analogy with Maxwell’s demons.Medical Image Analysis, Elsevier, 1998, 2 (3), pp.243–260.