Publisher’s version / Version de l'éditeur:
Vous avez des questions? Nous pouvons vous aider. Pour communiquer directement avec un auteur, consultez la Questions? Contact the NRC Publications Archive team at
[email protected]. If you wish to email the authors directly, please see the first page of the publication for their contact information.
https://publications-cnrc.canada.ca/fra/droits
L’accès à ce site Web et l’utilisation de son contenu sont assujettis aux conditions présentées dans le site
LISEZ CES CONDITIONS ATTENTIVEMENT AVANT D’UTILISER CE SITE WEB.
The 9th Canadian Conference on Building Science and Technology [Proceedings], pp. 349-364, 2003-02-01
READ THESE TERMS AND CONDITIONS CAREFULLY BEFORE USING THIS WEBSITE.
https://nrc-publications.canada.ca/eng/copyright
NRC Publications Archive Record / Notice des Archives des publications du CNRC :
https://nrc-publications.canada.ca/eng/view/object/?id=375f82aa-ed25-4571-b1bd-f5343899925d https://publications-cnrc.canada.ca/fra/voir/objet/?id=375f82aa-ed25-4571-b1bd-f5343899925d
NRC Publications Archive
Archives des publications du CNRC
This publication could be one of several versions: author’s original, accepted manuscript or the publisher’s version. / La version de cette publication peut être l’une des suivantes : la version prépublication de l’auteur, la version acceptée du manuscrit ou la version de l’éditeur.
Access and use of this website and the material on it are subject to the Terms and Conditions set forth at
Wind uplift performance of roofing systems with vapour barrier
Wind uplift performance of mechanically attached roofing systems with vapour barrier
Baskaran, A.; Molleti, S.; Sexton, M.
A version of this document is published in / Une version de ce document se trouve dans :
Proceedings of the 9th Canadian Conference on Building Science and Technology, Vancouver, B.C., Feb. 27-28, 2003, pp. 349-364
www.nrc.ca/irc/ircpubs NRCC-45988
WIND UPLIFT PERFORMANCE OF
MECHANICALLY ATTACHED
ROOFING SYSTEMS WITH VAPOUR
BARRIER
A. Baskaran, S. Molleti and M. Sexton National Research Council Canada
Ottawa, Ontario, K1A OR6 613-990-3616 (phone) [email protected]
ABSTRACT
Wind dynamics, on a conventional roofing system, lift the membrane and cause fluttering, introducing stresses at the attachment locations. To identify the component of the system that has the weakest resistance against wind uplift forces, a dynamic method of evaluating roofing systems is beneficial. A vapour barrier is defined as a material of low permeance, which limits moisture transport through an assembly due to moisture diffusion. In addition, some vapour barriers can also resist the airflow movement. The objective of this paper is to investigate the changes in the wind uplift performance in a roof assembly with and without the presence of such vapour barrier. Two vapour barrier types were evaluated as components of full-scale mockups. These include polyethylene film conventionally used in low slope roof assemblies in Canada and modified bituminous surfaced reinforced film, a new product in the roofing market. Wind uplift evaluations are being carried out at the Dynamic Roofing Facility (DRF) of the National Research Council of Canada, using the SIGDERS (Special Interest Group on Dynamic Evaluation of Roofing Systems) dynamic wind test protocol. Systems with vapour barriers performed better than the systems without vapour barriers. Use of vapour barrier minimizes asymmetrical stress concentration and improves the wind rating of the mechanically attached roofing systems.
Key words: Wind uplift, Roofing system, Vapour barrier, Dynamic testing, Fastener forces, and Failure
INTRODUCTION
The design of a roofing system must account for the effects of wind. The wind-induced pressures on a roof system can vary across the surface of the roof. The wind's effects can also vary with time since pressure fluctuates with wind. This is particularly important in conventional low slope roofing systems where the waterproof component of the system, a flexible membrane, is on the outer surface and exposed to external environmental conditions such as wind and temperature changes. The present study focuses on the behaviour of such roof systems in which thermoplastic (TPO) membranes are used as the waterproof component.
A vapour barrier (VB) is defined as a building envelope element that limits diffusion of moisture into an assembly. Diffusion is water vapour migration in a material. Its rate depends on two factors: water vapour pressure difference across the roof assembly and resistance of materials along the migration path. Some materials have more resistance than others. Since the VB is intended to limit moisture diffusion, the main property requirement of a VB is low water vapour permeance. According to the Canadian General Standards Board (CGSB), VB are classified as Type I, Type II or Type III depending on the permeance rate. For example, in practice a 6-mil (0.006 in.) thick polyethylene sheet qualifies as a Type I VB with a permeance of 15 ng/(s.m2.Pa) or less. Some VB materials can also offer high resistance to the air movement in an assembly (CMHC, 1988)
In Canada during the 1960s, VB were introduced to control vapour diffusion in walls (Handegord, 1960). Since then, VB have become a research focus at the Institute for Research in Construction at the National Research Council of Canada - IRC/NRC (formerly known as Division of Building Research – DBR). As new materials and system designs evolve, IRC/NRC continues to respond to the needs of the construction industry in addressing issues relating the overall performance behaviour and requirements of such materials. On going efforts include research on the fundamentals of vapour diffusion in building materials and assemblies (Kumaran et al, 1994), the development of new standards (Kumaran, 1998) and updating the building codes and best practices (Quirouette, 1985). In the USA during the past decade, researchers {Tabiasson (1984 to 1996)} studied the need for a VB in roof assemblies. Based on those works, valuable design guidelines were developed and made available for designers in Chapters 20 and 21 of the ASHRAE (2001) fundamental handbook. The majority of the efforts are limited in finding ways to limit the vapour diffusion movements in building envelope. Some VB materials also have the property of resisting airflow. At this time, no studies exist which address the effect of such VB on the wind uplift performance of roof assemblies. A need for such understanding is more critical now than ever as the market share for new single ply roof assemblies is significantly increasing in comparison to the conventional built up roofs.
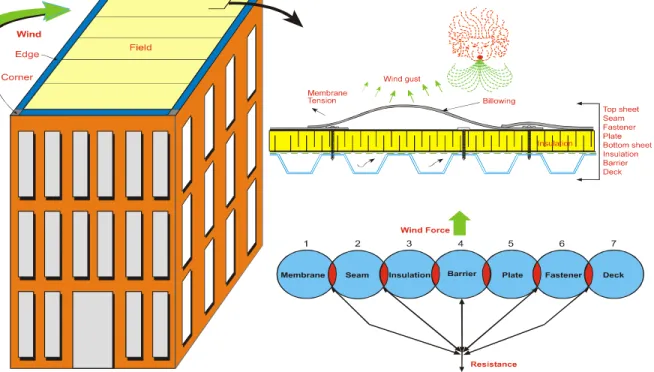
As shown in Figure 1, in most of the single ply roofs, insulation is located above the deck. A waterproof membrane (may also act as air barrier) is placed on the insulation top and attached using mechanical fasteners with the structural deck. The attachment locations are then overlapped as seams. Wind induced suction lifts the membrane between the attachments and causes membrane elongation and billowing. The magnitude of the wind induced suction and the membrane’s elastic property determines the billowing shape. Figure 1 also shows the components of a mechanically attached single ply roof assembly. Each component offers a certain resistance to the wind uplift force. This can be illustrated through a force-resistance link diagram. All resistance links should remain connected for the system to be durable and to keep the roof properly in place. Failure occurs when the wind uplift force is greater than the resistance of any one or more of these links. For example, the roof assembly is considered failed when a fastener (Link 6) pulls out from the deck although the membrane and its seams are in good condition. Similarly, a system is considered failed when a seam (Link 2) opens under gusting wind while other components are intact.
Figure 1: Wind effects on single ply mechanically attached roof assemblies
As seen from the force resistance link diagram, the VB is one of the resistance links (Link 4) to wind uplift force. Depending on the VB’s properties, it can also act as an air retarder. The present research attempts to answer the following questions: Does the presence of a vapour barrier in a system strengthen the force resistance chain and to what degree does the wind uplift rating increase? To quantify this, an experimental program has been initiated at the NRC/IRC (Baskaran and Lei, 2001). This paper presents and discusses selected data from this on-going investigation. By constructing field mock-ups in the DRF, systems with and without VB were tested under dynamic environment. System responses are measured based on two design factors: pressure and force. By
presenting the comparison between the systems with and without VB, the paper quantifies the wind-uplift related benefits of including a VB in low slope roof assemblies.
EXPERIMENTAL APPROACH
Dynamic Wind Test Protocol
All the specimens were subjected to the SIGDERS (Special Interest Group on Dynamic Evaluation of Roofing Systems) dynamic load cycle. The SIGDERS load cycle was developed based on extensive wind tunnel studies of full-scale roof systems measuring
3 m × 3 m (10 ft × 10 ft). These studies were carried out in NRC's 9 m × 9 m (30 ft × 30 ft) wind tunnel. Details of the method by which the load cycle was developed
can be found in Baskaran et al (1999). A summary of the load cycle follows:
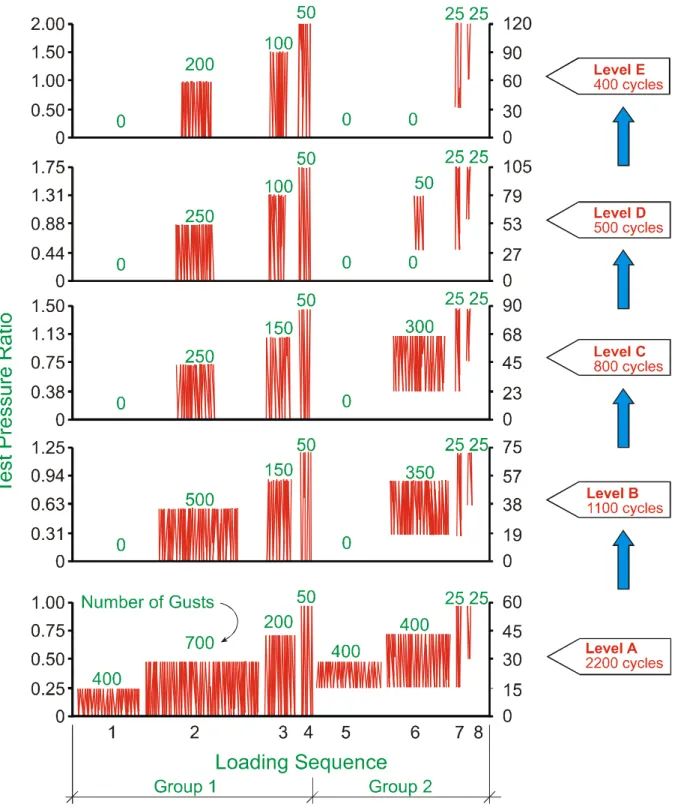
As shown in Figure 2, the SIGDERS dynamic protocol has five rating levels (A to E). To evaluate a roof assembly for a specific wind resistance, all the gusts corresponding to Level A should be applied.
• •
•
•
Each level consists of eight load sequences with different pressure ranges, depicted in Figure 2. The eight load sequences can be divided into two groups. Group 1 represents wind-induced suction over a roof assembly. It consists of four sequences, where the pressure level alternates between zero and a fixed pressure. Group 2 represents the effects of exterior wind fluctuations combined with a constant interior pressure on a building. Internal pressure variations are explicitly codified in the recent North American wind standards (ASCE 1998, NBCC 1995). The SIGDERS test protocol accounts for such variations.
The test pressure ratios (y-axis) for a test can be calculated from the design pressure, in accordance with local building codes or wind standards. The pressures for each load sequence are calculated as percentages of the test pressure. For the present investigation, all the tests started from Level A with a test pressure of 4.3 kPa (90 psf).
To evaluate the ultimate strength of the roofing system, testing should be started at Level A and should be continued when moving from one level to another. To obtain a rating, all specified numbers of gusts in each level must be completed without any resistance link failure. As discussed in the Figure 1, the system is considered as “Failed”, even if one resistance link fails.
Dynamic Roofing Facility
Experimental work was carried out at the Dynamic Roofing Facility (DRF) established at the IRC/NRC. Baskaran and Lei (1997) provide a detailed documentation of the facility’s features. The DRF consists of a bottom frame of adjustable height upon which roof specimens are installed and a movable top chamber. The bottom frame and top chamber are 6100 mm (240 in.) long, 2200 mm (86 in.) wide and 800 mm (32 in.) in height. The top chamber is equipped with six windows for viewing, and with a gust simulator, which consist of a flap valve connected to a stepping motor through a timing belt arrangement.
Wind suctions as high as 10 kPa (209 psf) over the roof assembly is produced by a 37 kw (50 HP) fan with a flow rate of 2500 L/sec (5300 cfm). A computer uses feedback signals to control the operation of the DRF. The computer regulates the fan speed in order to maintain the required pressure level in the chamber. Operation of the flap valve simulates the gusts. Closing the flap valve allows pressure to build in the chamber, and opening the valve bleeds the pressure. To monitor the response of the roof system, typical design parameters of pressure and force were measured using a computer based data acquisition system.
System Details
As shown in Figure 3, three roofing systems were constructed. System 1 had no vapour barrier (NOVB). System 2 had a polyethylene film as vapour barrier (Poly). System 3 had SBS modified reinforced film as vapour barrier (SBS). Minimums of two specimens, for each system, were tested. The tested systems consisted of the following roofing components whose general physical and mechanical properties are:
Deck: 0.76 mm (22-Ga) thick corrugated steel deck with a profile height of
38 mm (1.5 in.) and a flute width of 150 mm (5.9 in.). The steel deck was fastened using size-10 round-head screws at every flute with wooden beams of the DRF. The wooden beams are 152 mm x 152 mm (6 in. x 6 in.) in size and spaced about 1829 mm (72 in.) apart.
Insulation: 51 mm (2 in.) thick polyisocyanurate (ISO) boards of 1.2 m x 2.4 m
(4 ft x 8 ft) are mechanically attached to the steel deck using 8 fasteners per board. Fasteners were 127 mm (5 in.) long with plastic plate 76-mm (3 in.) diameter.
Vapour Barrier: Two types of vapour barriers are used:
1) Polyethylene film -single layer of 6 mil (0.006 in.) sheet was loose laid over
gypsum boards of 12.7 mm thick x 1219 mm x 2438 mm (½ in. x 4 ft x 8 ft) on the entire length of the table. Gypsum boards were used to minimize any sagging of the polyethylene film in to the female flutes of the steel decks.
2) SBS modified surface reinforced film – 0.8 mm thick (1/32 in) sheets were
self-adhered to the steel deck. It is composed of SBS modified bitumen and surface reinforced. It comes in strips of 1140 mm wide (45 in). According to the manufacture specification, these films can be directly applied over the steel deck without gypsum boards.
Membrane: Reinforced TPO membrane sheets were used for all the tests. The
Insulation over the Poly Gypsum over the Deck
SBS over the deck
Figure 3: System installation at the DRF
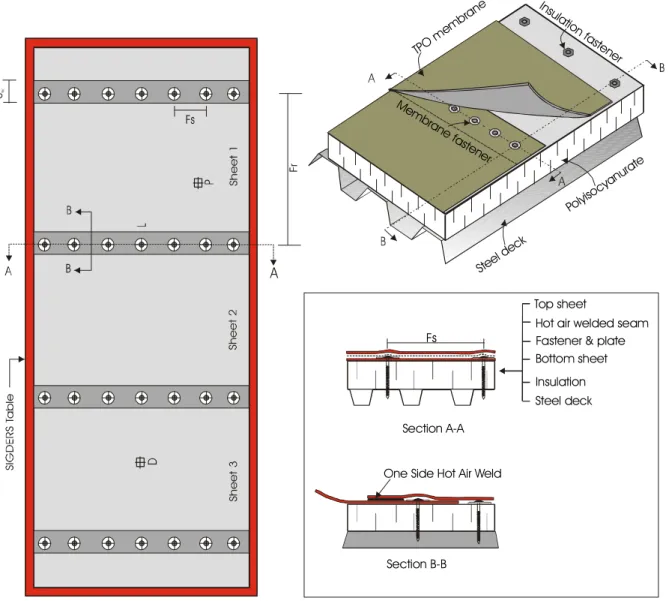
Geometric details of a typical tested system are depicted in Figure 4. This figure shows the top view of the test assembly installed in the DRF with three full-width sheets and a dummy sheet at either end. The four seams shown in the Figure 4 indicate the fastener locations. For the tested system, membrane sheets were fastened at 305 mm (12 in.) spacing (Fs) along the seam resulting in 7 fasteners per seam. The distance between any two-fastener rows is known as fastener rows spacing (Fr = 1790 mm (70.5 in.)). Fasteners were 127 mm (5 in.) long with metal plates of 61mm (238 in.) diameter. Figure 4 also depicts the details of a typical seam. Each seam had an overlap of (SW) 111 mm
73 mm (278 in.) from the edge of the overlapping sheet. The portion of the seam beyond the fastener row was welded with hot air such that a waterproof top surface was obtained. The width of the welded portion varied between 38 mm and 45 mm (1.5 in. and 1.75 in.). P, L and D respectively represent pressure, force and deflection measurement locations.
One Side Hot Air Weld
Section B-B Insulatio n fa stener Mem brane fa stener TPO m embra ne Steel d eck Polyiso cyanur ate Top sheet
Fastener & plate
Insulation Steel deck Bottom sheet Hot air welded seam
Section A-A Fs
Figure 4: Layout and sectional view of a typical tested roof assembly
RESULTS AND DISCUSSION
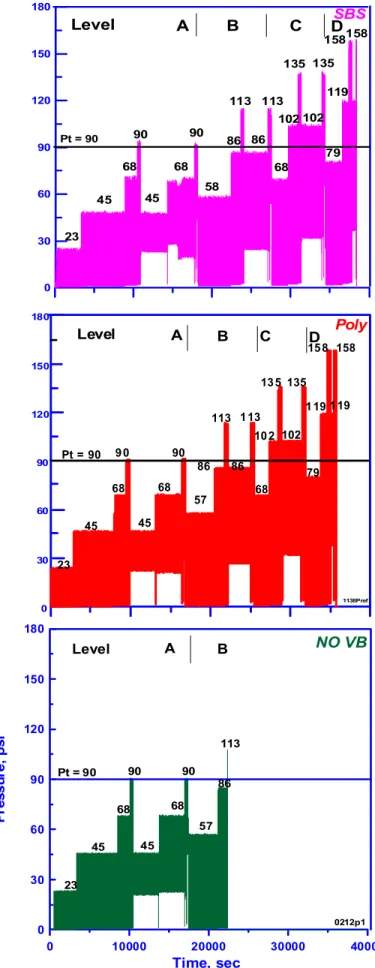
Figure 5 shows the measured response data for three systems. System 1 (NOVB) sustained a maximum pressure of 4.3 kPa (90 psf) and passed all eight sequences of Level A of the SIGDERS test protocol. This means that the system configuration passed the gusts applied over a constant static pressure component in Group 2 (refer to Figure 2), as well as those in Group 1. When the applied pressure was 5.0 kPa (105 psf), the system failed (failure mode discussed under Figure 6) at the loading sequence 4 gust number 12.
0 30 60 90 120 150 180 23 45 68 90 45 68 90 58 86 113 86 113 68 102 135 135 102 79 119 158158 Level A B C DSBS Pt = 90 Pt = 90 0212p1 0 10000 20000 30000 40000 Time, sec 0 30 60 90 120 150 180 P ress u re , p sf 23 45 68 90 45 68 90 57 86 113 Pt = 90 NO VB Level A B 0 30 60 90 120 150 180 1138Pref Level A B C Poly 23 45 68 9 0 45 68 90 57 86 86 113 1 13 68 10 2 102 13 5 135 79 1 19 1 19 15 8 158D
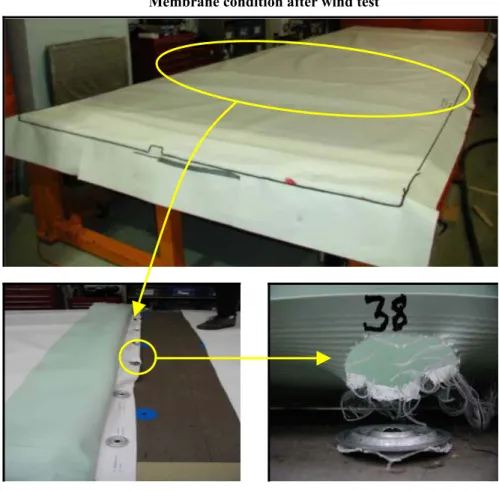
System 2 (Poly) and System 3 (SBS) sustained a maximum pressure of 6.5 kPa (135 psf) and passed all necessary sequences up to Level C of the SIGDERS test protocol. Both Systems failed at the loading sequence 7 of Level D {7.6 kPa (158 psf)}. Reproducibility tests were also undertaken and they confirmed the above findings. After the wind test, failed systems were examined for the weakest link. Figure 6 shows a typical example of a failure mode. All three systems failed due to membrane tear around the fastener plate. Closer examination of the failure showed that the membrane had been stretched around the plate, and then torn completely away from around the plate, while the fasteners remained engaged with the deck. There was also an instance of delamination failure, as the membrane peeled slightly at one fastener location. Examination of the system’s seams after the test revealed that the membrane had experienced some stretching, and bore teeth marks from the metal fastener plates. Kramer (1994 and 1995) quoted the most common observed failure for membrane roofs as, “Slippage of roof membrane from below
attachment plate leading to loss of compression between roof membrane, insulation substrate, and fastening elements and ultimately to membrane failure by way of tear spread around the fastener shaft”. This observation coincides with SIGDERS failure
mode and indicates that the SIGDERS load cycle is inducing representative wind dynamics on roof systems.
Membrane condition after wind test
Failed Seam
Membrane pull through Figure 6: Failure mode of the tested system
Presence of a VB, as discussed above, improves the wind uplift rating. Also there is no change in the failure mode or in the weakest link on the force resistance chain. Note that components such as the membrane, insulation fastener and plates, membrane fastener and plates with similar physical and mechanical properties were used for the all three systems. However, these components were not from the same batch of the manufacturing production. Every effort was also made to have identical system layouts and instrument locations to those shown in Figure 4. Moreover, the same roof installer installed all three systems on the DRF. If there is no change in the process and the weakest link, then how can the system resistance improve? To understand this, further data analysis was undertaken as discussed below.
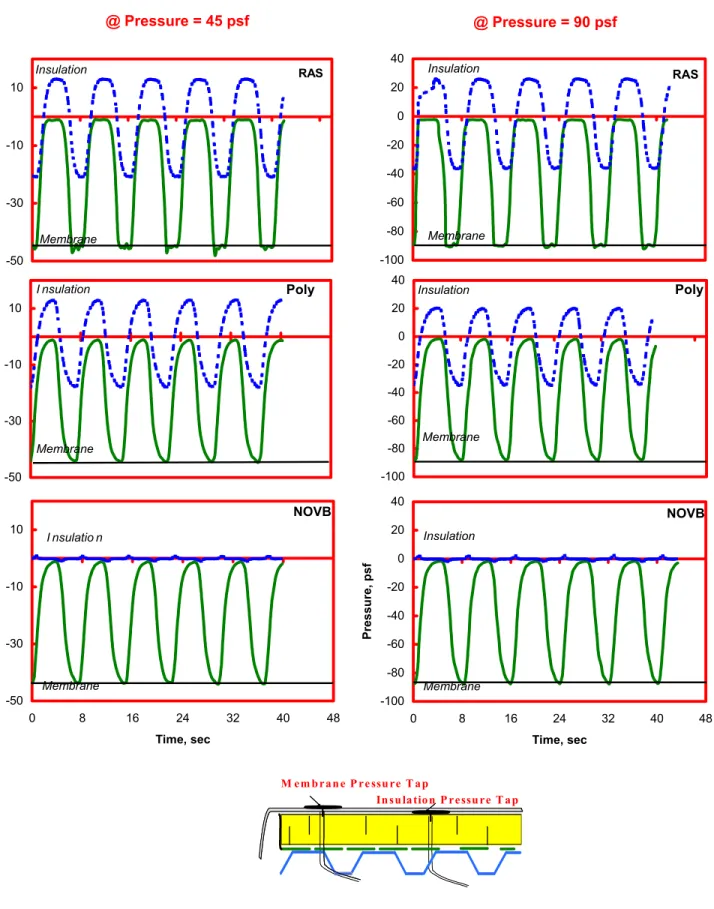
A segment from the measured pressure time history is shown in Figure 7. Figure 7 has three data sets representing NOVB, Poly and SBS systems at two pressure levels of 2.2 kPa (45 psf) and 4.3 kPa (90 psf). These pressures respectively represent the loading sequences 2 and 4 of Level A of the SIGDERS load cycle. In all cases, about five SIGDERS’ wind gusts are shown each having duration of about 8 seconds. Within the 8-second period, the roofing membrane experiences the maximum pressure 2.2 kPa or 4.3 kPa (45 psf or 90 psf) for 2 seconds. The membrane when subjected to suction at the top, billows and transfers the forces through the fastener to the structural deck. This is true irrespective of the system. It is interesting to note that in case of NOVB system, there is no pressure building up across the insulation and the insulation acts as a spacer between the membrane and deck. However, in the case of systems with VB, the insulation boards share about one third of the applied suction. This is due to the fact these VB types offer also a certain resistance to airflow in addition to limiting vapour diffusion. This insulation pressure fraction partly elevates the stress on the membrane fasteners and plates and facilitates to increase the wind uplift rating of systems with VB. To reinforce this observation, measured fastener forces are analysed and discussed below.
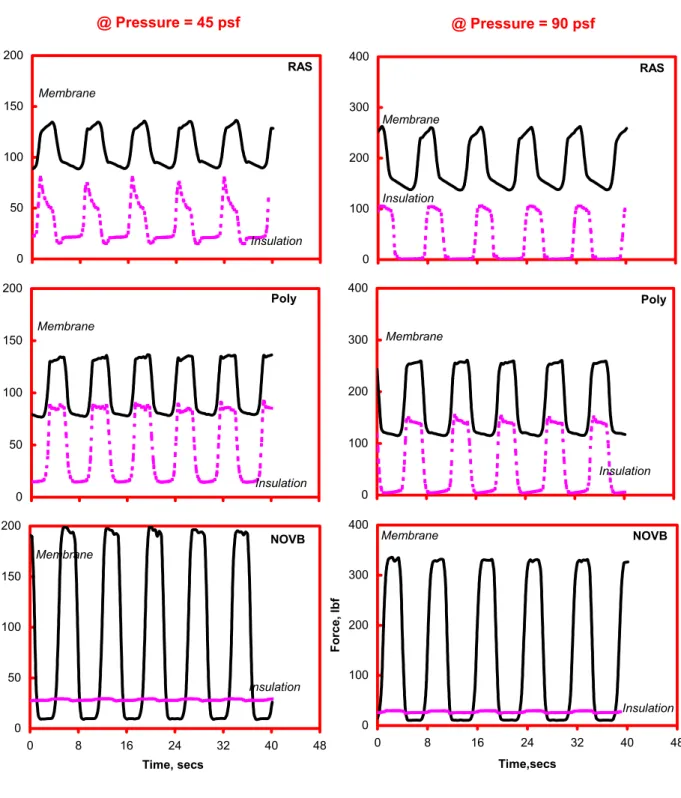
Figure 8 displays the tensile forces measured from the fasteners of both membrane and insulation. Figure 8 has the same format as that of the Figure 7 with the exception that the vertical axis shows the forces. Several factors are evident from this Figure, some of which are outlined below.
Only the waterproof membrane resists the induced forces in the case of the NOVB system and the sensor connected to insulation fastener is recording no changes in the set preload irrespective of the 2.2 kPa (45psf) or 4.3 kPa (90 psf) wind gusts. This is similar to system response to applied suction.
•
• Not only the magnitude of the load on the membrane is greater in the case of the NOVB system but also the fluctuations. In the case of NOVB system, the membrane
fastener force varies from 0 to 1556 N (0 to 350 lbf) or 0 to 889 N (0 to 200 lbf) depending on 2.2 kPa (45psf) or 4.3 kPa (90 psf) wind gusts. For the
same 4.3 kPa (90 psf) wind gusts, on the systems with VB, the membrane fastener force ranges only between 445 to 1112 N (100 to 250 lbf).
@ Pressure = 45 psf @ Pressure = 90 psf Poly 40 -100 -80 -60 -40 -20 0 20 Insulation Membrane NOVB -20 0 20 40 essure, psf Insulation -100 -80 -60 -40 0 8 16 24 32 40 48 Time, sec P r Membrane -100 -80 Membrane RAS -60 -40 -20 0 20 40 Insulation RAS -50 -30 -10 10 Membrane Insulation Poly -50 -30 -10 10 Membrane I nsulation NOVB -50 -30 -10 10 0 8 16 24 32 40 48 Time, sec P ressure, psf Membrane I nsulatio n In su lation P ressu re T ap M em b ran e P re ssu re T ap
@ Pressure = 45 psf @ Pressure = 90 psf 100 200 300 400 Force, lbf 0 0 50 100 150 200 0 8 16 24 32 40 48 Time, secs Force ,lbf Membrane Insulation NOVB 50 100 150 Membrane Insulation 200 Poly 0 50 100 150 200 RAS Membrane Insulation 0 0 8 16 24 32 40 48 Time,secs Insulation Membrane NOVB 0 100 200 300 Membrane Insulation 400 Poly 0 100 200 300 400 Membrane Insulation RAS
On systems with VB, insulation fasteners take about one third or higher tensile forces from the membrane fasteners. For example, during the 4.3 kPa (90 psf) wind gusts in the system with Poly film, the membrane fastener force is 1112 N (250 lbf) and the insulation fastener force is 667 N (150 lbf).
•
• When there is no VB in the assembly, membrane is the only component resisting the airflow. When there is a VB, in addition to the preliminary function of controlling the moisture migration, it also offers certain resistance to the airflow and works with the rigid insulation boards to share certain amounts of applied suction during the wind gusting.
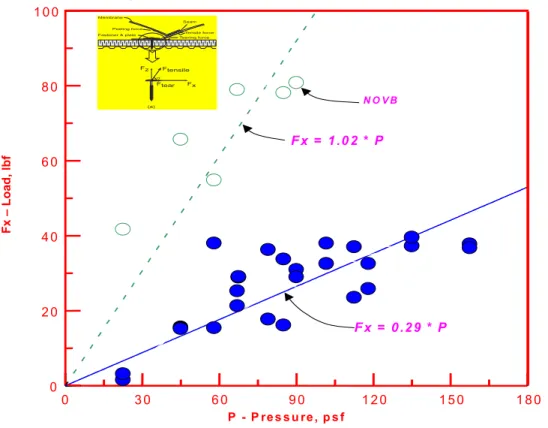
During the wind uplift testing, the above discussed force induced at the fastener was measured using a force balance specially developed at the NRC. The force balance has the capacity to measure simultaneously both vertical and horizontal forces. The measured horizontal component of the forces acting on the membrane fastener is compared between the systems with and without VB at different pressures in Figure 9. The data indicate that the horizontal forces were reduced by about two third due to the presence of VB. This reduces stress concentration around the membrane fastener plates during wind gusting. In the NOVB systems, the fastener plates can slide and the fastener shaft can tear the membrane around the vicinity of the fastener plates. On the other hand, in the systems with VB, the stress localisation causes either a fastener pullout from the deck if the membrane is strong enough, or membrane tearing around the plates. The latter was observed during this study.
F x = 0 .2 9 * P F x = 1 .0 2 * P
(a) Seam
Tensile force Fastener & plate
Peeling force Membrane Tearing force Fz Ftensile Fx Ftear s N O V B 0 3 0 6 0 9 0 1 2 0 1 5 0 1 8 0 P - P re s s u re , p s f 0 2 0 4 0 6 0 8 0 1 0 0 F x – Loa d, lbf
The above findings justify the beneficial effect of the VB in increasing the wind uplift rating even though the weakest link remains the same for all assemblies, that is, at the membrane interface with the fastener. In other words, in a system with VB, the load sharing performance of the VB and insulation contributes to the increased wind uplift resistance.
CONCLUSIONS
Based on the presented results and discussions, the following conclusions can be drawn: Wind uplift performance is improved on systems with vapour barrier. An improvement of about 50% has been measured in the wind uplift rating for systems with vapour barrier. This is found true for two vapour barrier types. It is worth to caution that the 50% improvement is not due to the ability of the vapour barrier to reduce the moisture diffusion rather its property to resist air movements.
•
• • • •
In addition to the function of controlling the moisture diffusion, the tested vapour barriers also offered a certain resistance to the airflow and together with the rigid insulation shared about one third of the applied wind suction.
Use of vapour barrier can also minimize stress concentration at the fastener attachment locations of mechanically attached low slope roofing systems.
One of the most common membrane layouts from field application was constructed and tested in the lab mock-up. Therefore, the above quantification may equally be valid for roof assemblies with thermoset membrane such as the EPDM.
Two types of investigation are in progress to: (1) study the influence of the other vapour barrier types such as felt and kraft papers that can offer only minimum resistance to air flow. (2) quantify the wind uplift performance of single ply roofs with defective (with fastener holes and seams not taped) vapour barriers.
ACKNOWLEDGMENT
The presented research is being carried out for a consortium - Special Interest Group for Dynamic Evaluation of Roofing Systems (SIGDERS). SIGDERS was formed from a group of partners who were interested in roofing design. These partners included:
Manufacturers: Atlas Roofing Corporation, Canadian General Tower Ltd., GAF
Materials Corporation, Genflex Roofing Systems, Firestone Building Products Co., IKO Industries Canada, Johns Manville Corporation, Stevens Roofing systems and Soprema Canada
Building Owners: Canada Post Corporation, Department of National Defence, Public
Works and Government Services Canada.
Industry Associations: Canadian Roofing Contractors' Association, Canadian Sheet Steel
Building institute, Industrial Risk Insurers, National Roofing Contractors' Association and Roof Consultants Institute.
Research Agencies: Institute for Research in Construction, Institute for Aerospace Research and Canadian Construction Material Centre.
REFERENCES
ASCE. 1998. “Minimum design loads for buildings and other structures”, ASCE
Standard 7 98, American Society of Civil Engineers, Reston, Va., p. 13.
Baskaran, A.; Chen, Y.; Vilaipornsawai, U. 1999, "A New dynamic wind load cycle to
evaluate flexible membrane roofs," Journal of Testing and Evaluation, 27, (4), July, pp. 249-265.
Baskaran, A. and Lei, W. 1997."A New Facility for Dynamic Wind Performance
Evaluation of Roofing Systems". Proceedings of the Fourth International Symposium on Roofing Technology, NRCA/NIST, Washington, D.C., U.S.A., pp. 168-179.
CMHC. 1988. “Air Permeance of Building Materials”, Report by AIR-INS Inc.
Gerhardt, H.J. 1989. “Roofing Membrane-Observed Damage, Failure Modes, Failure
Hypotheses and Laboratory Testing”, Proceedings of the Roofing Wind Uplift Testing Workshop, Oak Ridge, Tennessee, pp.19-34.
Handegord, G.O. 1960. “Vapour Barriers in Home Construction”, Canadian Building Digest, 9.
Kramer, C. 1994. “Damage and Damage Analysis of Roofing System for Large
Industrial Flat Roof Building”, Proceedings of International Conference on Building Envelope Systems and Technology, Nanyang Technological University, Singapore, pp. 573-578.
Kramer, C. 1995. “Typical Failure Modes of Building Envelopes”, 9th International Conference on Wind Engineering, New Delhi, India, pp. 1231-1242
Kumaran, M.K., G.P. Mitalas and M.T. Bomberg, 1994. "Fundamentals of transport
and storage of moisture in building materials," ASTM Manual on Moisture Control in Buildings, MNL 18, Chapter 1.
Kumaran, M.K. 1998. “Inter Laboratory comparison of the ASTM standard test
methods for water vapour transmission of materials" Journal of Testing and Evaluation, 26, (2), pp. 83-88.
Lei.W and Baskaran, A. 2001. “SIGDERS Wind Uplift Resistance Data on
Mechanically Attached Single Ply Roofing Systems-Effect of Vapour/Air Barrier”,
Internal Report, Institute for Research in Construction, National Research Council Canada, 823, pp. 68
NBCC. 1995. National Building Code of Canada 1995, Canadian Commission on
Building and Fire Codes, National Research Council of Canada, Ottawa. (Part 5).
Quirouette, R.L. 1985. “The Difference Between a Vapour Barrier and an Air Barrier”, Building Practice Note, Division of Building Research, National Research Council Canada, 54.
Tobiasson. W, 1984.“Condensation Control in Low Slope Roofs”, Proceedings of the
Symposium Moisture Control in Building, Building thermal Envelope Co-ordinating Council, pp 47-59.
Tobiasson.W, 1996. “Vents and vapour Retarding for Roofs”, Proceedings of the
Symposium on Air Infiltration, Ventilation and Moisture Transfer, Building thermal Envelope Co-ordinating Council, pp 187-197.