Cell-Cycle-Targeting MicroRNAs as
Therapeutic Tools against Refractory Cancers
The MIT Faculty has made this article openly available.
Please share
how this access benefits you. Your story matters.
Citation
Hydbring, Per et al. "Cell-Cycle-Targeting MicroRNAs as
Therapeutic Tools against Refractory Cancers." Cancer Cell 31, 4
(April 2017): 576-590 © 2017 Elsevier Inc
As Published
http://dx.doi.org/10.1016/J.CCELL.2017.03.004
Publisher
Elsevier BV
Version
Author's final manuscript
Citable link
https://hdl.handle.net/1721.1/121983
Terms of Use
Creative Commons Attribution-NonCommercial-NoDerivs License
Cell Cycle-Targeting MicroRNAs as Therapeutic Tools Against
Refractory Cancers
Per Hydbring1,2,3, Yinan Wang4, Anne Fassl1,2, Xiaoting Li4, Veronica Matia1,2, Tobias Otto1,2, Yoon Jong Choi1,2, Katharine E. Sweeney1,2, Jan M. Suski1,2, Hao Yin5, Roman L. Bogorad5, Shom Goel1,6, Haluk Yuzugullu1,7, Kevin Kauffman5, Junghoon Yang5, Chong Jin4, Yingxiang Li4, Davide Floris1,2, Richard Swanson8, Kimmie Ng6, Ewa Sicinska9, Lars Anders1, Jean J. Zhao1,7, Kornelia Polyak6, Daniel G. Anderson5,10, Cheng Li4,*, and Piotr Sicinski1,2,11,*
1Department of Cancer Biology, Dana-Farber Cancer Institute, Boston, MA 02215, USA 2Department of Genetics, Harvard Medical School, Boston, MA 02215, USA
3Department of Oncology-Pathology, Karolinska Institutet, 17176 Stockholm, Sweden 4School of Life Sciences, Center for Life Sciences and Center for Statistical Science, Peking University, Beijing 100871, China
5David H. Koch Institute for Integrative Cancer Research, Massachusetts Institute of Technology, Cambridge, MA 02139, USA
6Department of Medical Oncology, Dana-Farber Cancer Institute, Boston, MA 02215, USA 7Department of Biological Chemistry and Molecular Pharmacology, Harvard Medical School, Boston, MA 02115, USA
8Department of Surgery, Brigham and Women’s Hospital, Boston, MA 02115, USA
9Department of Oncologic Pathology, Dana-Farber Cancer Institute, Boston, MA 02215, USA 10Department of Chemical Engineering, and Institute of Medical Engineering and Science, Massachusetts Institute of Technology, and Harvard-MIT Division of Health Sciences & Technology, Cambridge, MA 02139, USA
SUMMARY
*Correspondence: cheng_li@pku.edu.cn (C.L.), peter sicinski@dfci.harvard.edu (P.S.).
11Lead Contact
Publisher's Disclaimer: This is a PDF file of an unedited manuscript that has been accepted for publication. As a service to our
customers we are providing this early version of the manuscript. The manuscript will undergo copyediting, typesetting, and review of the resulting proof before it is published in its final citable form. Please note that during the production process errors may be discovered which could affect the content, and all legal disclaimers that apply to the journal pertain.
AUTHOR CONTRIBUTIONS
P.H. and P.S. designed the study and wrote the paper. P.H. performed the experiments. Y. W., X.L., C.J., and Y.L. contributed computational analyses, which were directed and supervised by C.L. A.F., V.M., T.O., Y.J.C., K.S., J.S., D.F. L.A, helped with experiments; L.A helped with screen design. H. Yin, R.L.B., K.K., J.Y., D.G.A. provided nanoparticle-formulated-miRNAs. S.G., H.Y., J.J.Z. helped with experiments and contributed xenografts of TNBC. R.S. provided colon cancer specimen, K.N. xenografts of
HHS Public Access
Author manuscript
Cancer Cell
. Author manuscript; available in PMC 2018 April 10.Published in final edited form as:
Cancer Cell. 2017 April 10; 31(4): 576–590.e8. doi:10.1016/j.ccell.2017.03.004.
A
uthor Man
uscr
ipt
A
uthor Man
uscr
ipt
A
uthor Man
uscr
ipt
A
uthor Man
uscr
ipt
Cyclins and cyclin-dependent kinases (CDKs) are hyperactivated in numerous tumors. To identify means of interfering with cyclins/CDKs, we performed nine genome-wide screens for human microRNAs (miRNAs) directly regulating cell cycle proteins. We uncovered a distinct class of miRNAs that target nearly all cyclins/CDKs, which are very effective in inhibiting cancer cell proliferation. By profiling the response of over 120 human cancer cell lines, we derived an expression-based algorithm that can predict the response of primary tumors to cell cycle-targeting miRNAs. Using systemic administration of nanoparticle-formulated miRNAs, we inhibited tumor progression in seven mouse xenograft models, including three treatment-refractory patient-derived tumors, without affecting normal tissues. Our results highlight the utility of using cell cycle-targeting miRNAs for treatment of refractory cancer types.
eTOC Blurb
By performing screens for miRNAs targeting cell cycle proteins, Hydbring et al. identify a class of miRNAs that target multiple cyclins and CDKs. Nanoparticle delivery of these miRNAs inhibits tumor growth in several xenograft models, including treatment-refractory patient-derived xenografts.
Keywords
cell cycle; cyclins; cyclin-dependent kinases; microRNAs; cancer
INTRODUCTION
The proliferation of mammalian cells is driven by cyclins and their catalytic partners, cyclin-dependent kinases (CDKs). Cyclin-CDK complexes phosphorylate cellular proteins, thereby driving cell cycle progression. Stimulation of cells with growth factors induces the
expression of D-type cyclins (cyclins D1, D2, and D3), which bind and activate CDK4 or CDK6. Later during the G1 phase, E-type cyclins (cyclins E1 and E2) become upregulated and activate CDK2 (and to a lesser extent CDK1). Cyclin E-CDK2 complexes regulate entry of cells into the DNA synthesis (S-phase). Further progression of cells through the S-phase is driven by cyclin A2, which partners with CDK2. Later during mitotic prophase cyclin B translocates to the nucleus and activates CDK1. Cyclin B-CDK1 kinases drive mitotic events such as spindle pole assembly, chromosome condensation and nuclear envelope breakdown (Malumbres and Barbacid, 2009).
A comprehensive analysis of human cancers revealed that genes encoding cyclins and CDKs belong to the most frequently amplified loci (Beroukhim et al., 2010). The importance of overexpression of D-type cyclins in pathogenesis of human cancer has been particularly well established (Musgrove et al., 2011). Analyses of mouse genetic models revealed the
requirement for specific cyclins and CDKs in development and maintenance of a wide array of tumor types (Malumbres and Barbacid, 2009).
Collectively these observations firmly established essential roles for cyclins and CDKs in tumorigenesis and led to the development of several CDK inhibitors. Some of these compounds are currently in clinical trials, and three CDK4/6 inhibitors (palbociclib
A
uthor Man
uscr
ipt
A
uthor Man
uscr
ipt
A
uthor Man
uscr
ipt
A
uthor Man
uscr
ipt
abemaciclib and ribociclib) received a “Breakthrough Therapy” designation from the Food and Drug Administration and were approved for treatment of estrogen receptor-positive breast cancers (Asghar et al., 2015; Finn et al., 2015). However, the clinical success of targeting the cell cycle machinery has been limited so far. For instance, palbociclib was shown to significantly prolong progression-free survival of cancer patients, but it had no major impact on overall survival (Finn et al., 2015). A likely reason for this disappointing outcome is that redundant cyclins and CDKs compensate for the inhibition of CDK4 and CDK6, thereby allowing tumor progression. For this reason, agents that target multiple cyclins and CDKs might offer a therapeutic advantage by preventing compensatory upregulation of cell cycle kinases.
MicroRNAs (miRNAs) have been recognized for their potential in cancer therapeutics, and multiple miRNAs were suggested to either play tumor-suppressive or tumor-promoting roles (Adams et al., 2014; Hayes et al., 2014). miRNAs bind their target transcripts via the 3′ untranslated regions (3′UTR) of messenger RNAs. miRNAs do not extinguish expression of their targets but reduce their levels, with individual miRNAs targeting many different transcripts (Bartel, 2009). We hypothesized that such a broad dampening of expression of several cell cycle proteins might allow to selectively block proliferation of cancer cells without having major effects on their non-transformed counterparts. Moreover, targeting several cell cycle proteins at once could be beneficial in cancer therapeutics since it would give less room for cell cycle compensatory mechanisms that may lead to acquired resistance to CDK inhibition.
Although numerous studies postulated targeting cyclins and CDKs by miRNAs in cancer treatment (Bonci et al., 2008; Johnson et al., 2007; Kota et al., 2009), no attempt was made to systematically delineate miRNAs regulating these proteins. In this study we performed nine genome-wide screens to identify the full range of miRNAs regulating major cell cycle proteins.
RESULTS
Genome-Wide Screens and Their Validation
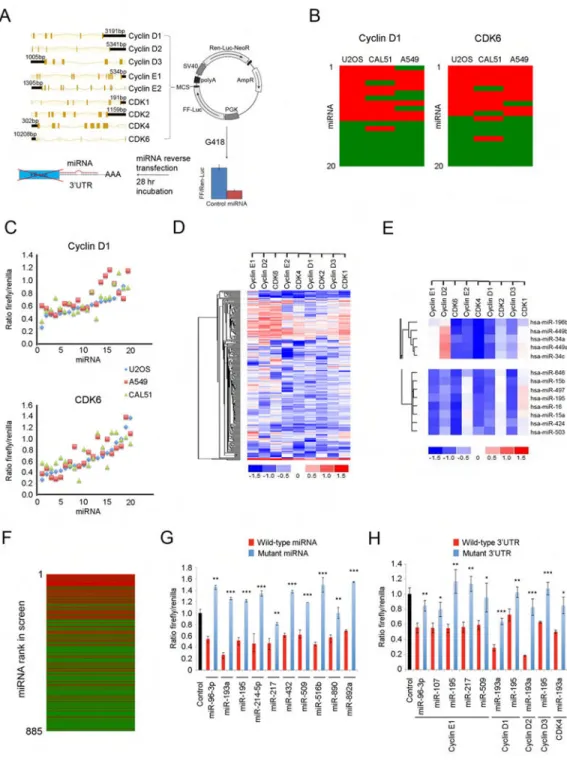
In order the determine the full repertoire of miRNAs directly regulating cell cycle cyclins and CDKs, we cloned 3′UTRs of cyclins D1, D2, D3, E1, E2, as well as CDK1, CDK2, CDK4, and CDK6 downstream of the firefly luciferase gene into a dual luciferase reporter vector. The vector also encoded renilla luciferase driven by the SV40 promoter (Figure 1A). Vectors containing 3′UTRs of cyclins or CDKs were subsequently stably expressed in U2OS cells, thereby generating nine reporter cell lines. Expression of miRNAs targeting the 3′UTR of a given cyclin or CDK in these cell lines is expected to repress the expression of the firefly luciferase while leaving renilla luciferase levels intact, and hence to decrease the firefly to renilla ratio.
Reporter cell lines stably expressing each of nine different 3′UTR-luciferase constructs were plated in 96-well plates and transfected with human miRNA mimic library containing 885 annotated human miRNAs, one miRNA per well. Twenty-eight hr post-transfection, the firefly to renilla luciferase ratios were determined (Figure 1A and Table S1). All screens
A
uthor Man
uscr
ipt
A
uthor Man
uscr
ipt
A
uthor Man
uscr
ipt
A
uthor Man
uscr
ipt
were performed in three technical replicates with all replicates displaying correlations of 0.9 or higher (Figure S1A).
Since in our screens all miRNA mimics as well as the reporter system were of the exogenous origin, we considered it unlikely that the choice of the cell line (U2OS cells) would affect the results of the screens. Nevertheless, to exclude this possibility we first determined that there was no correlation between the results of our screens and the levels of endogenous cyclins, CDKs, or miRNAs in U2OS cells (Figures S1B–S1G). Moreover, we validated our screening results using two additional epithelial cell lines CAL51 (breast cancer) and A549 (lung adenocarcinoma); please see Figures S2A–S2E for cell cycle characterization of these cells. As we did for U2OS cells, we engineered CAL51 and A549 cells to stably express the luciferase reporters linked to 3′UTRs of nine cyclins or CDKs. We then compared the response of U2OS-, CAL51- and A549-based reporter cell lines to twenty selected miRNAs. We found that the results were highly reproducible between the three cell lines. Thus, the overall reproducibility between screening results in U2OS and CAL51 cells was 79.4%, between U2OS and A549 was 78.3%, and between A549 and CAL51 was 75.6% (Figures 1B, 1C, S3A, and S3B). We concluded that the choice of U2OS cells for the screens did not significantly influence the results.
We performed unsupervised clustering of the results of all nine screens (Figures 1D and 1E). Strikingly we found that miRNAs containing a common seed sequence invariably clustered together, i.e., they produced almost identical results across the nine screens, as seen for instance for the miR-34/449 family (Figure 1E, upper panel), and the extended miR-15/16 family (Figure 1E, lower panel). This observation provided an additional confirmation for the reliability of our screen.
We next compared the results of our nine screens with in silico predicted targeting using five softwares: TargetScan, miRanda, miRDB, miRWalk and TargetSpy. Each of these algorithms predicts targeting of transcripts by miRNAs, based on genes’ 3′UTR sequences (Figure S3C). We found TargetScan to be most accurate in its ability to predict targeting, followed by miRanda (Figures S3D–S3F). We observed a strong correlation between TargetScan context score (which predicts the likelihood of targeting) and the results of our screens (Figures 1F, S3G, and S3H). Despite overall correlation, several miRNAs that were predicted to target a given cyclin or CDK did not score in our screens (Figure 1F), highlighting the limitation of the TargetScan predictive value.
A selected number of “hits” from our screens were further validated using mutant miRNAs containing point-mutations within their seed sequences (Figure 1G), as well as mutant 3′UTRs with mutations or deletions within miRNA target sequences (Figure 1H). In all cases examined, these mutations strongly diminished the ability of miRNAs to repress the luciferase expression (Figures 1G and 1H). Lastly, we confirmed the ability of selected miRNAs to repress the expression of endogenous cyclin and CDK transcripts in twelve cancer cell lines (see below). We concluded that miRNAs identified in our screens indeed repress expression of cyclins and CDKs.
A
uthor Man
uscr
ipt
A
uthor Man
uscr
ipt
A
uthor Man
uscr
ipt
A
uthor Man
uscr
ipt
Identification of Cell Cycle-Targeting miRNAs
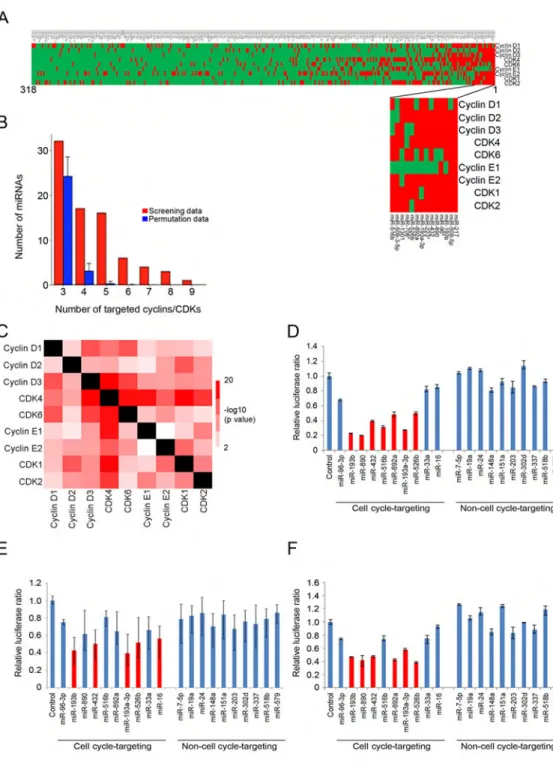
We constructed a heat map of all miRNAs targeting at least one cyclin or CDK. These analyses revealed the presence of a group of miRNAs that target all or nearly all cell cycle proteins analyzed (Figure 2A). Importantly, the number of these cell cycle-targeting miRNAs was significantly higher than the number predicted from random permutations (Figure 2B). Thus, we found 16 miRNAs targeting 5 cyclins or CDKs, as compared to 0.26 predicted from random permutations, 6 miRNAs targeting 6 cyclins/CDKs (predicted 0.01), 4 miRNAs targeting 7 cyclins/CDKs (predicted 0.0007), 3 miRNAs targeting 8 cyclins/ CDKs (predicted 0), and 1 miRNA targeting 9 cyclins/CDKs (predicted 0) (Figure 2B); p values < 10−4 for all cases. In total, we enumerated 30 miRNAs targeting at least 5 cyclins/ CDKs and 14 miRNAs targeting at least 6 cyclins/CDKs (Figures 2A, 2B, and Table S1). In contrast, the number of miRNAs uniquely targeting individual cyclins or CDKs was not higher than predicted from random permutations (Figure S3I).
Also pair-wise comparisons of all screening data revealed that miRNAs targeting one cell cycle protein were highly enriched for targeting other cell cycle proteins (Figure 2C). Collectively, these analyses revealed that the mammalian genome contains a previously unanticipated class of miRNAs that target multiple components of the core cell cycle machinery. We called these miRNAs “cell cycle-targeting miRNAs”.
In order to provide a quantitative measure of the ability of miRNAs to repress the cell cycle machinery, for each miRNA we calculated the average repression value across the nine screens. Using this criterion, sixteen miRNAs repressed all nine 3′UTRs by an average of 40% or more, while 60 miRNAs showed at least average 30% repression across the nine screens (Table S1).
We next asked whether cell cycle-targeting miRNAs might also target the other three major cyclins that were not included into our screens, namely cyclins A2, B1, and B2. To address this point, we generated U2OS reporter cell lines stably expressing luciferase constructs containing 3′UTRs of cyclins A2, B1, or B2, and tested their response to ten randomly selected cell cycle-targeting miRNAs. We found that several cell cycle-targeting miRNAs repressed the expression of cyclin A2, B1 and B2 reporter constructs. In contrast, ten randomly selected control, non-cell cycle-targeting miRNAs had essentially no effect (Figures 2D–2F). We also determined that cell cycle-targeting miRNAs were not enriched in targeting other pro-proliferative pathways, beside cyclins and CDKs (Table S2). We
concluded that the mammalian genome expresses a distinct class of miRNAs that can regulate expression of up to 12 major cyclins and CDKs.
Computational Analyses of Cell Cycle-Targeting miRNAs
Using data from The Cancer Genome Atlas (TCGA), we analyzed the expression of cell cycle-targeting miRNAs across 4807 human tumor samples representing 18 tumor types. We searched for correlation/anti-correlation between the expression of miRNAs and the levels of transcripts encoding cyclins and CDKs. We found that miR-195-5p showed the strongest anti-correlation with expression of transcripts encoding cyclins E1, E2, CDK1, CDK2 and CDK4, and also displayed a strong anti-correlation with expression of cyclins D1, D2, D3
A
uthor Man
uscr
ipt
A
uthor Man
uscr
ipt
A
uthor Man
uscr
ipt
A
uthor Man
uscr
ipt
and CDK6 (Table S3), suggesting that it might play a role in regulating the levels of these proteins in cancer cells.
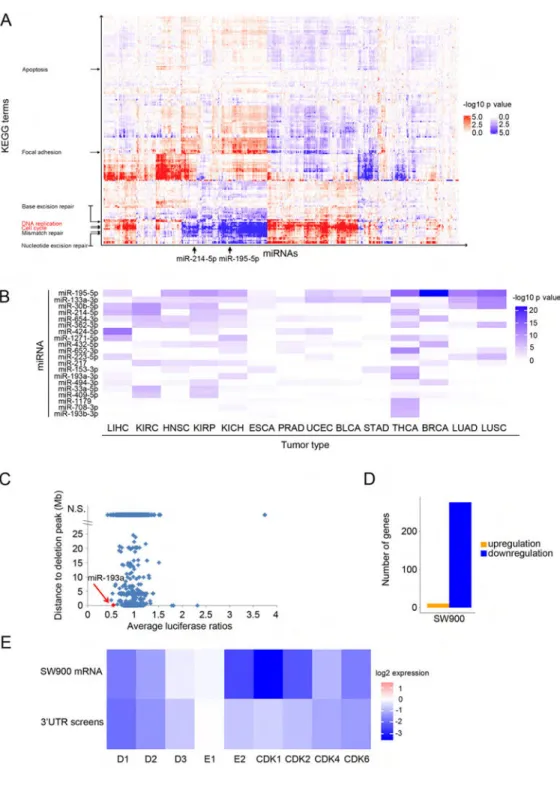
We also searched for correlation/anti-correlation between expression of all miRNAs and expression of all protein-coding transcripts in 4807 human tumor samples. The correlating transcripts were then analyzed for enrichment in KEGG pathway categories. This “guilt-by-association” analysis revealed that expression of some cell cycle-targeting miRNAs, such as miR-195-5p and miR-214-5p strongly anti-correlated with expression of genes belonging to cell cycle and DNA replication pathways (Figure 3A).
We hypothesized that cell cycle-targeting miRNAs, through their virtue of repressing the cell cycle machinery, might display growth-suppressive properties. Consequently, we predicted that expression of some of these miRNAs might be silenced during tumorigenesis. To test this prediction, we used the TCGA database to compare the expression of all cell cycle-targeting miRNAs in 14 types of human tumors versus adjacent healthy tissue from the same patient. We found that of all miRNAs, miR-195-5p was most significantly downregulated in 11 of 14 tumor types (Figure 3B, p values from 1.77 × 10⁻¹² to 0.011 for significant downregulation, Wilcoxon test).
In addition, we intersected the results of our nine screens with the TCGA registry of deleted regions across many human tumor types and searched for cell cycle-targeting miRNAs that are commonly deleted in human cancers (Figure 3C). These analyses revealed that the miR-193a gene, which encodes one of most potent cell cycle-regulating miRNAs, miR-193a-3p, is frequently deleted in several types of human tumors. We also identified numerous cell lines displaying copy number deletions of miR-193a (Figure S4A). Among them, a lung squamous cell carcinoma cell line SW900 harbors a very narrow, focal homozygous deletion encompassing the miR-193a gene (Figures S4A and S4B).
To test the response of SW900 cells to re-introduction of the deleted miRNA, we transfected double-stranded mimic of miR-193a into SW900 cells and harvested cells for RNA
sequencing. Consistent with the well-established repressive effect of miRNAs on gene expression, nearly all transcripts that were affected by re-introduction of miR-193a displayed reduced levels (Figure 3D). Strikingly, the repressed targets were strongly enriched in the cell cycle category and included cyclins and CDKs (Figures 3E and S4C). Consistent with inhibition of the cell cycle machinery, expression of miR-193a extinguished proliferation of SW900 cells (data not shown).
Cell Cycle-Targeting miRNAs Inhibit Proliferation of Cancer Cells
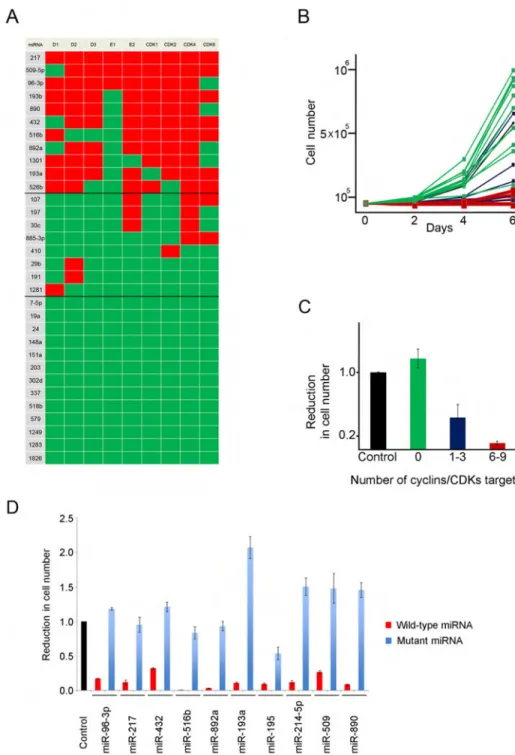
We asked whether other cell cycle-targeting miRNAs might also have an anti-proliferative effect on cancer cells. To test this, we transiently expressed a panel of 11 miRNAs targeting 6 to 9 cyclins/CDKs (Figure 4A) in human osteosarcoma U2OS cells and monitored cell number expansion over 6 days. We found that all 11 cell cycle-targeting miRNAs essentially extinguished proliferation of U2OS cells (Figures 4B and 4C). Importantly point-mutations within miRNA seed sequences abolished the ability of miRNAs to inhibit cell growth, confirming the specificity of the effect (Figure 4D).
A
uthor Man
uscr
ipt
A
uthor Man
uscr
ipt
A
uthor Man
uscr
ipt
A
uthor Man
uscr
ipt
In parallel, we tested 8 miRNAs that target only 1–3 cyclins/CDKs, and 13 miRNAs that do not target any of the tested cell cycle proteins (Figure 4A). miRNAs targeting 1–3 cyclins/ CDKs had only a mild effect on cell growth, while non-cyclin/CDK targeting miRNAs had overall no effect (Figures 4B and 4C). We concluded that cell cycle-targeting miRNAs display strong anti-proliferative properties when ectopically expressed in cancer cells.
Profiling the Response of Human Cancer Cell Lines from CCLE to Cell Cycle-Targeting miRNAs
In order to further investigate the anti-proliferative properties of cell cycle-targeting
miRNAs, we profiled the response of 122 human cancer cell lines from the Cancer Cell Line Encyclopedia (CCLE), representing 12 separate cancer types, to four selected miRNAs. For profiling we chose miR-195-5p, miR-193a-3p and miR-214-5p, which were highlighted above, as well as miR-890, the latter being chosen based on its identification as one of the top hits in our screens (Table S1).
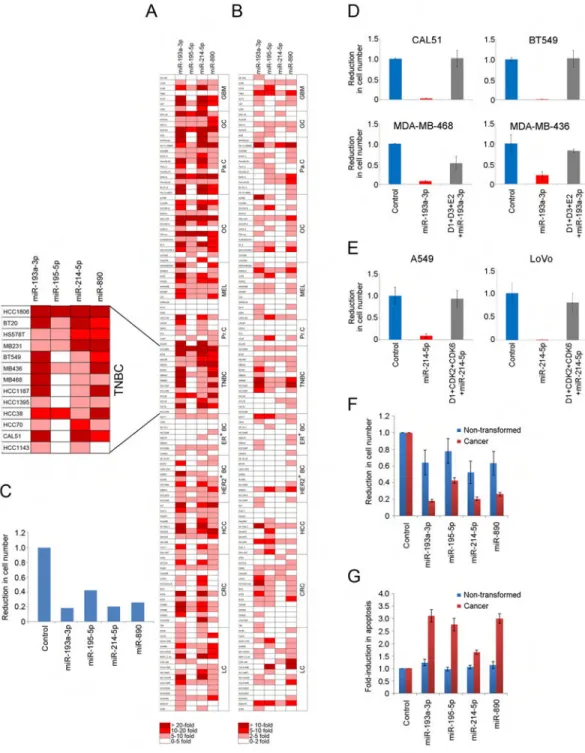
We transiently expressed each of the four miRNAs in 122 cell lines and monitored for reduction in cell number expansion (Figure 5A), induction of apoptosis (Figure 5B), and induction of cellular senescence (Figures S5A). We found that all four miRNAs had a profound and widespread effect on cancer cell proliferation (Figures 5A, 5C, S5B, and Table S4). In several cell lines expression of cell cycle-targeting miRNAs also triggered cancer cell death (Figure 5B and Table S4). None of the cell cycle-targeting miRNAs were found to strongly induce senescence (Figure S5A and Table S4).
Among all cancer types analyzed, cell lines corresponding to gastric and triple-negative breast cancers (TNBC) displayed the strongest response to expression of cell cycle-targeting miRNAs, with miR-193a-3p being the most effective in suppressing cell numbers across all tumor types (Figures 5C and S5B). TNBC underwent a strong, often over 10-fold reduction in cell number expansion, with several TNBC cell lines also displaying a pronounced apoptotic response (Figures 5A, 5B, and Table S4); see Figure S5C for expression of cell cycle proteins in TNBC. Importantly, we verified that ectopic expression of miR-193a-3p in TNBC led to downregulation of predicted cell cycle targets (Figure S5D and S5E).
To test whether the observed effects on cancer cell expansion and apoptosis were mediated via the ability of cell cycle-targeting miRNAs to repress the expression of target cyclins/ CDKs, we engineered four triple-negative breast cancer cell lines to ectopically express cDNAs encoding cyclins D1, D3 and E2 (Figure S5E), which represent targets of
miR-193a-3p (Table S1). Importantly, the three cyclin cDNAs lack 3′UTRs, and hence they are resistant to targeting by miRNAs. In striking contrast to parental cells, where
miR-193a-3p blocked cancer cell growth, cells expressing miRNA-resistant cyclins were refractory to the anti-proliferative effect of miR-193a-3p, or, in case of MDA-MB-468 cells, the anti-proliferative effect was blunted (Figure 5D). Moreover, expression of miRNA-resistant cyclins in four breast cancer cell lines largely prevented induction of apoptosis by miR-193a-3p in vitro (Figure S5F), and prevented apoptosis of tumor cells in vivo (see below). These observations indicate that targeting of cell cycle proteins by miR-193a-3p is responsible for cell cycle arrest and apoptosis of cancer cells.
A
uthor Man
uscr
ipt
A
uthor Man
uscr
ipt
A
uthor Man
uscr
ipt
A
uthor Man
uscr
ipt
We also engineered lung cancer A549 cells and colon cancer LoVo cells to ectopically express cDNAs encoding cyclin D1, CDK2 and CDK6 (Figure S5G), which we found to represent targets of miR-214-5p (Table S1). In contrast to parental cells, where miR-214-5p blocked cell expansion, cancer cells expressing miRNA-resistant cell cycle targets were refractory to the anti-proliferative effect of miR-214-5p (Figure 5E).
Given the observed strong effects of cell cycle-targeting miRNAs on tumor cells, we examined the response of ten human non-transformed cell lines to the four miRNAs. We found that these miRNAs had a much milder effect on growth of non-transformed cells and that they did not trigger apoptosis (Figures 5F and 5G).
Response of Human Breast Cancer Cells to miR-193a-3p Compared to Therapeutic Compounds
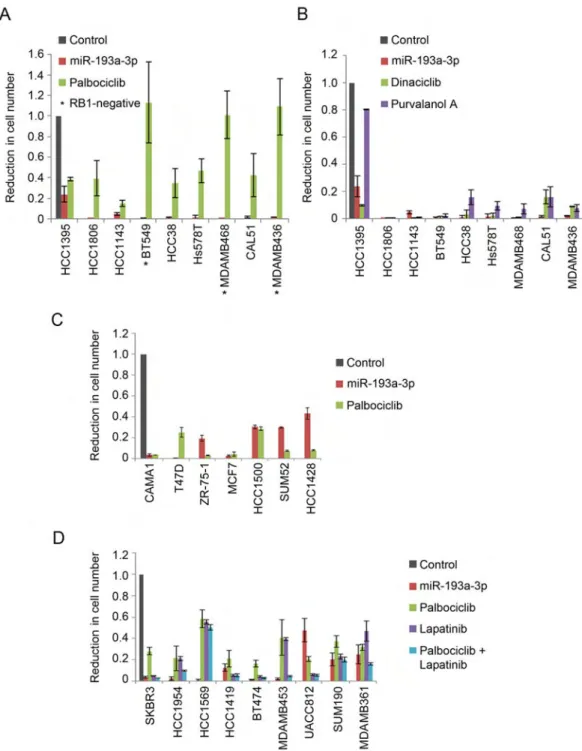
Our CCLE screen demonstrated that TNBC lines are highly sensitive to cell cycle-targeting miRNAs and that miR-193a-3p had overall the strongest anti-tumor effect. In order to further evaluate the therapeutic potential of this miRNA, we compared the response of breast cancer cells to miR-193a-3p expression versus treatment with an inhibitor of CDK4/6 kinase, palbociclib (PD-0332991, Ibrance). Consistent with previous reports (Finn et al., 2009) palbociclib treatment of nine TNBC cell lines had only a very mild effect on cancer cell expansion, and it was totally ineffective in cell lines lacking the functional
retinoblastoma protein, RB1 (Figure 6A). In contrast, ectopic expression of miR-193a-3p dramatically decreased cell numbers in 8 out of 9 TNBC cell lines. Of particular interest, miR-193a-3p was potent against cell lines harboring deletion of the RB1 gene, pointing to the therapeutic potential of this miRNA against RB1-negative tumors (Figure 6A).
Chemical inhibition of CDKs was shown to have a profound effect on TNBC, as this tumor type may be particularly dependent on CDK kinases for cancer cell survival (Horiuchi et al., 2012). We therefore compared the effects in TNBC cells of miR-193a-3p expression versus treatment with CDK inhibitors dinaciclib and purvalanol A, which inhibit CDK1, CDK2 and other cell cycle kinases. We found that miR-193a-3p was generally equally or more potent than each of the two inhibitors (Figure 6B).
In order to explore the effect miR-193a-3p on other types of breast cancers, we compared the response of human estrogen receptor positive (ER+) mammary carcinoma cell lines to miR-193a-3p versus palbociclib, which is currently being used in clinical trials for patients bearing ER+ tumors (Asghar et al., 2015; Finn et al., 2015). We found that miR-193a-3p was quite effective against ER+ breast cancer cell lines, although generally to a lesser extent than palbociclib (Figure 6C).
Lastly, we gauged the impact of miR-193a-3p expression on HER2+ breast cancer cell lines and compared it with the effect of lapatinib. Lapatinib, a dual HER2/EGFR tyrosine kinase inhibitor, is used for treatment of HER2+ breast cancers. We found that miR-193a-3p was equivalent to or superior to lapatinib alone in most cases and often had a comparable impact on cell number expansion to the combined effect of lapatinib plus palbociclib (Figure 6D). Together, these results suggest a therapeutic potential of miR-193a-3p for breast cancers and in particular for triple-negative breast cancers.
A
uthor Man
uscr
ipt
A
uthor Man
uscr
ipt
A
uthor Man
uscr
ipt
A
uthor Man
uscr
ipt
Nanoparticle-Mediated Delivery of miR-193a-3p to Xenografts of Triple-Negative Breast Cancers
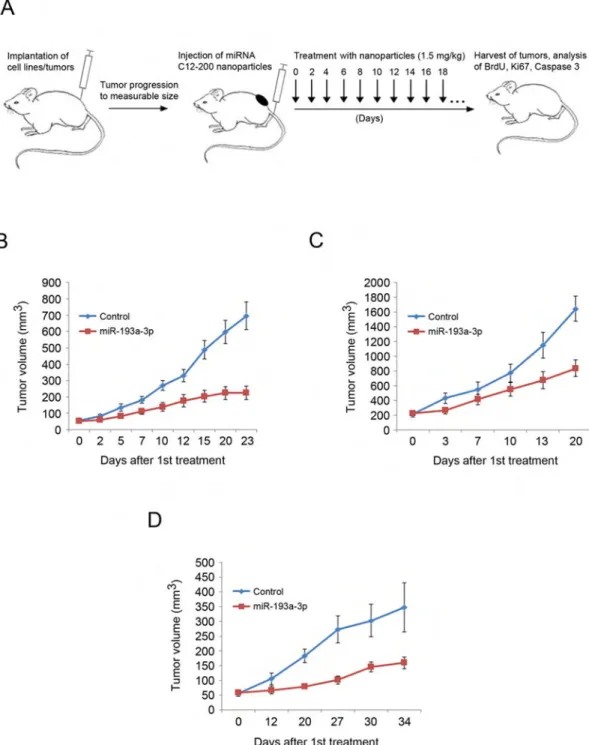
To extend these observations to an in vivo setting, we asked whether a systemic administration of miR-193a-3p to mice bearing xenografts of human TNBC would halt tumor progression. To deliver miR-193a-3p to tumor-bearing mice, we utilized nanoparticles based on epoxide-derived lipidoid C12-200. This type of nanoparticle was shown to avoid immune responses and to improve delivery of large bulky double-stranded nucleic acids to animals in vivo without causing toxicity (Love et al., 2011).
We first subcutaneously injected immunocompromised mice with TNBC CAL51 or
HCC1806 cells leading to formation of tumors (see Figure S6A for the endogenous levels of miR-193a-3p in these tumors). Once the animals developed palpable tumors, we
systematically administered every 2–3 days nanoparticles containing miR-193a-3p or containing miRNA mimic negative control via tail vein injection (Figure 7A). We found that administration of nanoparticles with miR-193a-3p strongly inhibited tumor growth in vivo (Figures 7B and 7C). Analyses of tumors for BrdU uptake, Ki67 staining, and cleaved caspase 3 revealed significant reduction of proliferation and induction of apoptosis in miR-193a-3p-treated mice (Figures S6B–S6G).
To ascertain that the observed in vivo effects were mediated through the ability of
miR-193a-3p to directly target cyclins/CDKs, we generated xenografts using CAL51 cells engineered to express miRNA-resistant cyclins D1, D3 and E2. Strikingly, administration of miR-193a-3p to tumor-bearing animals had essentially no inhibitory effect on tumor growth (Figure S6H). In contrast to xenografts derived from parental CAL51 cells, tumor cells expressing miRNA-resistant cyclins did not show reduced BrdU or Ki67 staining and were protected against miR-193a-3p-induced apoptosis (Figures S6I–S6K).
We further confirmed the anti-tumor effect in vivo using mice bearing orthotopic xenografts of a primary patient-derived triple-negative breast cancer. This tumor was refractory to conventional therapy and had progressed after treatment with doxorubicin and paclitaxel. Administration of miR-193a-3p to mice bearing this highly aggressive tumor strongly inhibited tumor expansion (Figures 7D and S6L–S6N).
Analyses of nanoparticle-treated mice revealed that both normal organs as well as tumors displayed uptake of the exogenous miR-193a-3p (Figure S6O). Given this broad uptake, we tested the impact of long-term administration of miR-193a-3p on normal tissues. We found that continuous systemic administration of nanoparticles containing miR-193a-3p to animals had no effect on proliferation rate in the internal organs (Figures S7A and S7B). Also, no increased apoptosis was detected in the internal organs of treated mice (Figure S7C). This is in contrast to tumor cells in nanoparticle-treated mice, where miR-193a-3p reduced
proliferation and triggered apoptosis (Figures S6B–S6G and S6L–S6N).
We also analyzed the histopathological appearance of internal organs in mice treated long-term with miR-193a-3p-containing nanoparticles and found no abnormalities (Figure S7D and data not shown).
A
uthor Man
uscr
ipt
A
uthor Man
uscr
ipt
A
uthor Man
uscr
ipt
A
uthor Man
uscr
ipt
Lastly, we determined that long-term administration of nanoparticles containing
miR-193a-3p had no obvious effect on biochemical parameters in the peripheral blood of recipient mice (Figure S7E), no obvious effect on liver function (Figure S7F), and no detectable effect on the function of the hematopoietic system (Figures S7G and S7H). Collectively, these analyses indicate that nanoparticle-based delivery of miR-193a-3p may represent an efficient strategy against refractory triple-negative breast cancers in vivo, by selectively targeting cancer cells while sparing normal, non-transformed tissues.
Nanoparticle-Mediated Delivery of miR-214-5p to KRAS-Mutant Cancers
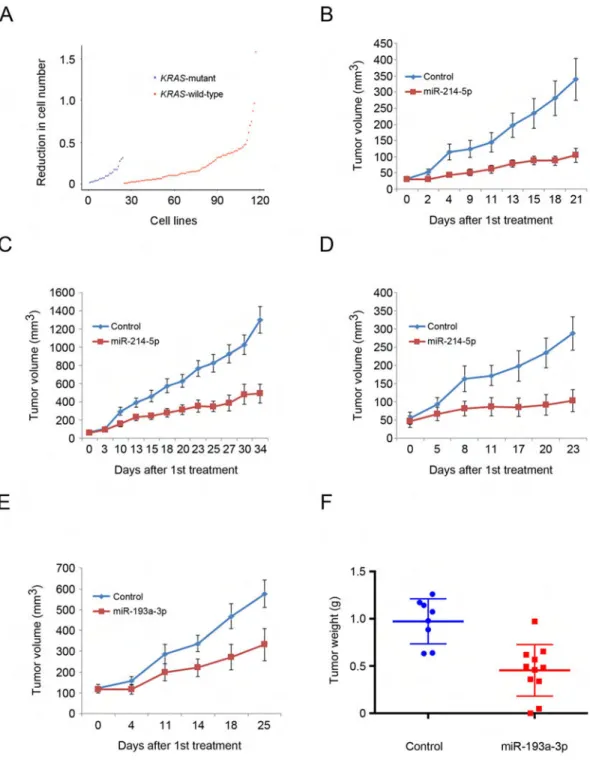
Analyses of the response of 122 human cancer cell lines to the four cell cycle-targeting miRNAs allowed us to correlate the observed response with genetic lesions carried by each of these cell lines, which have been annotated in CCLE. These analyses revealed that miR-214-5p is more potent against cell lines harboring mutations in KRAS than those with wild-type KRAS (p = 0.02 by Wilcoxon test) (Figure 8A).
We validated this finding in vivo using nanoparticle-mediated delivery of miR-214-5p to mice bearing xenografts of human KRAS-mutant lung cancer A549 cells or colon cancer LoVo cells (please see Figure S8A for the levels of miR-214-5p in these tumors). We found that a systemic administration of miR-214-5p inhibited growth of KRAS-mutant tumors in vivo (Figures 8B, 8C, and S8B–S8E).
We extended these observations using mice bearing xenografts of patient-derived metastatic KRAS-mutant colon adenocarcinoma. The primary tumor was refractory to treatments with FOLFOX (folinic acid + fluorouracil + oxaliplatin) and FOLFIRI (folinic acid + 5-fluorouracil + irinotecan) + bevacizumab. Administration of miR-214-5p to mice bearing this very aggressive cancer essentially extinguished tumor growth (Figures 8D, S8F, and S8G).
As was the case for miR-193a-3p, repeated administration of miR-214-5p to mice had no effect on cell proliferation in the internal organs (Figure S7A and S7B). The recipient mice displayed unperturbed histopathological appearance of the internal organs (Figure S7D), and normal blood chemistry, liver function and hematological parameters (Figures S7E–S7H). Collectively, these observations suggest that nanoparticle-based delivery of miR-214-5p might represent an effective therapeutic strategy against KRAS-mutant tumors, including aggressive, refractory cases.
To exclude a possibility that our miRNA anti-tumor effects might have been caused by a non-specific activation of the immune system, we monitored liver expression of a panel of cytokines, two days post-injection of miR-214-5p. We detected no major changes in the cytokine levels, essentially ruling out a non-specific immune response as the underlying mechanism (Figure S8H).
A
uthor Man
uscr
ipt
A
uthor Man
uscr
ipt
A
uthor Man
uscr
ipt
A
uthor Man
uscr
ipt
Expression-Based Algorithm to Predict the Response of Primary Tumors to Cell Cycle-Targeting miRNAs
By correlating gene expression profiles of each of the 122 human cancer cell lines available from CCLE with the response to the four cell cycle-targeting miRNAs, we developed a high-dimensional regression method based on elastic-net (Zou and Hastie, 2005) that predicts the response of cancer cells to each of the miRNAs (Table S5). In order to test whether this algorithm is applicable to primary patient-derived tumors, we analyzed gene expression of an aggressive dermatofibrosarcoma protuberans that was refractory to conventional therapy and progressed despite treatment with imatinib (Gleevec) and PI3K inhibitor pictilisib (GDC-0941). By querying gene expression data with our algorithm, we predicted that this tumor would be responsive to miR-193a-3p (Table S5). To validate this prediction in vivo, we implanted patient-derived primary tumor cells into immunocompromised mice and systematically delivered nanoparticles containing miR-193a-3p. Indeed, administration of miR-193a-3p significantly inhibited tumor growth in vivo (Figures 8E, 8F, and S8I–S8K). These observations suggest that our expression-based algorithm allows one to predict the response of primary tumors to individual miRNAs.
DISCUSSION
A role for miRNAs in the pathogenesis of cancer was suggested shortly after their discovery in humans 16 years ago (Lagos-Quintana et al., 2001). The study of Lu et al. (Lu et al., 2005) revealed that miRNAs are generally downregulated in human cancers, suggesting that many miRNAs might play tumor suppressive roles. Indeed, reduced expression of the let-7 family of miRNAs was associated with clinical progression of lung cancers, while the loss of miR-15/16 was linked to progression in chronic lymphocytic leukemia (CLL) (Calin et al., 2005; Takamizawa et al., 2004). However, very few individual miRNAs have been validated to play tumor suppressive roles using genetic systems. This might seem surprising in the light of numerous reports linking miRNAs to cancer but could be explained by the highly redundant function of these small regulatory RNAs in physiological settings (Bartel, 2009). Several groups proposed to use miRNA overexpression systems as an anti-cancer therapeutic strategy, and this approach led to promising outcomes in vivo (Kota et al., 2009; Liu et al., 2011). In particular, a synthetic miR-34a mimic is currently in clinical trials
(NCT01829971) for treatment of patients with primary liver cancer or with liver metastases. Interestingly, miRNAs used in these in vivo systems have been reported to regulate, among other targets, also cyclins and/or CDKs, highlighting a potential link between successful miRNA mimic therapy and repression of the cell cycle machinery.
To explore this possible therapeutic link, we performed nine genome-wide screens to enumerate miRNAs that directly regulate the cell cycle machinery. We uncovered a class of miRNAs in the human genome, which target all, or nearly all cyclins and CDKs. We showed that these cell cycle-targeting miRNAs effectively inhibit proliferation of a wide array of cancer cell types. We demonstrated that these miRNAs can be systematically administered to animals in the form of nanoparticles where they effectively inhibit proliferation of tumor cells while sparing normal, non-transformed tissues. We extended our studies to patient-derived xenografts of tumors that were refractory to standard treatments and demonstrated
A
uthor Man
uscr
ipt
A
uthor Man
uscr
ipt
A
uthor Man
uscr
ipt
A
uthor Man
uscr
ipt
the efficacy of using cell cycle-targeting miRNAs to target these incurable tumors. Hence, with improved delivery methods to tumor tissues, these miRNAs might offer an effective anti-cancer strategy against deadly, refractory cancer types.
In addition to inducing proliferative arrest, cell cycle-targeting miRNAs also triggered cell death of several cancer cell lines. This observation is in agreement with published reports that inhibition of cell cycle kinases or downregulation of cyclins can trigger tumor cell apoptosis, in addition to cell cycle arrest (Choi et al., 2012; Goga et al., 2007; Horiuchi et al., 2012; Molenaar et al., 2009; Sawai et al., 2012).
It is not clear why ectopic expression of the four cell cycle-targeting miRNAs had the strongest effect on triple-negative breast cancers and gastric cancers. One possible
explanation is that TNBC were shown to be particularly dependent on CDKs for cancer cell survival (Horiuchi et al., 2012). Consistent with this hypothesis, expression of cell cycle-targeting miRNAs triggered apoptosis of TNBC cells in vitro and in vivo, and this response was prevented by ectopic expression of miRNA-resistant cell cycle targets in cancer cells. Our analyses revealed that a higher proportion of KRAS-mutant cancer cell lines was potently inhibited by miR-214-5p, as compared to cancer cells expressing wild-type KRAS. miR-214-5p is not predicted to target KRAS itself, and expression of miRNA-resistant cell cycle targets (cyclin D1, CDK2 and CDK6) prevented the anti-proliferative effect of this miRNA. Of note, high-throughput screens have previously uncovered synthetic lethal interactions between oncogenic KRAS and several CDKs, including CDK1, CDK2 and CDK6 (Barbie et al., 2009). Moreover KRAS-mutant tumors were shown to be more sensitive to CDK inhibition than KRAS-wild-type tumors (Macias et al., 2007; Puyol et al., 2010), which might explain their increased sensitivity to miR-214-5p.
Our observation that cell cycle-targeting miRNAs preferentially affected cancer cells while sparing non-transformed tissues was not unexpected. Several studies demonstrated that cancer cells are particularly dependent on cyclins and CDKs for their proliferation and survival, and hence inhibition of these proteins is predicted to target cancer cells (Campaner et al., 2010; Choi et al., 2012; Puyol et al., 2010). Moreover, expression of miRNAs decreases, but does not fully extinguish, expression of their targets, and such a global dampening of cell cycle machinery is likely to preferentially affect transformed cells. While our studies mostly explored the effects of overexpression of cell cycle-targeting miRNAs, it might be expected that at least some of them normally play growth-suppressive roles when expressed at physiological levels. Consistent with this notion, our analyses revealed that the gene encoding miR-193a-3p is frequently deleted in human cancers. miR-193a-3p was previously proposed to play tumor-suppressive functions by repressing EGFR signaling (Uhlmann et al., 2012), by promoting apoptosis via repression of MCL1 (Kwon et al., 2013; Williams et al., 2015), and by suppressing tumor cell migration and invasion through small GTPase Rab27B (Pu et al., 2016) or ERBB4 and S6K2 (Liang et al., 2015; Yu et al., 2015). The loss of these additional anti-tumor functions of miR-193a-3p may contribute to the neoplastic transformation in cancers harboring deletion of the miR-193a locus.
A
uthor Man
uscr
ipt
A
uthor Man
uscr
ipt
A
uthor Man
uscr
ipt
A
uthor Man
uscr
ipt
Another cell cycle-targeting miRNA highlighted by our study is miR-195-5p. We found that this miRNA might have growth-suppressive properties in vivo, as evidenced by a significant downregulation of miR-195-5p in twelve types of human tumors (Figure 3B). Consistent with our findings, downregulation of miR-195-5p was previously reported in human breast and colorectal cancers (Chen et al., 2015; Luo et al., 2014; Luo et al., 2016).
By correlating gene expression profiles of human cancer cell lines versus the responses to individual miRNA, we generated an expression-based algorithm that can predict the
response of a particular primary tumor to a given miRNA. In the future, this approach can be extended to examine the effect of all miRNAs. By applying similar algorithms to the one described in our study, one will be able to identify a miRNA, or a combination thereof, that would be particularly potent against a given individual human tumor. This approach might lead to highly individualized miRNA-based anti-cancer therapies.
STAR METHODS
CONTACT FOR REAGENT AND RESOURCE SHARING
Further information and requests for resources and reagents should be directed to and will be fulfilled by the Lead Contact Piotr Sicinski (Peter_Sicinski@dfci.harvard.edu).
EXPERIMENTAL MODEL AND SUBJECT DETAILS
Animals—For the in vivo animal studies presented here, we used NCRNU or NOG female mice (Mus musculus) (Taconic). 1×10⁶ of CAL51, HCC1806, A549 and LoVo cells (1:1
mixture with Matrigel) were injected subcutaneously into flanks of NCRNU mice (Taconic). For patient-derived xenografts, fresh human cancer specimens were received from Brigham and Women’s Hospital after signed consent was previously obtained from patients
undergoing surgery, according to a research protocol approved by the Dana-Farber/Harvard Cancer Center (DF/HCC) Institutional Review Board-approved. Fragments of the cancer specimens (2×2×2 mm) were implanted orthotopically (into the mammary fat pad, for TNBC) into female NOG mice (Taconic) or subcutaneously into the flanks of female NCRNU mice (Taconic), and were serially passaged as subcutaneous implants of tumor fragments. Dermatofibrosarcoma protuberans tumor specimens were digested with collagenase type 2 (Fisher Scientific); cells were cultured in DMEM/F12 and injected subcutaneously (1×10⁶ cells) into flanks of female NCRNU mice (Taconic). All animals were held in the same animal room in Individually Ventilated Cages (IVCs) with a 12-hr day/night cycle. All procedures were carried out according to protocols approved by the Institutional Animal Care and Use Committee of the Dana-Farber Cancer Institute.
Cell Lines—Cell culture media used for each cell line is indicated in Table S6.
Cell Line Authentication—Genomic DNA was extracted from 30 cell lines that were used for detailed analyses in our study, including the three cell lines used for screening, 25 breast cancer cell lines analyzed in Figure 6, as well as 4 cell lines used for xenograft experiments. Short Tandem Repeat (STR) profiling was performed by the Dana-Farber Cancer Institute Molecular Biology Core. The profiles were overlaid with publicly
A
uthor Man
uscr
ipt
A
uthor Man
uscr
ipt
A
uthor Man
uscr
ipt
A
uthor Man
uscr
ipt
accessible STR cell line data deposited to NCBI to verify the correct identity of these cell lines.
METHOD DETAILS
3′UTR Cloning Strategy and miR-193a PCR—The longest annotated 3′UTRs (according to TargetScan Human, Release 5.2) of the following genes: CCNA2, CCNB1, CCNB2, CCND1, CCND2, CCND3, CCNE1, CCNE2, CDK1, CDK2, CDK4, CDK6, were PCR-amplified from healthy human genomic DNA (Promega) using restriction-site flanking primers. Amplified 3′UTRs were digested with restriction enzymes and cloned into the pmirGLO basic vector (Promega). The CDK6 3′UTR was amplified in two separate fragments; the C-terminal fragment was digested and cloned into pmirGLO-vector using the XhoI/SbfI sites. For cloning of N-terminal CDK6 3′UTR fragment, an XmaI-site was introduced into pmirGLO using QuikChange XL site-directed mutagenesis kit (Agilent) followed by digestion with XmaI/XhoI. All primers, including primers used for
amplification of miR-193a from healthy genomic DNA (Promega) of SW900 cells, are listed in Table S6.
Screening of miRNA Library—3′UTRs-pmirGLO constructs containing 3′UTRs of cyclins or CDKs were transfected into U2OS cells. 48 hr post-transfection, cells were selected with G418 until emergence of stable clones. 20 cell clones were tested for each cyclin/CDK 3′UTR and validated by Z’ tests using reverse transfection of miRNA mimics (Ambion) predicted by TargetScan to target a given 3′UTR, as well as using reverse transfection of Negative control #2 (Ambion). For each clone, the positive and negative controls were assayed in three 96-well plates each; clones were examined for expression of full-length 3′UTR, expression of firefly and renilla luciferase, and consistent reduction of the firefly/renilla ratio by a positive control. Clones that fulfilled these criteria were selected for screening.
For screening, cells were seeded in 96-well plates, 15,000 cells per well, and transfected (one miR per well, in three replicates) with human mimic pre-miR miRNA library (Ambion) containing 885 miRNAs, using Lipofectamine RNAiMAX (Invitrogen) reverse transfection. Firefly to renilla luciferase ratios were determined 28 hr post-transfection using 96-well luminometer from Turner Biosystems. Replicates of each miRNA were separated on three plates with each plate containing two replicates of negative control miRNA. Finally, firefly to renilla luciferase ratio of each miRNA was normalized to six replicates of negative control miRNA (see Table S1).
For re-screening of CAL51 and A549 cells with 20 miRNA mimics (Ambion), 3 ′UTRs-pmirGLO constructs were transfected into CAL51 and A549 cells, and selected as in U2OS cells. 8 cell clones were tested for each cyclin/CDK 3′UTR and for each cell line, validated and screened as in U2OS cells.
miRNAs were defined as targeting a given cyclin or CDK if they reduced the firefly to renilla luciferase ratio by at least 40%. In total, we enumerated 30 miRNAs targeting at least 5 cyclins/CDKs and 14 miRNAs targeting at least 6 cyclins/CDKs (Figures 2A–2C, 4A, S2A and Table S1).
A
uthor Man
uscr
ipt
A
uthor Man
uscr
ipt
A
uthor Man
uscr
ipt
A
uthor Man
uscr
ipt
In order to provide a quantitative measure of the ability of miRNAs to repress the cell cycle machinery, we also used another criterion to evaluate targeting of cyclins and CDKs. For each miRNA we calculated the average repression value across the nine screens. Seventeen miRNAs repressed all nine 3′UTRs by an average of 40% or more, while 61 miRNAs showed at least an average of 30% repression across the nine screens (please see last sheet in Table S1). The latter group of miRNAs was used for analyses shown in Figure 3B and Tables S2 and S3.
Mutant miRNA Mimics, Mutant Cyclin/CDK 3′UTRs—Mutant miRNA mimics were synthesized by Integrated DNA Technologies by switching either a purine to a pyrimidine in position 2 of the seed sequence, or switching a pyrimidine to a purine in position 2 of the seed sequence. Mutations of cyclin/CDK 3′UTRs were performed using Agilent XL Mutagenesis kit, by replacing six nucleotides of miRNA target sequences with an XhoI site (CTCGAG). Mutant cyclin E1 3′UTR was synthesized by Integrated DNA Technologies with flanking XhoI/XbaI restriction site sequences enabling sticky-end cloning into the pmirGLO vector. The minimal miRNA target sequence (6 nucleotides) in the cyclin E1 3′UTR was deleted (i.e., omitted during synthesis of the cyclin E1-mutant 3′UTR). Cell growth and luciferase assays were performed as for wild-type miRNAs and wild-type cyclin/CDK 3′UTRs. Mutant 3′UTRs were transfected into U2OS cells, selected with G418 until emergence of stable clones, and validated as described above for U2OS screening clones.
Cells Expressing miRNA-Resistant Cyclin/CDKs—TNBC cell lines CAL51, BT549, MDA-MB-436, and MDA-MB-468, as well as KRAS-mutant lines A549 and LoVo were used for analyses. For CAL51 cells, pCMV-cyclin D1, pCMV-cyclin D3, and pCMV-cyclin E2 were transfected, followed by G418 selection until emergence of resistant clones. Clones were screened for physiological levels of ectopically expressed cyclins by RT-qPCR and used for cell expansion and cleaved caspase 3 assays as described for parental cells. BT549, MDA-MB-436 and MDA-MB468 were transiently transfected using Lipofectamine 2000 (Invitrogen) with pCMV-cyclin D1, pCMV-cyclin D3, and pCMV-cyclin E2 (1 ng each). 24 hr post transfection, cells were transfected with miR-193a-3p using RNAiMAX (Invitrogen). For A549 and LoVo cells, pCMV-cyclin D1 and pCAG-CDK2-CDK6 (1ng each) were transiently transfected using Lipofectamine 2000 (Invitrogen) reagent. 24 hr post
transfection, cells were transfected with miR-214-5p using RNAiMAX (Invitrogen). For all experiments involving transient cyclin/CDK expression, 100,000 cells were seeded 24 hr prior DNA transfection. Cell number expansion and cleaved caspase 3 assays were performed as for parental cells.
Cell Cycle Synchronization—U2OS, CAL51 and A549 cells were synchronized at the G1/S border by double thymidine block. Thymidine was added at 2 mM concentration for 16 hr, replaced by thymidine-free medium for 10 hr, and then added for an additional 14 hr before release of cells. Cells were collected 4, 8, 12, and 15 hr after the release.
Apoptosis and Senescence Assays—Apoptosis was gauged 24 hr post-transfection using cleaved caspase 3 assays (Caspase-Glo, Promega) according to manufacturer’s
A
uthor Man
uscr
ipt
A
uthor Man
uscr
ipt
A
uthor Man
uscr
ipt
A
uthor Man
uscr
ipt
instructions. Senescence was monitored through staining for senescence-associated beta-galactosidase (SA-β-gal), 6 days post-transfection; 100 cells were counted in randomly chosen fields of three biological replicates.
Analyses of Cultured Cancer Cell Lines—For cell proliferation analyses shown in Figure 4, 100,000 U2OS cells were transfected with the indicated miRNAs or with control miRNA (negative control #2, Ambion), each 25 nM, in triplicates. 24 hr post-transfection, cells were re-plated into 6-well plates (15,000 cells per well), and absolute cell numbers were determined every 2 days. For assays shown in Figures 6A and 6B, triple-negative breast cancer cell lines were seeded at 15,000 cells per well in 6-well plates in three
replicates for each treatment. The following day, palbociclib (1 μM, Medchem Express, NJ), dinaciclib (10 nM, ChemieTek) purvalanol A (10 μM, Sigma-Aldrich), or DMSO were added. Drug-containing medium was changed at day 3, and the experiment was terminated at day 6. For miR-193a-3p expression, 100,000 cells were transfected with 25 nM
miR-193a-3p or 25nM miRNA mimic control (Ambion, Negative control #2) in triplicates. 24 hr post-transfection, 15,000 cells were re-plated (day 0) and harvested at day 6.
ER+ breast cancer cell lines (Figure 6C) were plated as above, treated with palbociclib (1 uM) or transfected with 25 nM miR-193a-3p, and harvested at day 6.
HER2+ breast cancer cell lines (Figure 6D) were plated as above and treated with palbociclib or lapatinib (Haoyuan Chemexpress) alone (each 1 μM), a combination of palbociclib plus lapatinib, or transfected with 25 nM miR-193a-3p. Cell numbers were determined after 6 days.
The data were presented as follows. We determined the absolute number of cells at day 6 in drug-treated and DMSO-treated cells, as well as in miR-193a-3p-transfected and control miRNA-transfected cells. By dividing the cell number in experimentally treated (drugs, miR-193a-3p) versus control-treated cells, we calculated the inhibitory effect on cell number expansion, shown as fold-reduction in cell number (in Figure 6).
CCLE Cell Line Screen—Cells were transfected with mirVana miRNA mimic miR-193a-3p, miR-195-5p, miR-214-5p, miR-890, or with control miRNA (Negative control #2, Ambion), all at 25 nM, and either re-plated 24 hr post-transfection or left unperturbed, depending on cell growth rates. All cell lines were plated at a fixed cell number prior to transfection and, if re-plated, 24 hr post-transfection. For cell number expansion assays, experiments were terminated 6 days post miRNA transfection and cells were counted using a Beckman Coulter Z series dual threshold analyzer. All cell lines used in CCLE screen were assayed using a minimum of three biological replicates.
The data were presented as follows. For cell number expansion (Figure 5A), we determined cell numbers at day 6 post-transfection in cells transfected with a given cell cycle-targeting miRNA, as well as in cells transfected with a negative control. The fold-reduction of cell expansion was then calculated by dividing cell number in cells transfected with control miRNA by cell number in cells transfected with cell cycle-targeting miRNA.
A
uthor Man
uscr
ipt
A
uthor Man
uscr
ipt
A
uthor Man
uscr
ipt
A
uthor Man
uscr
ipt
For induction of apoptosis (Figure 5B), cleaved caspase 3 assays (Casp-Glo, Promega) were performed 24 hr after transfection. The values observed in cells expressing a given cell cycle-targeting miRNA were divided by values seen in cells transfected with control miRNA, and fold-increase was calculated and presented.
For induction of senescence, cells were stained for senescence-associated beta-galactosidase (SA-β-gal), according to manufacturer instructions (Biovision), at 6 days post-transfection. 100 cells in 3 different fields of view were counted and fold-increase was calculated and presented in Figure S5A.
Non-transformed cell lines were transfected, treated and assayed as for CCLE cell line screen.
Western blotting—For Western blot analysis, the following dilutions were used for the primary antibodies (see also Key Resources Table): cyclin D1 (1:5000), cyclin D3 (1:1000), cyclin E1 (1:1000), cyclin E2 (1:1000), cyclin A2 (1:5000), cyclin B1 (1:500), CDK1 (1:500), CDK2 (1:1000), CDK4 (1:1000), CDK6 (1:500), GAPDH (1:2500), and beta-actin (1:10000).
miRNA Transfection and miRNA qPCR—Pre-miR miRNA mimic (Ambion) or mirVana miRNA mimic (Ambion) were transfected using Lipofectamine RNAiMAX (Invitrogen; standard forward transfection) with a final miRNA concentration of 25 nM. Total RNA and miRNA were isolated using mirVana miRNA extraction kit (Ambion). miRNA stem loop RT-qPCR was performed using mirVana miRNA assays (Ambion) according to manufacturer’s instructions, normalized to U6-snRNA (as internal small RNA control).
RT-qPCR Analysis—RT-qPCR analysis was performed using the delta-delta-Ct-method with GAPDH as a reference gene. Reverse transcription was carried out using high-capacity RNA-to-cDNA kit with random primers, and qPCR with SYBR green master mix (Applied Biosystems). Analysis was performed using the Applied Biosystems 7300 Real-Time PCR System.
Flow Cytometry Analysis—For analyses of cell lines, cells were pulsed with BrdU for 1 hr, stained with anti-BrdU antibody conjugated to fluorescein isothiocyanate (FITC) (BrdU flow kit, BD Biosciences), according to manufacturer’s instructions, and with propidium iodide, and analyzed by FACS. Data acquisition was performed on LSRII, Fortessa, or Facscan, and analyzed using Cell Quest and FACSDiva software (BD Biosciences).
Formulation of miRNAs into Nanoparticles—In vivo ready miR-193a-3p,
miR-214-5p and mirVana miRNA mimic Negative control #1 were purchased from Ambion and formulated into C12-200 nanoparticles. miRNA mimics were encapsulated in C12-200 lipid nanoparticles using a similar method as previously described for siRNA encapsulation (Love et al., 2010). Briefly, nanoparticles were synthesized by mixing together an ethanol phase containing the ionizable lipidoid C12-200,
1,2-distearoyl-sn-glycero-3-phosphocholine (DSPC), cholesterol, and
1,2-dimyristoyl-sn-glycero-3-A
uthor Man
uscr
ipt
A
uthor Man
uscr
ipt
A
uthor Man
uscr
ipt
A
uthor Man
uscr
ipt
phosphoethanolamine-N [methoxy(polyethylene glycol) – 2000] (ammonium salt) (C14- PEG 2000) at a 50:10:38.5:1.5 molar ratio with an aqueous phase containing mimic in citrate buffer (pH 3.0) at a 5:1 C12-200:mimic weight ratio. Ethanol and aqueous phases were mixed at a 1:3 volume ratio in a microfluidic chip device.
C12-200 lipid nanoparticles had an average mimic encapsulation efficiency of 70–80%, determined by a modified Quant-iT Ribogreen RNA assay. The nanoparticles had an average intensity diameter of approximately 130 nm and polydispersity (PDI) between 0.1 and 0.2. Size and PDI were measured using dynamic light scattering (ZetaPALS, Brookhaven Instruments).
Nanoparticle-Mediated Delivery of miRNAs—Mice with palpable tumors were injected via the tail vein with C12-200-miRNA-formulated nanoparticles (1.5 mg/kg of body weight) in a total volume of 200 μL, every other day, until tumors in control group reached 20 mm in any direction. The dose and dosing schema were selected based on prior published work from the Anderson laboratory (Love et al., 2010).
Tumors were measured by caliper every other day. Four hr before sacrifice, mice were injected intraperitoneally with 2 mg of BrdU. A total of 179 mice were used for in vivo analyses: 93 tumor-bearing mice were treated with nanoparticles containing miR-193a-3p or miR-214-5p and 86 mice with control nanoparticles.
Analyses of miRNA Uptake In Vivo—Organs and tumors were dissected from animals treated with nanoparticles containing control miRNA (Ambion, Negative control #1), miR-193a-3p, or miR-214-5p, at the end of treatment period (20–34 days). RNA was extracted using mirVana miRNA extraction kit (Ambion). miRNA stem loop RT-qPCR was performed using mirVana miRNA assays (Ambion) according to manufacturer’s instruction, with U6-snRNA as internal small RNA control. In each organ or tumor, we determined the delta-Ct values relative to U6-snRNA. Delta-Ct values were then transformed into
percentage expression relative to U6-snRNA. For example, an organ displaying a Ct value of 20 for miR-193a-3p and a Ct value of 18 for U6-snRNA has the delta-Ct value of 2, which is transformed into a percentage expression relative to U6-snRNA of 25 %.
Analyses of Liver Cytokine mRNA Levels—RNA was extracted from livers of mice treated with nanoparticles containing control miRNA (Ambion, Negative control #1) or miR-214-5p, and transcript levels for the indicated cytokines (Figure S8B) levels were measured using the delta-delta-Ct method with GAPDH as a reference gene.
Embedding, Sectioning and Staining—Tumors were fixed in 10% neutral-buffered formalin for 36 hr, followed by transfer to 70% ethanol. The Rodent Histopathology Core at Harvard Medical School carried out paraffin embedding, sectioning, and staining with hematoxylin and eosin. The Brigham and Women’s Hospital Specialized Histopathology Core performed staining for BrdU, Ki67 and cleaved caspase 3. Tumors and normal organs from a minimum of three mice were analyzed per treatment group. Each tumor and normal organ was analyzed for histology (hematoxylin and eosin staining) as well as for BrdU,
A
uthor Man
uscr
ipt
A
uthor Man
uscr
ipt
A
uthor Man
uscr
ipt
A
uthor Man
uscr
ipt
Ki67, and cleaved caspase 3 staining. Each mouse received a minimum of ten miRNA nanoparticle doses (1.5mg/kg per dose).
Hematological Analyses—Mice were treated with nanoparticles containing control miRNA (Negative control #1, Ambion), miR-193a-3p, or miR-214-5p for 17 days. Six mice per group were analyzed together with an untreated group (also n=6). Blood was collected by cardiac puncture, divided into samples for whole blood count analysis (using BD Microtainer tubes with K2-EDTA) and for blood serum analysis (using BD Microtainer serum separator tubes), and analyzed by Department of Laboratory Medicine of the Boston Children’s Hospital.
Computational Analyses
TargetScan context+ score analysis: TargetScan Human Release 6.2 was used. All
miRNAs used in our screen were analyzed for predicted targeting of the cyclin D1 3′UTR using predicted context+ scores.
Target prediction by multiple programs: Besides TargetScan, prediction programs
miRanda, miRDB, miRWalk, and TargetSpy were used to predict targeting of cyclin D1 3′UTR (Figures S1C, S1D). In Figure S1E, these algorithms were used to predict targeting of the indicated seven cyclin/CDK 3′UTRs. CDK1 and CDK4 were excluded from the analyses due to their short 3′UTRs (<500 nt). For combined prediction of TargetScan and miRanda, miRNAs that were predicted to target the indicated gene by both TargetScan and miRanda algorithms were considered as targeting miRNAs. The screen ratios of “predicted targeting” versus “predicted non-targeting” groups were compared using t-test; the p values are shown in Figure S1E.
Hierarchical clustering: Hierarchical clustering was applied to both cyclins/CDKs and
miRNAs. The distance between each gene/miRNA was computed as Euclidean distance and the linkage option was complete linkage.
Permutation analysis: For each permuted screening assay, screening scores were randomly
permuted and assigned to miRNAs. We performed 10,000 random permutations and calculated the numbers of miRNAs targeting multiple cyclins/CDKs in each permutation. For example, we observed in total 7 miRNAs targeting 7 cyclins/CDKs in all 10,000 permutations, so we estimated that 0.0007 (7/10,000) miRNAs would target 7 cyclins/CDKs by chance. Figure 2B shows the mean and standard error from 10,000 permutations. The permutation p value was estimated as the proportion of permutations in which the number of miRNAs targeting multiple cyclins/CDKs is equal to or greater than the observed number. In the same way, we calculated the number of miRNAs exclusively targeting each cyclin or CDK from 10,000 permutations (Figure S2G). The permutation p value was estimated as the proportion of permutations in which the number of miRNAs exclusively targeting this gene is equal to or greater than the observed number.
A
uthor Man
uscr
ipt
A
uthor Man
uscr
ipt
A
uthor Man
uscr
ipt
A
uthor Man
uscr
ipt
Pairwise comparison: For each pair of cyclins/CDKs, we determined the targeting miRNAs
by a threshold of 40% repression. Then, a contingency table was constructed based on the threshold, and Fisher’s exact test was applied to the table to obtain the p value.
Guilt-by-association analysis: For each miRNA used in the screens, the Spearman
correlation between the levels of this miRNA and the levels of all transcripts were computed across 4,807 human tumor samples representing 18 tumor types. Then, the genes were ranked based on the correlations. The GSEA analysis was used to calculate the p values of the ranked gene list’s enrichment in KEGG pathways. For enrichment among highly correlated genes, we marked the corresponding miRNA-pathway blocks in red, and for enrichment among highly anti-correlated genes, we marked the blocks in blue. p values were calculated by hypergeometric test. Hypergeometric test uses the hypergeometric distribution to calculate the statistical significance of having drawn a specific k successes (out of n total draws) from the aforementioned population. The test is used to identify which
sub-populations are over- or under-represented in a sample.
miRNA anti-correlation with cyclin/CDK mRNA: To integrate anti-correlations between
miRNA and cyclins/CDKs in 18 cancer types, a MDS (multiple-dimensional scaling) method was used. At first, for each cancer type, expression data for miRNAs and cyclins/ CDKs was merged. Then the distance between a miRNA and a gene was calculated for MDS as 1 + correlation, so stronger negative correlation was associated with closer distance. The miRNAs were ranked based on weighted sum of the distances to a cyclin/CDK gene across all cancer types, where the weights were the ratio between a cancer type’s sample number and the total sample number. The expression data (RNAseqV2 data) were obtained from TCGA. For analysis, we used miRNAs, which showed mean repression level greater than 30% across the nine screens. Cancer types included in this study were BLCA, BRCA, CESC, COAD, HNSC, KICH, KIRC, KIRP, LIHC, LUAD, LUSC, PAAD, PRAD, READ, SARC, SKCM, THCA, and UCEC. CESC, cervical squamous cell carcinoma and
endocervical adenocarcinoma; COAD, colon adenocarcinoma; PAAD, pancreatic
adenocarcinoma; READ, rectal adenocarcinoma; SARC, sarcoma; SKCM, skin cutaneous melanoma. For other tumor types, please see legend to Figure 3B.
Analysis of miRNA downregulation in tumors: miRNAs expression levels were compared
between normal and tumor samples for 14 cancer types. Comparison was based on
Wilcoxon test. For analysis, we used miRNAs, which showed mean repression level greater than 30% across the nine screens (Table S1).
KEGG pathway analysis: For analysis, we used miRNAs, which showed mean repression
level greater than 30% across the nine screens (Table S1). Among these, we were able to predict targets using TargetScan for 47 miRNAs corresponding to 40 families. We also used TargetScan to predict targets of 200 randomly selected other miRNAs. The targets of each miRNA were then analyzed for KEGG pathways enrichment. For each pathway, the numbers of miRNAs whose targets were enriched in this pathway were counted for 40 cell cycle-targeting miRNAs and for 200 other miRNAs, and the ratios were compared using Fisher’s exact test. The proliferative pathways are marked in yellow in Table S2.
A
uthor Man
uscr
ipt
A
uthor Man
uscr
ipt
A
uthor Man
uscr
ipt
A
uthor Man
uscr
ipt
TCGA Copy Number Analysis of miRNAs: For miRNA copy number analysis, miRNAs
were analyzed by GISTIC, available through the Broad Institute TCGA copy number portal. Data was filtered for Q-values less than 0.25. To search for cell cycle-targeting miRNAs that are commonly deleted in human cancers, for each miRNA we plotted the distance between the locus encoding this miRNA to the nearest deletion peak versus the effect of this miRNA across the nine cyclin/CDK-luciferase screens (Figure 3C).
Gene Expression Array, RNA Sequencing: A fresh dermatofibrosarcoma tumor was
homogenized and total RNA isolated using Ambion mirVana miRNA isolation kit (without enrichment for small RNAs). Total RNA was hybridized on Affymetrix GeneChip Human Genome U133 Plus 2.0 Array, in three technical replicates. Raw intensity files were analyzed using the R packages Affy and limma, and the Bioconductor software. For RNA sequencing, 100,000 SW900 cells were transfected with 25 nM of miR-193a-3p mimic or 25 nM of negative miRNA control (Negative control #2, Ambion). 48 hr post-transfection, total RNA was isolated using Ambion mirVana miRNA isolation kit without enrichment for small RNAs. RNA was sequenced on an Illumina Hiseq2000 at the Center for Cancer
Computational Biology at the Dana-Farber Cancer Institute.
Cell line mutational status correlation: Cell lines’ mutation statuses were obtained from
CCLE. For each gene’s mutation, cell lines were divided into wild-type and mutant groups. The response to miRNA expression (fold-decrease in cell number expansion) was compared between the two groups using Wilcoxon test.
Derivation of an expression-based algorithm: An elastic net regression model was used to
predict cell lines response to miRNA expression (see: Table S5 for prediction results). The model’s predictors were cell lines expression data (scaled to make each gene have mean expression level 0 and standard deviation 1) and the response was cell lines response to miRNA (day 6 cell number in control group / cell number in treated group). For a total of 117 cell lines, 90 cell lines were randomly picked as a training set. In the training set, correlation coefficients between each gene’s expression level and cell lines’ response to miRNA expression were calculated and only the genes with absolute correlation coefficient greater than 0.1 were retained for regression. We ran 200 times bootstrap and applied elastic net model to the resampled data. Each time only a small fraction of genes had significant coefficients and were retained in the model. Then we counted the times a gene was retained and choose the most frequently (more than 35%) retained genes as features. Finally, a 10-fold cross-validation was applied to choose regularization parameters and the final model was fitted using the whole data set before predicting new samples.
QUANTIFICATION AND STATISTICAL ANALYSIS
Quantification of IHC staining—Quantification of IHC staining was performed in a blinded fashion for all experiments. The fraction of cells stained for Ki67, BrdU, or cleaved caspase 3 was determined by manual counting of histological sections stained with the respective antibodies.