Cardiovascular Activity Monitoring Using mmWaves
by
Salah Assana
Submitted to the Program in Media Arts and Sciences
in partial fulfillment of the requirements for the degree of
Master of Science
at the
MASSACHUSETTS INSTITUTE OF TECHNOLOGY
May 2020
c
○ Massachusetts Institute of Technology 2020. All rights reserved.
Author . . . .
Program in Media Arts and Sciences
May 8, 2020
Certified by . . . .
Fadel Adib
Assistant Professor
Thesis Supervisor
Accepted by . . . .
Tod Machover
Academic Head, Program in Media Arts and Sciences
Cardiovascular Activity Monitoring Using mmWaves
by
Salah Assana
Submitted to the Program in Media Arts and Sciences on May 8, 2020, in partial fulfillment of the
requirements for the degree of Master of Science
Abstract
The leading cause of death in the world is heart disease with the Centers for Disease Control and Prevention (CDC) reporting about 610,000 deaths per year in the United States alone–that’s 1 in every 4 deaths [15]. Regular monitoring of cardiovascular ac-tivity can help people predict and prevent heart disease. However, existing heart rate monitoring technologies such as the 12-lead electrocardiography (ECG) used in hos-pitals are impractical for lay consumers. Consumer health-monitoring technologies such as Apple Watches and FitBits are easier to use but are not as accurate as gold standard medical devices. Moreover, all these technologies require physical contact to operate making them not ideal for some users.
Motivated by recent advances in human vital sign technology, I want to leverage the power of RF-sensing to monitor cardiac activity. This thesis investigates the potential of leveraging mmWaves, a specific band of radio frequencies used in emerging 5G networks, to monitor cardiovascular health activity. I have built an extendable cardiovascular monitoring platform using off-the-shelf mmWave hardware and used it to capture cardiovascular recordings that resemble a Seismocardiogram. My empirical investigation demonstrates that the non-contact measurements collected using my platform are are comparable to those collected with on-body sensors. Looking ahead, this system could be used to diagnose and monitor a variety of cardiovascular illnesses and conditions.
Thesis Supervisor: Fadel Adib Title: Assistant Professor
This thesis has been reviewed and approved by the following committee
members:
Professor Fadel Adib . . . .
Assistant Professor of MAS and EECS
Massachusetts Institute of Technology
Professor Rosalind Picard . . . .
Professor of Media Arts and Sciences
Massachusetts Institute of Technology
Professor Pratik Shah . . . .
Principal Research Scientist
Massachusetts Institute of Technology
Contents
1 Introduction 11
1.1 The Need for a General-Purpose Contactless Cardiovascular
Monitor-ing Platform . . . 11
1.2 Platform in a Nutshell . . . 12
2 Background and Related Works 15 2.1 Physiological Signals and Seismocardiography . . . 15
2.2 A Review of Wireless Health Sensing . . . 16
2.3 Other Modalities for Cardiac Sensing . . . 18
3 System Design and Implementation 19 3.1 Measuring Distance with Frequency Modulated Continuous Wave Radar 19 3.2 Hardware Architecture . . . 20
3.2.1 Multi-Sensor Extension . . . 21
3.3 Multi-threaded Driver . . . 22
3.4 Real-time Processing . . . 22
3.5 Post Processing . . . 23
3.6 Identifying Fiducial Points . . . 24
4 User Testing and Observation 27 4.1 Subject Overview . . . 27
5 Application for Seismocardiography 29
5.1 Evaluation in Past Work . . . 29
5.2 Project Evaluation . . . 30 5.2.1 mmWave vs. Accelerometer . . . 30 5.2.2 Averaged SCG Results . . . 30 5.3 Limitations . . . 32 5.3.1 Inconsistent Morphology of SCG . . . 32 5.3.2 Quasi-static Movement . . . 33
List of Figures
3-1 An FFT of the IF signals would produce a set of peaks in the frequency
spectrum which correspond to the range of the object. . . 20
3-2 . . . 21
3-3 . . . 21
3-4 In the unfiltered signal (top) all the breathing overwhelms the heart activity. In the filtered signal (below) the respiration is dampened and cardiac vibrations are amplified. . . 23
3-5 . . . 24
5-1 The SCG signal recorded using an accelerometer (top) was time-synced with the mmWave recording (bottom) in post processing. . . 30
5-2 . . . 30
5-3 . . . 30
5-4 . . . 30
5-5 . . . 30
5-6 The above results are from trials collected from different individuals and averaged in the method discussed above. While the morphology of the SCG signal changed we can see that certain fiducial points are always present. . . 32
Chapter 1
Introduction
1.1
The Need for a General-Purpose Contactless
Car-diovascular Monitoring Platform
The leading cause of death in the world is heart disease with the CDC reporting about 610,000 deaths per year in the United States alone–that’s 1 in every 4 deaths [15]. Regular monitoring of cardiovascular activity can help people predict and prevent heart disease. However, existing heart rate monitoring technologies such as the 12-lead electrocardiography (ECG) used in hospitals are cumbersome for lay consumers. Consumer health-monitoring technologies such as Apple Watches and FitBits are eas-ier to use but are not as accurate as gold standard medical devices. Moreover, all these technologies require physical contact to operate.
The need for contact makes existing cardiovascular monitoring technologies in-convenient and undesirable for some patients. Some patients affixed with sensors can develop skin irritations. Elderly patients might feel ashamed to wear a heart monitor at all times. Burn victims can’t have a sensor attached to them and need to be mon-itored from a distance. Many on the autism spectrum have sensory over-sensitivity making it uncomfortable to wear a device. Non-contact cardiovascular monitoring also provides medical professionals with a safe way to monitor patients with highly
infectious diseases.
A general-purpose contactless cardiovascular monitoring platform would not only alleviate these issues, but it would also make continuous cardiovascular monitoring more practical. Buildings could be retrofitted with sensors to monitor the health of the occupants and conduct public health studies. Motivated by recent advances in human vital sign technology, I want to leverage the power of RF-sensing to monitor cardiac activity.
1.2
Platform in a Nutshell
At a high level, my contactless RF-based vital sign monitoring system works as fol-lows: an RF signal is transmitted toward a persons’ chest and then the reflection is captured by a receiving antenna. The distance traveled can be calculated by analyz-ing the phase shift in the signal which changes linearly with distance (i.e. 𝜑 = 2𝜋𝜆𝑑). By tracking small changes in the distance we can measure cardiac vibrations in the chest. These vibrations correspond to myocardial movements caused by the contrac-tion and expansion of the heart muscles. Specifically, the physiological phenomenon that allows wireless signals to extract heart rate using signal reflections from the chest is called seismocardiography (SCG) [33]. Past work has shown that an SCG signal contains fiducial points which map to a physiologic event such as atrial inflow and heart valves opening or closing [28]. These fiducial points have been recorded using an on-body accelerometer but have never been measured using radio waves.
More specifically, my system utilizes a specific band of radio frequencies called mmWaves. Due to their high frequency, we can detect very small movements that other frequency bands simply cannot. This makes it possible to record a high-resolution SCG signal which contains the necessary information for detecting the opening and closing of heart valves. In addition to their high frequency, mmWaves
are also one of the technologies behind 5G networks. As 5G networks become ubiq-uitous in the coming years mmWaves chips will be integrated into all next-generation devices. Newer smartphones like the Pixel 4 already contain mmWave sensors that can detect hand gestures. As mmWave sensors become more common in smartphones they will open up a whole host of new possibilities to users at no extra cost to them. My research could one day make it possible for lay users to monitor their cardio-vascular activity using just their smartphones. This would increase accessibility to healthcare by creating a low-cost method of monitoring your cardiovascular activity. Moreover, once 5G routers are integrated into homes and office they can be used to passively monitor the physical health of the occupants. As health-monitoring tech-nologies advance further, I envision a future where your smartphone can be used to accurately monitor cardiovascular conditions.
Chapter 2
Background and Related Works
2.1
Physiological Signals and Seismocardiography
Seismocardiogram (SCG) represents the local vibrations of the chest wall in response to the heartbeat [10]. Seismocardiography was first studied in the 1960s by R. Baevski who was inspired by the technology used in seismology to register underground vibra-tion and predict earthquakes. Baevski adapted the technology to measure fluctuavibra-tions caused by precordial movements [26].
SCG has been used in aerospace programs to monitor crew health. The first was used by Russian cosmonauts in 1963 onboard the Vostok 5, then again in the early seventies onboard the spacecraft "Sojus" and even onboard the International Space Station since March 2007 as part of the Pneumocard and Sonocard experiments [22].
SCG was not introduced into clinical medicine until 1990 by Salerno and Zanetti to monitoring changes in left ventricular function during ischemia [27]. The SCG waveform was given a nomenclature by R. Crow in 1994 when he recorded seismo-cardiography simultaneously with echoseismo-cardiography and analyzed the relationship of the event in the cardiac cycle [12].
ECG in detecting coronary artery disease during ECG stress exercise testing. It was also shown that when the ECG and SCG results were combined, the sensitivity and specificity of the combined test was comparable to radionuclide and ECHO imaging techniques [29].
SCG was largely abandoned by the medical community due to the overly-cumbersome apparatus needed to measure the on-body accelerations and the advent of echocar-diography and magnetic resonance imaging. However, recent developments have pro-duced a plethora of high quality, sensitive, inexpensive accelerometers ideal for record-ing and analyzrecord-ing the heart’s vibrational output.
The primary advantage of wearable SCG measurement systems is the possibility of obtaining data continuously. In 2007, a team proposed an integrated vest with an accelerometer inside and placed in contact with the subject’s sternum. They recorded 24 hours of data while the subject performed a variety of activities [14].
SCG was originally proposed as a diagnostic tool for clinics. A subject would have their SCG activity recorded and a physician would read the recordings to make a diagnosis. This was later abandoned due to the large intersubject variability of SCG recordings. However, studies found that the intrasubject variability in the signals over serial measurements was low, except when the subject was experiencing a change in cardiovascular health [16]. For this reason, SCG became a tool for monitoring changes in the same patient’s health over time, because the subject would be their own control, making intersubject variability no longer an obstacle.
2.2
A Review of Wireless Health Sensing
There has been work on non-contact RF-monitoring of vital signs since the late ’70s with a proof of concept which proved that radio waves are affected by the minute movement in a person’s chest [20]. In the following years, similar studies replicated
the results using Tx-Rx antennas [17], WiFi [24] and ultra-wideband radar [9].
More recently, advances in wireless transmission systems and signal processing have enabled researchers to detect and analyze human vital signs with more flex-ibility. Past projects have used ultra-wideband radar to measure heart rate and respiration through walls [19, 4] and could monitor multiple people at a time [4, 5]. The wide range of RF-monitoring technologies has also introduced multiple applica-tions for healthcare. Some have leveraged the technology to build non-invasive sleep monitoring systems [13, 32, 7] while others have sought to non-invasively monitor vital signs of a home’s occupants [24]. The major limitation of all these technologies is that they can only provide us with basic vital sign measurements revolving around heart rate (e.g. heart rate variability and interbeat interval). None of them were capable of measuring the seismocardiogram of a subject. I was only able to find one example of an RF-monitoring system that could capture an SCG [30] and it used a microwave doppler radar. To my knowledge, no paper has ever measured SCG using mmWaves.
In recent years, mmWaves have gained a lot of attention because of the role they are expected to play in the upcoming 5G revolution. As 5G networks become more ubiquitous in the future, everyday devices like mobile phones even WiFi routers will soon have 5G technology. This has inspired many interesting applications for mmWaves beyond communication. Specifically, mmWaves have been used in health-care monitoring systems. Past work has measured the heart rate of an individual while laying in bed [8] and of some small animals [11]. Other papers combined the heart rate monitoring technology with a person-finding algorithm to monitor the vital signs of multiple individuals at the same time [31] and extended it to work up to 8 meters away [25].
The goal of my system is to enable all the benefits that existing RF-monitoring technologies introduced and extend them to new applications. By utilizing mmWave,
a soon to be ubiquitous radio frequency, my system enables the monitoring of more detailed cardiovascular information, such as the opening and closing of heart valves, using existing infrastructure.
2.3
Other Modalities for Cardiac Sensing
Electrocardiogram (ECG) The gold standard for cardiac electric sensing is the 12-Lead ECG. An ECG plots a graph of voltage versus time of the electrical activity of the heart using electrodes placed on the skin. The electrodes are placed in precise locations and detect the small electrical changes that result from the cardiac muscle’s depolarization followed by repolarization during each cardiac cycle. However, ECG monitors the electrical activity of the heart and not the mechanical activity. Since the time between the electrical activity and the mechanical activity varies for individuals it can be difficult to determine heart valve function from ECG alone.
Echocardiogram The echocardiogram is an ultrasound heart monitor that uses standard two-dimensional, three-dimensional, and Doppler ultrasound to create im-ages of the heart. The echocardiogram is not used for regular heart monitoring rather it is routinely in the diagnosis, management, and follow-up of patients with any sus-pected or known heart diseases. Unlike electrocardiography, echocardiography can estimate more detailed heart function, such as a calculation of the cardiac output, ejection fraction, and diastolic function. However, echocardiography requires an ex-pert to operate the system and identify heart functions. Furthermore, an ultrasound device costs around $10,000 and is not very mobile.
Chapter 3
System Design and Implementation
3.1
Measuring Distance with Frequency Modulated
Continuous Wave Radar
To measure distance using radio waves one typically transmits a signal and measures the time it takes the signal to reflect and reach the receiving antenna. This is referred to as the signal’s time-of-flight (TOF). Typically, a signal’s time of flight would be estimated by transmitting a very short pulse and measuring its sub-nanosecond delay in the time domain. However, this would require high-speed analog-to-digital con-verters (ADCs) that operate at multi-GS/s. Such ADCs are expensive, high power, and have a low bit resolution. Alternatively, the signal’s TOF can be measured by leveraging a signal processing technique called Frequency-Modulated Carrier Waves (FMCW), which measures time by measuring frequency thus leading to an inexpen-sive and low-power solution.
We provide a high-level explanation of FMCW and refer the reader to [21] for a detailed description of how FMCW works. An FMCW radar can be summarized in a few steps. First, a synthesizer generates a sinusoid whose frequency increases linearly with time and is referred to as a ’chirp’. Second, the chirp is transmitted by the Tx antenna, reflected off an object, and received at the Rx antenna. Third,
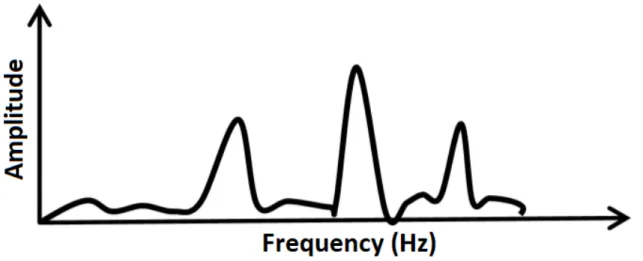
Figure 3-1: An FFT of the IF signals would produce a set of peaks in the frequency spectrum which correspond to the range of the object.
the Rx signal and the Tx signal are ’mixed’ and the resulting signal is called an ’Intermediate Frequency (IF) signal’. The IF signal is the key to measuring distance because the frequency of each tone in the IF signal is proportional to the distance of the corresponding object (see 3-1). This is because the carrier frequency changes linearly in time so delays in the reflected signals translate into frequency shifts in comparison to the transmitted wave. By comparing the frequency difference in the transmitted and received signals we can discover the time delay of the signal which corresponds to the TOF of that signal.
3.2
Hardware Architecture
Architecturally, my system combines a mmWave sensor with a real-time data-capture adapter for radar sensing. The mmWave sensor is an IWR1443BOOST board that includes a monolithic implementation of a 3TX, 4RX system with a fully configurable hardware accelerator that supports complex FFT [2]. The board mixes the Tx and Rx signals to produce the IF signal and then passes it through a 625ksps ADC. The data from the mmWave sensor is transferred to a real-time data capture board via a 60-pin high-density connector. The real-time data capture board [3] buffers the data into 1456 byte packets and then streams the data to a PC via 1-Gbps Ethernet cable.
Figure 3-2:
Both devices are off-the-shelf boards so, unlike past projects [4], the entire set-up does not require any custom-built radars to operate.
3.2.1
Multi-Sensor Extension
Figure 3-3:
A limitation of the IWR1443BOOST mmWave sensor is that it must be configured using proprietary software which can only support one board at a time. This
pre-vents us from building any type of antenna arrays or monitoring multiple locations simultaneously. To overcome this challenge I utilized VMware to virtualize one of the Ethernet ports and run a virtual machine to simulate a second computer. This allowed me to connect two boards to the same physical machine so that I could collect the data in real-time using a multi-threaded driver.
3.3
Multi-threaded Driver
When the data is transmitted to the PC a packet sniffing program captures and pro-cesses the data in real-time. However, since the real-time data capture board uses a UDP connection it does not guarantee that all packets will reach the PC. If the real-time processing causes a delay we might lose packets and our data will be cor-rupt. To ensure that the real-time processing does not result in significant packet drops I have written a multi-threaded data processing program. One thread monitors the Ethernet port and continuously adds packets to a buffer on the PC. A second thread then takes the data from the buffer and performs the real-time processing. I tested the performance of my real-time data processing program by running both boards simultaneously for 5 minutes and tracking how many packets were dropped. The overall data loss for both board was bellow 0.01%.
3.4
Real-time Processing
Once the data has been captured and is queued for processing it is sent to a MAT-LAB file to perform some signal processing. The first step is to parse the data in the data packets and isolate the data for each Tx-Rx combination (e.g. Tx1-Rx1, Tx1-Rx2, etc.). Once the data has been segmented we can multiply the 8 channels by a beamforming vector to direct the signal. The beamforming concentrates the signal on the person’s chest by directing in the 0-degree angle (i.e. straight ahead).
Our next step is to select the frequency bin which corresponds to the location of the person we are trying to monitor. Since all our tests are done at a close range (about 25cm) with one person in front of the mmWave sensor our task is simplified. We can automatically select the frequency bin with the highest amplitude. Finally, we can monitor and plot the changes in the frequency, which you will recall correspond to changes in distance, to track the displacement in the person’s chest that correspond to breathing and heart activity. It’s important to note that real-time processing is mainly performed to ensure that the system is functioning and collecting good data. We won’t be able to see the person’s heart activity because their breathing will over-whelm the signal. It is possible to see the heartbeats in real-time but the person must hold their breath. This issue is addressed in the post-processing section.
3.5
Post Processing
Figure 3-4: In the unfiltered signal (top) all the breathing overwhelms the heart activ-ity. In the filtered signal (below) the respiration is dampened and cardiac vibrations are amplified.
Since the cardiac vibrations caused by our heart activity are modulated by our breathing it is difficult to see heart activity in the signal. The displacement due to
breathing is orders of magnitude larger than the displacement caused by cardiac vi-brations so simply monitoring displacement won’t work. Instead, we exploit the fact that a person’s heart rate will have a higher acceleration than their breathing. This is because breathing is a slow and gradual activity while heart activity is rapid. By definition, acceleration is the second derivative of the position so we apply a differ-entiator filter that takes the second-order derivative of the signal. The acceleration signal dampens the modulation caused by the breathing and leaves us with an SCG signal that is comparable to one collected with an on-body sensor.
3.6
Identifying Fiducial Points
Once we have a high-resolution SCG signal we can map the peaks and troughs to cardiovascular activity. There have been several papers in the past that have defined fiducial points in a seismocardiogram [12, 6, 28, 27]. Over the years there has been some debate about which fiducial points are visible in the SCG, but 5 fiducial points have consistently been found and agreed upon.
Figure 3-5:
and aortic valve opening (AO). In the diastole, we have the aortic valve closing (AC) and the mitral valve opening (MO). These five heart functions collectively make-up the process of pumping oxygenated blood into the body. Briefly summarized, oxy-genated blood flows from the left atrium to the left ventricle through the mitral valve. Then the mitral valve will close and the aortic valve will open allowing blood to exit the heart through the aorta and flow to the rest of the body. Once the left ventricular contracts, the aortic valve will close and the mitral valve will open and begin refilling the left ventricular until peak atrial systole is reached.
While automatic labeling has been done in the past [18], with accuracies between 50%-70%, it is standard to manually label fiducial points due to the inconsistent morphology of the SCG signal. Past studies have used an ECG signal as a way to segment the SCG signal and as a reference point for finding fiducial points [12, 6, 28, 27]. I replicate these studies by time-synchronizing my system with an ECG monitor and then averaging the segments together to produce an averaged SCG signal. Further explanation will be provided in the results section.
Chapter 4
User Testing and Observation
4.1
Subject Overview
To evaluate the performance of our system we recruited 29 participants (8 females) between the ages of 21 and 35. None of the participants had reported known pre-existing cardiovascular conditions. Participants wore their daily attire such as T-shirts, blouses, and button-downs with different fabric materials. This research pro-tocol has been approved by our IRB.
4.2
Testing Procedure
Sensors: During the experiments we collected data from three sensors simultane-ously. The first was our mmWave sensing system. The second was a 3-lead OpenBCI ECG probes [1] attached to the top right, top left and bottom left of the person’s chest. The third was an on-body accelerometer which is used as the ground truth for our system.
Ground Truth: To determine our system’s accuracy, we compare its output against SCG measurements collected with a standard accelerometer. The accelerometer was attached to the person’s chest with either adhesive tape or an elastic string wrapped around the person’s chest. The accelerometer was positioned underneath the left
bicep.
Experimental Environment: We performed our experiments in an open office en-vironment in an office building with standard furniture and co-existence with other wireless technologies (WiFi, LTE, Bluetooth, etc.). Throughout our experimental trials, other people were walking around in the environment. During the data col-lection process, subjects were asked to sit in a chair within 25 cm from the sensor and 45 cm from the floor. Each experiment lasted for exactly 3 minutes during which the subjects were asked to remain still and not move their arms or legs, but could breathe, blink, and swallow regularly. The mmWave sensors were placed in front of the subjects and aimed at the sternum. The ground truth was collected by attaching an accelerometer to the subject’s chest, slightly to the left of their sternum. We con-ducted 87 experimental trials, each lasting for exactly 3 minutes. Subject heart rates varied from 60-100bpm.
Chapter 5
Application for Seismocardiography
5.1
Evaluation in Past Work
In an earlier study that found fiducial points in a seismocardiogram, researchers used an echocardiograph as ground truth for detecting heart activity [12, 28]. A person would monitor the echocardiogram and manually label when a particular heart activity occurred. The labels were placed on a time-synced electrocardiogram (ECG) to show their position in time. While collecting the ground truth data the researchers also collected an SCG signal with an on-body accelerometer that was also time-synced with an electrocardiogram. Once enough data had been collected, the echocardiogram frames and the seismocardiogram frames were segmented using the R-peaks in the ECG. The SCG segments were averaged together to produce a mean SCG signal. The locations of the echocardiogram labels were then averaged together to produce a mean location for each label. Finally, they computed the 95% confidence intervals around the means of the physiologic events found using ultrasound. If a peak or trough in the mean SCG was within one of these confidence intervals, it was associated with that heart function and labeled a fiducial point. The [12] study conducted this test on 28 subjects with no heart conditions and a subsequent study [28] repeated the experiment for 45 subject who also did not have any heart conditions.
5.2
Project Evaluation
5.2.1
mmWave vs. Accelerometer
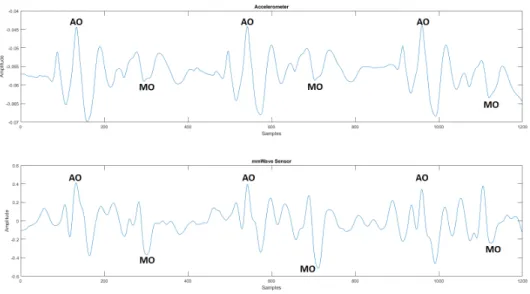
Figure 5-1: The SCG signal recorded using an accelerometer (top) was time-synced with the mmWave recording (bottom) in post processing.
When comparing a segment of the SCG signal recorded using the mmWave sensor to the SCG signal recorded using an on-body accelerometer we see that both signals have a similar morphology. In the systolic, we see a peak that corresponds to the aortic valve opening (AO) and in the diastolic, there is a trough that corresponds to the mitral valve opening (MO).
5.2.2
Averaged SCG Results
Figure 5-2: Figure 5-3: Figure 5-4: Figure 5-5: Of the 29 subjects who participated in the study, I selected the 8 which had the cleanest measurements. Some of the subject results were not usable because poor
placement of the electrodes resulted in an an ECG signal that was too noisy to use. In other cases, the subject did not remain still during the data gathering period and the SCG data was too corrupt to process. The need for subjects to remain quasi-static is discussed further in the limitation sections.
Once I had vetted the SCG and ECG data manually. I evaluated the performance of my system in a very similar way to the methods described above. First, the SCG data collected with the mmWave sensor was segmented using the R-peaks of the ECG signal 5-2. Second, the signals were then layered with the same starting point 5-3. Third, the mean length of the SCG segments was calculated and all the segments were time-scaled to that length 5-4. Fourth, the signals were averaged together linearly to produce a mean ECG signal 5-5.
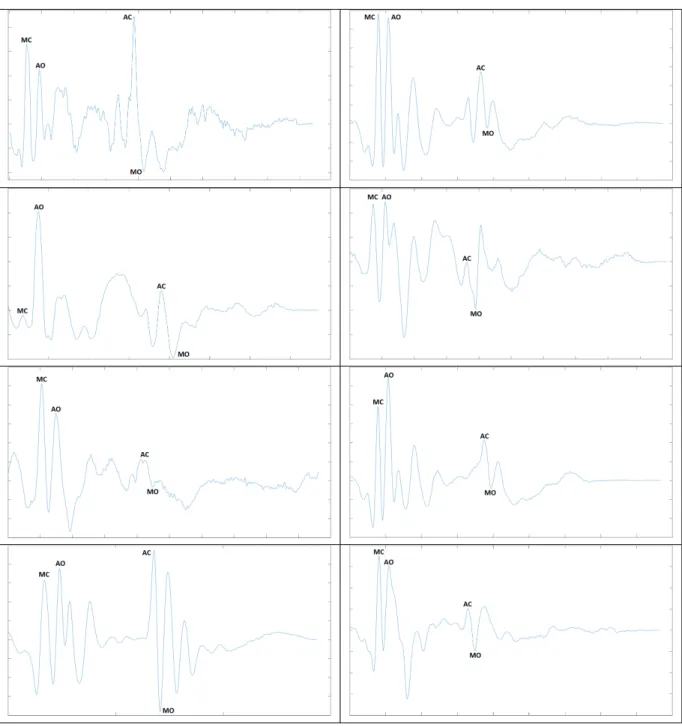
Once we had the mean SCG signal, I could use the information from existing lit-erature to identify fiducial points. Specifically, I began by identifying the Atrial Valve Opening (AO) in the systolic and the Mitral Valve Opening (MO) in the diastolic since they were the most prominent points. It is then easy to infer the location of the Mitral Valve Closing (MC) because it will be the peak immediately preceding the AO and the Atrial Valve Closing (AC) will be the peak immediately preceding the MO.
In some trials, it was also possible to identify the Peak Atrial Systole (AS), a large peak proceeding the systole portion, but this point was not consistently found so it was omitted from the results. The inconsistent morphology of SCG signals is a common issue which I will discuss further in the limitations section.
Figure 5-6: The above results are from trials collected from different individuals and averaged in the method discussed above. While the morphology of the SCG signal changed we can see that certain fiducial points are always present.
5.3
Limitations
5.3.1
Inconsistent Morphology of SCG
A major challenge with SCG signals, independent of how they are measured, is the inconsistent morphology. Unlike an ECG signal, the morphology of an SCG signal
varied from person to person and even the same person measured at different times [28]. While this limitation prevents us from using an SCG trace alone to diagnose pa-tients, it may still be possible to observe the SCG signal over time to diagnose various cardiovascular conditions. This is further explained in the Future Work section.
5.3.2
Quasi-static Movement
Like existing RF-monitoring technologies, the system currently requires the subject to remain quasi-static while gathering data. This is because any full-body movement would overwhelm the small movement caused by cardiovascular movement.
Chapter 6
Future Work (Beyond SCG)
I have primarily discussed the Cardiovascular Activity using the mmWave framework in the context of an SCG monitoring paradigm. However, the system can be extended to various other tasks. I hope that as mmWave technology advances my work will serve as a starting point to a plethora of health monitoring technologies.
In the introduction, I talked about how SCG can monitor a variety of health is-sues. So far I have focused on monitoring cardiovascular recordings. However, one avenue that would be good to explore would be the possibility of using the system to detect Atrial Fibrillation (AF). Past work has shown that on-body SCG sensors can be used to detect irregularities in your heart cycle [23]. The researchers observed that when a period of irregularity occurred, the SCG signal changed in both the x-axis and y-axis. In the x-axis, there was an irregularly large gap and in the y-axis, there was a sudden spike in amplitude.
Thus far, all my measurements have been collected using a single board pointed at the person’s chest. However, the system is capable of collecting data simultane-ously from two boards. This makes it possible to monitor a person’s cardiovascular activity in two locations which opens the door to monitoring blood flow parameters such as blood pressure (BP), pulse wave velocity (PWV), pulse transit time (PTT), and various other measurements. Such information would open the door to a whole
new area of health monitoring studies. I hope that this system will transform how mmWave will be used in the future and expand the possibilities to more than just communication.
Bibliography
[1] Emg/ecg snap electrode cables. https://shop.openbci.com/products/emg-ecg-snap-electrode-cables?variant=32372786958. Accessed: 2020-05-13.
[2] Iwr1443 single-chip 76-ghz to 81-ghz mmwave sensor evaluation module. http://www.ti.com/tool/IWR1443BOOST. Accessed: 2020-05-04.
[3] Real-time data-capture adapter for radar sensing evaluation module. http://www.ti.com/tool/DCA1000EVM. Accessed: 2020-05-04.
[4] Fadel Adib, Hongzi Mao, Zachary Kabelac, Dina Katabi, and Robert C Miller. Smart homes that monitor breathing and heart rate. In Proceedings of the 33rd annual ACM conference on human factors in computing systems, pages 837–846. ACM, 2015.
[5] Adeel Ahmad, June Chul Roh, Dan Wang, and Aish Dubey. Vital signs mon-itoring of multiple people using a fmcw millimeter-wave sensor. In 2018 IEEE Radar Conference (RadarConf18), pages 1450–1455. IEEE, 2018.
[6] Alireza Akhbardeh, Kouhyar Tavakolian, Viatcheslav Gurev, Ted Lee, William New, Bozena Kaminska, and Natalia Trayanova. Comparative analysis of three different modalities for characterization of the seismocardiogram. In 2009 An-nual International Conference of the IEEE Engineering in Medicine and Biology Society, pages 2899–2903. IEEE, 2009.
[7] Eyhab Al-Masri and Misba Momin. Detecting heart rate variability using millimeter-wave radar technology. In 2018 IEEE International Conference on Big Data (Big Data), pages 5282–5284. IEEE, 2018.
[8] Mostafa Alizadeh, George Shaker, and Safeddin Safavi-Naeini. Remote heart rate sensing with mm-wave radar. In 2018 18th International Symposium on Antenna Technology and Applied Electromagnetics (ANTEM), pages 1–2. IEEE, 2018.
[9] Laura Anitori, Ardjan de Jong, and Frans Nennie. Fmcw radar for life-sign detection. In 2009 IEEE Radar Conference, pages 1–6. IEEE, 2009.
[10] B. S. Bozhenko. Seismocardiography–a new method in the study of functional conditions of the heart. Terapevticheskii arkhiv, 33:55, 1961.
[11] Sergei Churkin and Lesya Anishchenko. Millimeter-wave radar for vital signs monitoring. In 2015 IEEE International Conference on Microwaves, Communi-cations, Antennas and Electronic Systems (COMCAS), pages 1–4. IEEE, 2015. [12] Richard S Crow, Peter Hannan, David Jacobs, Lowell Hedquist, and David M
Salerno. Relationship between seismocardiogram and echocardiogram for events in the cardiac cycle. American journal of noninvasive cardiology, 8:39–46, 1994. [13] Philip De Chazal, Emer O’Hare, Niall Fox, and Conor Heneghan. Assessment of sleep/wake patterns using a non-contact biomotion sensor. In 2008 30th An-nual International Conference of the IEEE Engineering in Medicine and Biology Society, pages 514–517. IEEE, 2008.
[14] M Di Rienzo, E Vaini, P Castiglioni, G Merati, P Meriggi, G Parati, A Faini, and F Rizzo. Wearable seismocardiography: Towards a beat-by-beat assessment of cardiac mechanics in ambulant subjects. Autonomic Neuroscience, 178(1-2):50– 59, 2013.
[15] Centers for Disease Control and Prevention. Heart disease facts. https://www.cdc.gov/heartdisease/facts.htm, 2017.
[16] OT Inan, M Etemadi, RM Wiard, L Giovangrandi, and GTA Kovacs. Robust ballistocardiogram acquisition for home monitoring. Physiological measurement, 30(2):169, 2009.
[17] Ossi Johannes Kaltiokallio, Hüseyin Yigitler, Riku Jäntti, and Neal Patwari. Non-invasive respiration rate monitoring using a single cots tx-rx pair. In Pro-ceedings of the 13th international symposium on Information processing in sensor networks, pages 59–70. IEEE Press, 2014.
[18] Farzad Khosrow-Khavar, Kouhyar Tavakolian, Andrew P Blaber, John M Zanetti, Reza Fazel-Rezai, and Carlo Menon. Automatic annotation of seis-mocardiogram with high-frequency precordial accelerations. IEEE journal of biomedical and health informatics, 19(4):1428–1434, 2014.
[19] Xiaolin Liang, Hao Zhang, Shengbo Ye, Guangyou Fang, and T Aaron Gulliver. Improved denoising method for through-wall vital sign detection using uwb im-pulse radar. Digital Signal Processing, 74:72–93, 2018.
[20] James C Lin, Joseph Kiernicki, Martin Kiernicki, and Paul B Wollschlaeger. Microwave apexcardiography. IEEE Transactions on Microwave Theory and Techniques, 27(6):618–620, 1979.
[21] Bassem R Mahafza. Radar systems analysis and design using MATLAB. CRC press, 2002.
[22] Pierre-François Migeotte, S De Ridder, Jens Tank, N Pattyn, Irina Funtova, R Baevsky, Xavier Neyt, and G Kim Prisk. Three dimensional ballisto-and
seismo-cardiography: Hij wave amplitudes are poorly correlated to maximal sys-tolic force vector. In 2012 Annual International Conference of the IEEE Engi-neering in Medicine and Biology Society, pages 5046–5049. IEEE, 2012.
[23] Mikko Pänkäälä, Tero Koivisto, Olli Lahdenoja, Tuomas Kiviniemi, Antti Saraste, Tuija Vasankari, and Juhani Airaksinen. Detection of atrial fibrillation with seismocardiography. In 2016 38th Annual International Conference of the IEEE Engineering in Medicine and Biology Society (EMBC), pages 4369–4374. IEEE, 2016.
[24] Neal Patwari, Lara Brewer, Quinn Tate, Ossi Kaltiokallio, and Maurizio Bocca. Breathfinding: A wireless network that monitors and locates breathing in a home. IEEE Journal of Selected Topics in Signal Processing, 8(1):30–42, 2013.
[25] Douglas T Petkie, Carla Benton, and Erik Bryan. Millimeter wave radar for remote measurement of vital signs. In 2009 IEEE Radar Conference, pages 1–3. IEEE, 2009.
[26] A. D. Egorov R. M. Baevskii and L. A. Kazarian. The method of seismocardio-graphy. Kardiologiia, 18:87–89, 1964.
[27] David M Salerno. Seismocardiography: A new technique for recording cardiac vibrations. concept, method, and initial observations. Journal of cardiovascular technology, 9(2):111–118, 1990.
[28] Kasper Sørensen, Samuel E Schmidt, Ask S Jensen, Peter Søgaard, and Jo-hannes J Struijk. Definition of fiducial points in the normal seismocardiogram. Scientific reports, 8(1):15455, 2018.
[29] Richard A Wilson, Virinderjit S Bamrah, Joseph Lindsay Jr, Markus Schwaiger, and Joel Morganroth. Diagnostic accuracy of seismocardiography compared with electrocardiography for the anatomic and physiologic diagnosis of coronary artery disease during exercise testing. The American journal of cardiology, 71(7):536– 545, 1993.
[30] Zongyang Xia, Md Mobashir Hasan Shandhi, Omer T Inan, and Ying Zhang. Non-contact sensing of seismocardiogram signals using microwave doppler radar. IEEE Sensors Journal, 18(14):5956–5964, 2018.
[31] Zhicheng Yang, Parth H Pathak, Yunze Zeng, Xixi Liran, and Prasant Mohap-atra. Monitoring vital signs using millimeter wave. In Proceedings of the 17th ACM International Symposium on Mobile Ad Hoc Networking and Computing, pages 211–220. ACM, 2016.
[32] Alberto Zaffaroni, Philip De Chazal, Conor Heneghan, Patricia Boyle, Patri-cia Ronayne Mppm, and Walter T McNicholas. Sleepminder: an innovative contact-free device for the estimation of the apnoea-hypopnoea index. In 2009 annual international conference of the IEEE engineering in medicine and biology society, pages 7091–9094. IEEE, 2009.
[33] John M Zanetti and Kouhyar Tavakolian. Seismocardiography: Past, present and future. In 2013 35th annual international conference of the IEEE engineering in medicine and biology society (EMBC), pages 7004–7007. IEEE, 2013.