Publisher’s version / Version de l'éditeur:
Vous avez des questions? Nous pouvons vous aider. Pour communiquer directement avec un auteur, consultez la première page de la revue dans laquelle son article a été publié afin de trouver ses coordonnées. Si vous n’arrivez pas à les repérer, communiquez avec nous à PublicationsArchive-ArchivesPublications@nrc-cnrc.gc.ca.
Questions? Contact the NRC Publications Archive team at
PublicationsArchive-ArchivesPublications@nrc-cnrc.gc.ca. If you wish to email the authors directly, please see the first page of the publication for their contact information.
https://publications-cnrc.canada.ca/fra/droits
L’accès à ce site Web et l’utilisation de son contenu sont assujettis aux conditions présentées dans le site
LISEZ CES CONDITIONS ATTENTIVEMENT AVANT D’UTILISER CE SITE WEB.
IEEE Transactions on Industry Applications, 24, 3, pp. 370-379, 1988-05
READ THESE TERMS AND CONDITIONS CAREFULLY BEFORE USING THIS WEBSITE. https://nrc-publications.canada.ca/eng/copyright
NRC Publications Archive Record / Notice des Archives des publications du CNRC :
https://nrc-publications.canada.ca/eng/view/object/?id=12359e0e-57c6-467b-9666-92f44d115d60 https://publications-cnrc.canada.ca/fra/voir/objet/?id=12359e0e-57c6-467b-9666-92f44d115d60
NRC Publications Archive
Archives des publications du CNRC
This publication could be one of several versions: author’s original, accepted manuscript or the publisher’s version. / La version de cette publication peut être l’une des suivantes : la version prépublication de l’auteur, la version acceptée du manuscrit ou la version de l’éditeur.
Access and use of this website and the material on it are subject to the Terms and Conditions set forth at
Economics of switching fluorescent lamps
Carrière, L. A.; Rea, M. S.
Ser
TH1
IN21d
National Research
Conseil national
1562
1
Council Canada
c. 2
de recherches Canada
BLDG
Institute for
lnstitut de
,
Research in
recherche en
Construction
construction
Economics of Switching Fluorescent Lamps
by L.A. Carriere and M.S. Rea
Reprinted from
IEEE Transactions on Industry Applications
Vol. 24, No. 3, May/June 1988
p. 370-379
(I RC Paper No. 1562)
NRCC 2941 5
NRC-
CISTIL I B R A R Y
I
I R C
CNRC-
IClSTEn se bamt sur nne tmde comparative du cofit de diff€rentes options de commatation, dont une combidson de paramkms t€moignant de prdjuges contre la commutation Mquenk, les auteurs confirment qu'if est konomique de f m e r Ies l a m p flvo~scentes lorsqubon n'en a pas besoin. IEs expliquent les mtthodes de calcul utilistes et @sentent une analyse de smsibilitk.
Economics of Switching Fluorescent Lamps
Louis A. Carriere
Mark
S.
Rea
Reprinted from
IEEE TRANSACTIONS ON
IND~USTRY
APPLICATIONS Vol. 24, No. 3, MayIJune 1988IEEE TRANSACTIONS ON INDUSTRY APPLICATIONS, VOL. 24, NO. 3, MAYIJUNE 1988
Economics of Switching Fluorescent Lamps
Abstract-Based o n side-by-side cost comparison of different switch- for periods much longer than those recommended at present ing options, including a combination of parameters biased against
frequent switching, this study reinforces the idea that it is economical to turn fluorescent lamps off when they are not needed. Background information to explain the calculation procedures and a sensitivity analysis are included.
A
S A LARGE fraction of the energy used in commercial buildings is for lighting, it should be possible to reduce energy consumption by switching lamps off. It is known, however, that the life of fluorescent lamps is affected by switching. Many believe that switching fluorescent lamps, the most common type of lighting in commercial buildings, is not economical because replacement will be necessary sooner.The economic value of switching fluorescent lamps depends upon a variety of factors, among them rated lamp life and energy cost, both of which have grown. Examination of the various editions of the IES Lighting Handbook, for example, reveals that the rated lamp life for a standard fluorescent lamp (e.g., 48-in T-12, Med. Bipin) has increased over +e years: 12 000 h in 1966 [I], 18 000 h in 1972 [2], and 20 000 h in 1981 [3]. Depending upon location, electricity rates have risen substantially to become quite important in economic analyses of building management. These changes, among other impor- tant considerations, necessitate a close reexamination of the economics of switching fluorescent lamps.
Several studies have addressed the subject [4]-[12], but the present paper explains in greater detail the various steps involved. Unlike previous studies, it includes the costs of lamp ballasts in the economic analysis. A sensitivity analysis is also provided to delineate more clearly the significance of the various factors in the economics of switching fluorescent lamps.
The report demonstrates that both money and energy will be saved if standard or energy-efficient fluorescent lamps are turned off at night, at lunch, during coffee breaks, and, in general, whenever they are not needed. Money will be saved, although burning life will actually be reduced by more frequent switching, because lamps will not have to be replaced Paper IUSD 87-43, approved by the Production and Application of Light Committee of the IEEE Industry Applications Society for presentation at the 1986 Industry Applications Society Annual Meeting, Denver, CO, September 28-October 3. This work carried out on behalf of the National Research Council of Canada. Manuscript released for publication August 21, 1987.
L. Carriere is with the Communication Security Establishment, Department of National Defence, P.O. Box 9703, Terminal, Ottawa, ON, Canada KIG 324.
M. S. Rea is with the-National Research Council of Canada, Institute for Research in Construction, Montreal Road Laboratories, Building M-24, Ottawa, ON, Canada KIA 0R6.
IEEE Log Number 8719051.
(e.g., three years for group relamping [13]).
These conclusions are based upon a calculation procedure developed for this report. Several cost comparisons were performed for different switching scenarios, including some in which the combination of parameters in the cost equation were systematically biased against frequent switching (i.e., high lamp cost combined with low ballast and energy costs). The economics of switching fluorescent lamps with different purchase costs or rated lives, or for switching scenarios other than those used in this report, can be readily examined using the simple calculation procedure.
A. Starting Current
Contrary to popular belief, starting a fluorescent lamp does not take very much additional energy. The Naval Civil Engineering Laboratory (USA) [4] has demonstrated that although the "in-rush" current is five times larger for starting a fluorescent lamp than for normal operation, it lasts only half a cycle (11120 s). The extra energy consumption is therefore negligible and need not be considered in the economic analysis. For example, a 40-W standard fluorescent lamp with a standard twin-lamp ballast burning 5.5 hlday would consume 0.256 kWh1day. If the lamp were to be started ten times during the day, the energy consumption would increase by only 0.002 percent (i.e., 5.4
x
kWh1day).B. Lamp Life
1) Burning Time: Fluorescent lamp life ends after a given .number of starts [14] and burning hours [15], [16], when the emissive material on one or both electrodes is exhausted and fails to produce enough electrons to enable the lamp to strike [17]. At the end of its life, the lamp will typically glow at a much reduced brightness or abruptly fail to start, depending on the ballast circuit involved [16]. The rate at which the emissive coating leaves the electrodes during starting and operation depends on many factors [15], [16], [18], including filling gas pressure, electrode characteristics, lamp operating current, waveshape of lamp current, direct-current operation, lamp operating voltage, surrounding air temperature, type of starter (quality of start), type of ballast, ballastllamp combination, high-frequency operation, and newlold lamp combination 1191.
These factors and others inherent in the lamp materials and manufacturing make it very unlikely that every lamp will operate for the same length of time. Estimates of lamp life are
based on the average life of many lamps operated under controlled testing conditions [20]. A typical mortality curve
for a large group of lamps operated under an orthodox burning cycle (3 h on and 20 min off [21]) is illustrated in Fig. 1 [22]. The distribution of values follows a normal probability curve, fully described by the mean and standard deviation [15]. In practice, lamps are replaced well before half of them are extinguished. An empirical equation can describe the first half of the standard mortality curve; the mortality ratio M is given by
M = 0.4228
+
0.0706(1.130 +log (100 - SC))2 (I) where SC is the survival criterion in percent (50<
SC<
99). The hours of operation after which half the lamps in a large group operating under controlled testing conditions and a particular burning cycle fail to produce light are convention- ally defined as the "average lamp life." The average life for a burning cycle of 3 hlstart is defined as the "rated lamp life."Fig. 2 gives the average lamp life (in percent of rated lamp life) as a function of different repetitive burning cycles. It can clearly be seen that shorter burning cycles u reduce the average lamp life. It must be emphasized, however, that reduced average lamp life does not necessarily mean that, in practice, a lamp will have to be replaced sooner. As will be shown later, a lamp operated for a few hours a day because of frequent switching will not need to be replaced as soon, in terms of calendar time, as a continually operated lamp, although the former has a shorter average lamp life.
To facilitate the analysis, an empirical equation based on a Weibull distribution [23] was determined to describe the curve in Fig. 2. This relation between average lamp life and burning cycle is
LAMP MORTALITY RATIO. M
Fig. 1. Typical mortality curve for statistically large group of fluorescent lamps (at 3 hlstart) [22].
f l u ) = a ( 1 - e x p [ - l u l b l c ] I W H E R E : a
-
1 7 1 . b = 3 . 8 9 . C = 0 . 5 0 5u = B U R N I N G C Y C L E S l h l s l a r t l I 6 0
BURNING CYCLES, u
Fig. 2. Effect of burning cycles on average lamp life for most popular types of rapid-start fluorescent lamps [6].
found when M = 1 and u -+ 00; then f(u)/100 = 1.71. By
f(u)= 171(1 -exp [-(~/3.89)O.~O~]) using this empirical equation, the continuous lamp life is found (2) to be 1.71 times longer than the rated lamp life L,.
where
f ( u ) average lamp life, percent of rated lamp life, u burning cycle, hlstart.
Burning lamp life L, can be defined as the total time, in hours, that a lamp will provide light. L, depends on the rated lamp life L,, the mortality ratio M (which depends upon the survival criterion SC), and the average lamp life for a particular burning cycle u, according to
Equation (2) is strictly applicable only when the switching operation of lamps is repetitive (i.e., when lamps are turned on and off at the same regular intervals). In practice, switching is probably aperiodic (see Appendix I). Equation (2) may still be used to estimate lamp mortality by assuming that the average burning cycle ii is equal to the cyclic burning cycle u in (2). Thus f ( u ) in (3) may be defined as equal to f(ii),
f (a) = 17 l(1- exp [ - (ii/3 .89)0.505]) (4) (3) where
where ii
(h/s),
average burning cycle in a day, hlstart,h daily hours of light usage,
L, rated lamp life (given by lamp manufacturers), hours, s number of switch operationslday. M mortality ratio, (I),
Alternatively, one can assume that f ( u ) can be estimated and f ( u ) is as in (2).
from the sum of the effects each burning cycle has on lamp
The longest burning life an average lamp can have is defined
-
life. Thus f ( u ) may be defined as equal to f(u): as its "continuous" lamp life, and according to (3) it may be
The data for the curve in Fig. 2 were obtained by taking the ratio of the abscissa over the ordinate in [6, Fig. 11. Owing to the large number of lamps and the long time involved in collecting data on lamp life, it is expensive to
produce the data necessary for ~ i 2. For this reason, and because ~ r where is a burning cycle in h/start and f ( u ) is as in (2). manufacturers concentrate their effort on new products constantly entering the
market, such data are rare. In the absence of complete information this curve It convenient to base all calculations on daily usage, since must be considered as representative of all rapid-start lamps. activity patterns tend to be repeated in this way. Further,
372 IEEE TRANSACTIONS ON INDUSTRY APPLICATIONS, VOL. 24, NO. 3, MAYIJUNE 1988
annual estimates of cost are based on the number of working days in a year. This temporal demarcation in days does not
-
affect f(@, but it does affect f ( u ) to a small degree. If, for example, three different burning cycles (u, = 1, u2 = 3, u3= 4) are repeated daily, then = 2.67 hlstart, and f ( a ) =
f(2.67) = 96.2; however,
The estimates of f ( u ) by either equation are very similar, - but f
( a )
will always be slightly smaller than f ( u ) for practical burning cycles (i.e., for u smaller than 34.5 hlstart (Appendix I)). The economic analyses in this report are based on f(zi)-
since 1) determining f ( u ) requires more effort than determin- ing f (a), without much change in the absolute value off (u); 2) the values of burning cycles ( u ) would usually be uncertain estimates based on average daily usage anyway; and 3) the cost calculations will be slightly biased against frequent switching. 2) Real Time: The real-time lamp life (lamp replacement frequency) in years L, is the calendar time between relampings and is given byburning lamp life
L, = - -- Ll
annual hours of light usage h
x
n (6) whereLI burning lamp life, (3), h daily hours of light usage,
n total number of operational days per year. C. Ballast Energy Consumption and Design Life
The principal function of a ballast is to limit current to a fluorescent lamp. The ballast also supplies sufficient voltage to start and operate the lamp. With rapid-start lamps, the most common type, the ballast supplies voltage to heat the lamp cathodes continuously [24].
In controlling a pair of 4-ft fluorescent lamps the standard two-lamp ballast will consume 13.2 W [21]; alternatively, 7 W will be consumed by a comparable energy-efficient ballast that has an improved iron core and a lower resistance in the copper wiring [25].
The end of ballast life occurs when the coil and the winding
-
insulation have deteriorated to a point where the ballast fails to operate or its audible noise level is unacceptable. The rate of ballast deterioration increases as ballast temperature increases [16], [17], [22]. Because high-efficiency ballasts operate at lower temperatures, their expected lives are quoted as between 60 000 and 90 000 h; in contrast, standard ballasts are rated at 30 000 h [25].Frequent switching may actually prolong ballast life if average operating temperatures are reduced. No benefit was given for this, however, in the calculations presented here. Consideration was given only to the extended real-time ballast life due to reduced operating hours from more frequent switching.
the cooling load in summer (and sometimes also in winter for interior areas). It is usually better to have lower lighting loads unless special heat recovery systems are utilized or extensive capital expenditure is required for auxiliary heating equipment [26]. Additional savings can usually be realized by installing down-sized HVAC systems [26], but these were not consid- ered in the present analyses.
2) Daily Energy Cost: Daily energy cost depends on 1) local utility rates (for energy consumption, penalties for peak demand, time of use, and poor power factor), 2) power associated with the lamplballast combination, and 3) daily hours of usage. Monetary saving will be realized by switching when the energy rate and the connected lighting load are high and the daily hours of light usage low. The daily energy cost for operating a lamp Ce in Cldayllamp is given by
W x E Ce=- x h
1000 where
W total wattage for lamps and ballastlnumber of lamps,
w
,E average energy rate, CIkWh, h daily hours of light usage, h.
3) Daily Effective Ballast Cost: The daily effective ballast cost is important in the same way as is daily energy cost. Greater monetary savings will be realized when ballast cost is high and daily hours of light usage are low. The cost of replacing a ballast involves labor and purchase costs, which depend in turn on local labor rates and the type and local purchase price of the ballast. The daily effective ballast cost for operating a lamp Cb in Cldayllamp is given by
where
Rb ballast replacement costlnumber of lamps per ballast, Cllamp,
Lb rated ballast life, h,
h daily hours of light usage, h.
4) Daily Effective Lamp Cost: Estimating the daily effective lamp cost is especially important since relative lamp cost will be increased when the real-time lamp life is shortened by frequent switching (unlike incandescent lamps or ballasts); relative lamp cost will be decreased when the real-time lamp life is lengthened by significant reductions in hours of light usage. Effective lamp cost depends upon the purchase price of the lamp and the labor cost for replacement. Lamp cost depends upon size and type as well as local purchase price. The labor cost depends on the local rates as well as the method of relamping, i.e., group or spot relamping. For group relamping, the effective lamp cost also depends on the criterion chosen for relamping (i.e., the value of M in (1)). D. Factors Affecting Economics of Switching The 'daily effective lamp cost C1 in Cldayllamp is given by
I) Heat of Lights: In many buildings lights are a major source of heat. While this may be useful in winter, it adds to
or, from (3),
where
RI lamp purchase and labor cost for replacement, CI lamp,
L, rated lamp life, h, M mortality ratio in (I), f ( u ) f ( a ) in (4),
h daily hours of light usage, h.
The individual values for RI and M in (9) will largely depend on the method of relamping, but it is less important for C1 because of the ratio RI/M. For group relamping, RI = $2.10 and M = 0.7; for example, R I / M = $3. Similarly, for spot relamping, if RI = $3 and M = 1, then R I / M = $3. Thus the daily effective lamp cost (C,) is less dependent on relamping method than might be supposed, although RI is less with group relamping [13], [27]. This is because lamps must be replaced sooner ( M = 0.7) with group relamping than with spot relamping ( M = 1.0).
E. Daily Operating Cost p e r Lamp
The total daily operating cost (C,) in Cldayllamp is defined here as
or, from (7)-(9), W x E
c,=- x h + - x h Rb
1000 Lb
It is necessary to emphasize that relamping costs are built into this equation. Thus, when comparing two situations the lower total daily operating cost will always be more economi- cal.
111. ASSUMED LIGHTING OPTIONS AND CASES
An appropriate way to determine the cost effectiveness of fluorescent switching is to examine the effects of switching on lamp life and daily operating costs for different situations. Suppose, for a 21-story office building with individual offices, that 10 000 4-ft fluorescent lamps are to be group-relamped. Working hours are from 8:00 A.M. to 4: 15 P.M. and janitorial
services are carried out during the day. Six options and two cases were considered (Appendix I1 gives justifications for the values used). The options considered are as follows.
A) Lights are on 24 hlday, 365 dayslyr: 8760 hlyr. B) Lights are on 15 hlday (e.g., 6:00 A.M.-~:OO P.M.), 230
working dayslyr: 3450 hlyr.
C) Lights in offices are turned on individually in the morning when occupants arrive and off when they leave at night (e.g., 8:00 A.M.-4:15 P.M.), 8.25 hlday, 230 working dayslyr: 1897.5 hlyr.
D) Same as C except that lights are turned off when occupants leave for lunch (e.g., 12:15 P.M.-1:00 P.M.), 7.5 hlday: two switch operations per day: 1725 hlyr. E) Same as D except that lights are turned off when
occupants leave for coffee breaks (e.g., 10:00 A.M.-
10: 15 A.M. and 3:00 P.M.-3: 15 P.M.), 7 hlday, four switch
operations per day: 1610 hlyr.
F) Lights in offices are turned on individually in the morning as occupants arrive and turned off whenever they leave the office. Here the lights are estimated to be on for 5.5 hlday , 1265 hlyr, with ten switch operations per day.
A. Cases
The economics of fluorescent switching will depend on the parameter values in (10). The parameters for Case I were representative of an existing situation in which standard 40-W lamps and ballasts subject to high-energy prices were used. This is favorable for switching since it creates a low effective lamp cost C,, a high energy cost Ce, and a high effective ballast cost Cb (10). The parameters for Case 11 were biased against switching; in relation to Case I the effective lamp cost Cl is higher, the energy cost Ce is lower, and the effective ballast cost Cb is lower.
Case I (Favorable for Switching)-Parameters (10):
Ce = energy cost = 0.466 Clhllamp
x
usage, (Equation (7)), where W = 46.6 W and E = 10 CIkWh;Cb = effective ballast cost = 0.024 Clhllamp x usage (Equation (8)), where Rb = 1200 Cllamp and L b = 50 000 h;
0.015 C/h/lampxusage Cl = effective lamp cost =
f(u)/lOo
(Equation (9)), where Rl = 210 Cllamp, M = 0.7, and L, = 20 000 h.
Case II (Biased Against Switching)-Parameters (10):
Ce = energy cost = 0.101 Clhllamp
x
usage (Equation (7)), where W = 33.5 W and E = 3 CIkWh;Cb = effective ballast cost = 0.017 Clhllamp
x
usage (Equation (8)), where Rb = 1500 Cllamp and Lb = 90 000 h;0.028 Clhllamp
x
usage Cl = effective lamp cost =f
(u)/ 100(Equation (9)), where RI = 350 Cllamp, M = 0.7, and L, = 18 000 h.
Note: Options A-F define usage u in hours per day for all cost calculations.
IV. SIDE-BY-SIDE COMPARISONS
Only Section IV-B is required in the following economic determinations for fluorescent switching under the various
374 IEEE TRANSACTIONS ON INDUSTRY APPLICATIONS, VOL. ZA, NO. 3, MAYIJUNE 1988
TABLE I
COMPARISON OF BURNING LAMP LIFE L, AND REAL-TIME LAMP LIFE L, FOR DIFFERENT SWITCHING SCENARIOS
Options
Assumptiona A B C D E F
h daily hours of light usage, h
s number of daily switch operations
n number of operational days 365 230 230 230 230 230
ti average burning cycle per day, h
Case I (L, = 20 000 h, M = 0.7 (93-percent survival))
L, burning lamp life, h 23 900 20 600 18 400 15 000 11 700 7400
L, real-time lamp life, yr 2.7 6.0 9.7 8.7 7.2 5.9
Case I1 (L, = 18 000 h, M = 0.7 (93-percent survival))
L, burning lamp life, h 21 500 18 600 16 600 13 500 10 500 6700
L, real-time lamp life, yr 2.5 5.3 8.7 7.8 6.5 5.3
" zi = equation (4); L, = equation (3); L, = equation (6). Note: Values of L, and L, for spot relamping may be obtained by dividing existing values by 0.7, thus setting M = 1.
lighting options. Sections IV-A, V, and VI contain supplemen- tary information.
A. Lamp Life
Examination of burning lamp life Ll (i.e., number of hours of light production) and real-time lamp life L, (i.e., calendar time between replacements) can help one to understand the economics of on-off switching of fluorescent lamps. Table I gives values of LI and L, for various lighting options and for Cases I and 11 defined in Section III; the following observa- tions are pertinent.
Case II follows the same pattern as Case I except that lamp life (both L , and L,) is shorter, owing to the smaller rated lamp life L,. The real-time lamp life L, is shortest for option A (Section 111) since both the daily hours of light usage h and the number of operational days per year n are maximum. Still, it is about the same length of time as the conventional group relamping time, i.e., three years [13].
Burning lamp life LI always decreases with shorter burning cycles
a,
but real-time lamp life L, has an optimum length associated with the value of z i in option C. Clearly, the reduced burning lamp life is not always associated with reductions in real-time lamp life. Further, even without an economic analysis it is obvious that short hours of light usage (option B) and one switch per day (option C) will be cost effective since relamping has been delayed. It is not clear, however, where more frequent switching (options D-F) are cost effective without a complete economic analysis.B. Cost
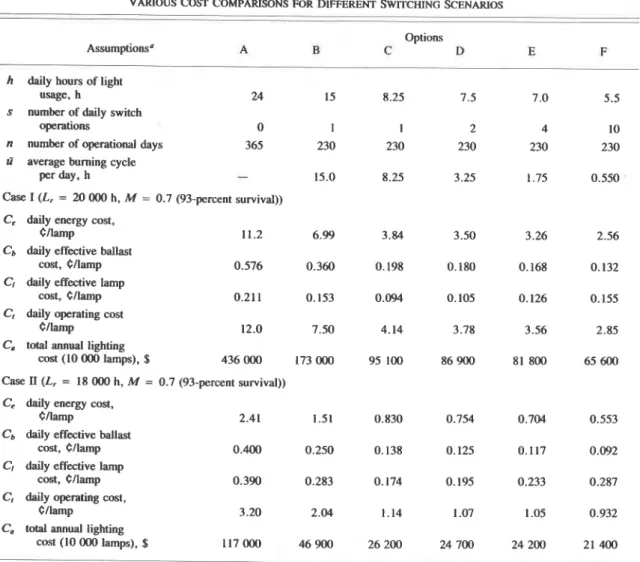
As stated in Section IV-A, operating costs have to be computed for options D-F to determine whether it is economi- cal to switch more frequently. Table I1 gives the'operating costs for both cases and for all the options; the following observations can be made from this table.
Both Case I and Case I1 show the same trends; only the
absolute values differ. The daily effective ballast cost Cb is a significant parameter in the cost equations; many times it was greater than the corresponding daily effective lamp cost C l . CI has an optimum cost associated with option C, and except for option A, which is based on 365 days instead of 230 days, is inversely proportional to the real-time lamp life L, in Table I. Nevertheless, daily operational costs C, and annual lighting costs C, continue to decrease for those options having more frequent switching.
It is expensive to leave lights on all the time (option A). More than half the annual lighting cost C, can be saved by reducing the daily hours of light usage from continuous operation (option A) to 15 h (option B). Another 45 percent of the annual lighting cost can be saved by reducing the daily hours of light usage from 15 h (option B) to 8.25 h (option C). Turning lights off at lunch and coffee breaks brings additional savings. The most economical option, however, is to turn fluorescent lamps off whenever they are not needed (option F). An important point to note is that all such savings may be realized at no additional cost to the building operator where localized switching already exists. Savings are possible simply by changing the switching attitudes of the occupants [28]. The economics of retrofitting a building with another switching arrangement are beyond the scope of this paper.
All examples in Section
IV
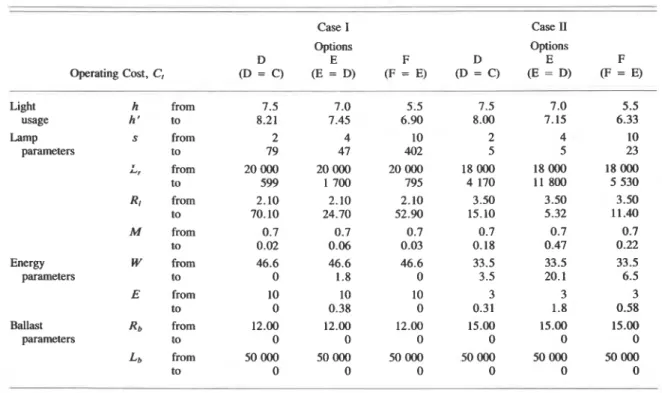
demonstrate that it is economical to switch off unneeded fluorescent lamps. The results depend, of course, upon the specific parameters chosen for (10). It is unnecessary to compare options A, B, and C since L, is extended the longer the lamp is off. Table III presents the results of a sensitivity malysis, comparing options D-F for both cases. The hours of light usage and each lamp, energy, and ballast parameter (left side of Table In) are changed individually for each case. Thus 1) the daily operating cost of option F was set to equal option E (column labeled F = E), 2)C A ~ R E AND REA: ECONOMICS OF SWITCHING FLUORESCENT LAMPS
TABLE Il
VARIOUS COST COMPARISONS FOR DIFFERENT SWITCHING SCENARIOS
Options
A B C D E F
h daily hours of light usage, h
s number of daily switch operations
n number of operational days 365 230 230 230 230 230
P average burning cycle
per day, h - 15.0 8.25 3.25 1.75 0.550
Case I (L, = 20 000 h, M = 0.7 (93-percent survival)) C, daily energy cost,
crimp
Cb daily effective ballast cost, crimp C daily effective lamp
cost, Cllamp C, daily operating cost
CIlamp
C. total annual lighting
cost (10 000 lamps), $ 436 000 173 000 95 100 86 900 81 800 65 600
Case 11 (L, = 18 000 h, M = 0.7 (93-percent survival)) Cc daily energy cost,
cnamp
C b daily effective ballast cost, Cllamp CI daily effective lamp
cost, Cllamp
C, daily operating cost, Cllamp
C. total annual lighting
cost (10 000 lamps), $ 117 000 46 900 26 200 24 700 24 200 21 400
"
c,
= quation (7); Cb = equation (8); C, = equation (9); C, = equation (10); C. = CI x n = 10 0001100.the daily operating cost of option E was set to equal that for option D (column labeled E = D), and 3) the daily operating cost of option D was set to equal that for option C (column labeled D = C). Rows labeled "from" give the values assumed in the previous calculations (Appendix II); those labeled "to" give the values yielding equivalent operating costs associated with the option having more frequent switch- ing.
Because Case I is favorable to switching, the values can be changed by a greater amount than those in Case 11, which was biased against switching. The zeros in some of the columns indicate that the more frequent switching option would be economical for any values less than those assumed in Appendix 11.
Table 111 demonstrates that exact hours of light usage need to be known for determining the economics of fluorescent
VI. BREAK-EVEN PERIOD
The break-even period is the length of "off'' time for which the increase in relamping cost just offsets the decrease in ballast and energy costs. Because lamp life depends upon the number of hours per switch operation u, break-even periods will also depend upon the switching pattern (also u). It is therefore necessary to employ the "break-even period per switch operation" rather than the break-even period (in hours) when determining the proper cost balance between relamping costs and operational (ballast and energy) costs.
Using the light usage values calculated in Table 111, the average break-even period per switch operation, in minutes P,, is given by
h c - h h
options C, D: P,,,, =- x60 SC - SD
lamp switching; relatively small errors in estimating the h D - h ; average may upset the economic analysis. Similarly, for Case options D, E: - x60
n,
where energy rates are low, lamp costs are high, and ballast SD - SEcosts low, one needs to know fairly accurately the number of h , - h i switches occurring in a day. All other parameters can. be E,
F:
=-- x60IEEE TRANSACTIONS ON INDUSTRY APPLICATIONS, VOL. 24, NO. 3, MAYIJUNE 1988
TABLE 111
SENSITIVITY ANALYSIS FOR DIFFERENT SWITCHES SCENARIOS
Case I Case I1 Options Options D E F D E F Operating Cost, C, (D = C) (E = D) (F = E) (D = C) (E = D) (F = E) Light h from 7.5 7.0 5.5 7.5 7.0 5.5 usage h' to 8.21 7.45 6.90 8.00 7.15 6.33 Lamp s from 2 4 10 2 4 10 parameters to 79 47 402 5 5 23 L, from 20 000 20 000 20 000 18 000 18 000 18 000 to 599 1 700 795 4 170 11 800 5 530 RI from 2.10 2.10 2.10 3.50 3.50 3.50 to 70.10 24.70 52.90 15.10 5.32 11.40 M from 0.7 0.7 0.7 0.7 0.7 0.7 to 0.02 0.06 0.03 0.18 0.47 0.22 Energy W from 46.6 46.6 46.6 33.5 33.5 33.5 parameters to 0 1.8 0 3.5 20.1 6.5 E from 10 10 10 3 3 3 to 0 0.38 0 0.31 1.8 0.58 Ballast Rb from 12.00 12.00 12.00 15.00 15.00 15.00 parameters to 0 0 0 0 0 0 Lb from 50 000 50 000 50 000 50 000 50000 50 000 to 0 0 0 0 0 0
h = hour; s = pure number; L, = hour; R, = $; M = pure number; W = watt; E = ClkWh; Rb = $; Lb = hour.
where ballast wattages change during dimming. As long as lamps are
h daily hours of light usage, started at full ouput (because they were designed to be started
h ' maximum daily hours of light usage for break-even in this way) and the lamps, ballasts, and dimming equipment
condition, are properly matched [22], lamp life should not be affected by
s number of switch operations per day. dimming.
Table
IV
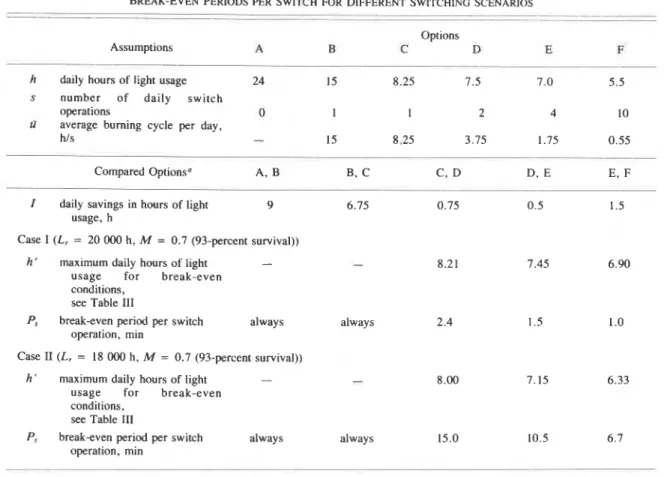
gives the break-even periods per switch operation for the various options and Cases I and 11; from this the following observations can be made.Because Case I is more favorable for switching, the break- even periods are smaller than those for Case 11.
Even if the breakeven period per switch operation is large (15 min), in comparing options C and D for Case 11 it is still economical to turn lights off at lunch because half an hour of a 314-h period constitutes a saving. Comparable arguments may be made for the other option comparisons.
Because the lamp replacement time L, was increased in the first two columns (A, B and B, C), there are no break-even periods; it is always economical to reduce the hours of usage for the same number of switches. For the other columns (C, D; D, E; E, F), break-even periods will of course depend upon the length of time the lights are off relative to the lamp life lost by switching. The smaller the average burning cycle zi, the smaller the break-even period per switch operation; this is because the effect of each switch operation on lamp life becomes less as the frequency of switching increases, in spite of the fact that total lamp life is reduced by more frequent switching.
VIII. D~scussro~
Equation (10) does not provide a complete cost analysis; it does not include important factors such as occupant productiv- ity, heat recovery or loss from lights, and lighting mainte- nance. Equation (10) is useful as long as 1) saving lighting energy does not compromise occupant productivity through reduced illumination levels, and 2) reducing the heat to the space by switching lights off is, in fact (usually the case), beneficial on an annual basis [26]. Given these caveats, (10)
enables one to determine cost savings from turning fluorescent lamps off when they are not needed during a working day.
Short "off' times between switch operations decrease fluorescent lamp life and can potentially increase lighting operating cost. During a normal working day, however, there are very few occasions when lamps would be turned off for less than 7 min (Table
IV,
Option F, Case 11) before being turned on again. For this reason people should be instructed to turn fluorescent lamps off when they are not needed. Occa- sionally there may be small losses from short off periods, but on average, savings would surely occur for most scenarios with frequent switching (e.g., Table 11).IX. CONCLUSION
VII. DIMMING LAMPS Based on side-by-side cost comparison of different switch- The economic analysis for dimming fluorescent lamps will ing options, it is concluded that for normal working days it is be different from that for switching only because the lamp and economical to turn off unneeded fluorescent lamps. This is
CARRIERE AND REA: ECONOMICS OF SWITCHING FLUORESCENT LAMPS
TABLE 1V
BREAK-EVEN PERIODS PER SWITCH FOR DIFFERENT SWITCHING SCENARIOS
-
--
-Options
Assumptions A B C D E F
h daily hours of light usage 24 15 8.25 7.5 7.0 5.5
s number of daily switch
operations 0 1 I 2 4 10
fi average burning cycle per day,
h/s
-
15 8.25 3.75 1.75 0.55Compared Optionsa A, B B, C C, D D, E E, F
I daily savings in hours of light 9 6.75 0.75 0.5 1.5 usage, h
Case I (L, = 20 000 h, M = 0.7 (93-percent survival))
h ' maximum daily hours of light -
-
8.21 7.45 6.90 usage for break-evenconditions, see Table I11
P, break-even period per switch always always 2.4 1.5 1 .O operation, min
Case I1 (L, = 18 000 h, M = 0.7 (93-percent survival))
h ' maximum daily hours of light - - 8.00 7.15 6.33
usage for break-even conditions,
see Table I11
P, break-even period per switch always always 15.0 10.5 6 . 7 operation, min
" P,$ = equation (I I).
true even for a combination of parameters biased against frequent switching (i.e., high effective lamp cost combined with low effective ballast and energy costs).
It is shown that the daily effective ballast cost can be a significant parameter in the economic analysis of fluorescent switching. Sensitivity analysis reveals that the average hours of light usage must be determined accurately when making cost calculations; and the number of switch actions must also be identified when energy rates are low.
Break-even periods for fluorescent switching depend on so many parameters that it is impossible to provide a single value. For the lighting options considered in this report, however, break-even periods per switch operation are always below 2.5 min at 10 ClkWh (Case I) and below 15 min at 3 CIkWh (Case 11).
APPENDIX I
-
DISCUSSION OF THE DIFFERENCES BETWEEN f ( a ) AND f ( u )
When the switching operation of lamps is not cyclic, as is the usual practice, the average life ratio f ( u ) in
-
(3) can be given by either f ( u ) = f ( a ) in (4) or by f ( u ) = f ( u ) in (5). Equation (4) includes the implicit assumption that switching actions are independent. Thus the total hours of operation and the total number of switches are divided without regard for the time between switching operations. This assumption cannot be correct; the effect of each switch action on lamp life decreases with more frequent switching. Equation (5) reflects, althoughnot completely, this interaction of switching operations. The effect of each switch action is weighted differentially accord- ing to (2) (see Fig. 2). (The denominator in (5) weighs each burning cycle u in the numerator relative to u = 3 hlstart.) The real effect of mixed burning cycles on lamp life is unknown, however, because there are no lamp life data for nonrepetitive on-off cycles.
-
Table V compares the values for f ( a ) and f ( u ) with various burning cycles (A-G). Both functions give similar results; except for average burning cycles
a
-
less than 34.5 hlstart, f ( a ) is always slightly smaller than f (u).I) Fig. I: Curve is as published in the IES Lighting Handbook [22].
2) Fig. 2: Curve is as published in [6]. The comparable curve in the IES Handbook [22] was inappropriate becaust: of its small size and missing values for small burning cycle. No other good quality curve could be identified.
3) Building: A 21-story office building (data from a case study 21-story office building [29]) with
10 000 lamps (from [29]),
daytime janitorial hours (from [29]),
private offices (so that occupants can control their own lights),
IEEE TRANSACTIONS ON INDUSTRY APPLICATIONS, VOL. 24. NO. 3, MAYIIUNE 1988
TABLE V
VALUES OF f(zi) AND f ( u ) FOR VARIOUS BURNING CYCLES ( u )
Example U I
more economical than spot relamping [4], [27]), 5) Number of Operational Days Per Year n:
standard 40-W fluorescent lamps with regular two-lamp
ballast (the most widely used type of fluorescent lamp/ n Explanation ballast combination for office purposes),
energy-efficient 30-W fluorescent lamp with energy- 365 number of days per year for continuous burning efficient two-lamp ballast (this combination is replacing 230 number of days per year that first author was in his the standard lamp/ballast combination). office (1984), not including weekends, 11 statutory holidayslyear, five days of vacationlyear, five days/ year for conference attendance (or for sick leave).
4) Daily Hours of Light Usage h: 6) Daily Number of Switch Operation
s:
Option h Explanation Option s Explanation
A 24 lights always on
B 15 average value from case study [29]
C 8.25 daily hours paid for as government employee plus lunch time
D 7.5 daily hours paid for as government employee E 7.0 daily hours paid for as government employee,
minus two 15-min coffee breaks
F 5.5 average daily hours of light usage in first author's room (private office), taken over a 1-yr period
A 0 none, lights always on B 1 one on-off switchinglday C 1 one on-off switchinglday
D 2 one on-off switchinglday plus one extra switch for lunch
E 4 one on-off switchinglday plus three extra switches, for lunch and two daiiy coffee breaks
F 10 average daily number of switch operations, taken over a one-year period in the first author's room (private office).
7) Parameters for (10):
Case I, Favorable to Switching:
power, W energy rate
standard two-lamp ballast (cost) standard two-lamp ballast design life standard 40-W lamp (rated life) standard 40-W lamp (cost) group relamping
two standard 40-W lamps and a two-lamp ballast, 2 W = 93.2 W [21], W = 46.6 Wllamp;
E = 10 C/kWh (average in Charlottetown, PE, Canada);
2 Rb = $24 [30] (purchase price $10, labor cost $14), Rb = $12/lamp;
Lb = 50 000 h [30];
L, = 20 000 h [3];
R, = $2.10 [30];
purchase price $1.25, labor cost 85 C.
Case 11, Biased Against Switching:
power, W two energy-efficient 30-W lamps and two-lamp ballast, 2 W = 67 W [22],
W = 33.5 Wllamp;
energy rate E = 3 C/kWh (average in Ottawa, ON, Canada);
energy-efficient two-lamp ballast (cost) 2 Rb = $30 [30] (purchase price $16, labor cost $14), Rb = $15/lamp; energy-efficient two-lamp ballast design life Lb = 60 000 h [25], Lb = 90 000 h was used as a conservative value; energy-efficient 30-W lamp (rated life) L, = 18 000 h [3];
energy-efficient 30-W lamp (cost)
group relamping R, = $2.60 [30] (purchase price $1.75, labor cost 85 C , RI = $3.50 was used as a conservative value.
CARRIERE AND REA: ECONOMICS OF SWITCHING FLUORESCENT LAMPS 379
The authors would like to thank the members of staff at the General Electric Company, Nela Park, and those at BC
Hydro, Vancouver, for comments on a previous manuscript. They gratefully acknowledge the contributions of M. Ouellette for computer assistance.
REFERENCES
IES Lighting Handbook. 4th ed. New York: Illuminating Engineer-
ing Society. 1966, pp. 8-74.
IES Lighting Handbook, 5th ed. New York: Illuminating Engineer-
ing Society, 1972, pp. 8-94.
IES Lighting Handbook, Reference Volume. New York: Illumina-
tion Engineering Society, 1981, pp. 8-100.
"Turn off the lights!!," Civil Engineering Lab.. Naval Construction Battalion Center, Port Hueneme, CA, Tech. Data Sheet 80-01, Jan. 1980. (Available in Canada as. "Turn off the lights!!!," Public Works Canada, Tech. Data Sheet EC-210. Feb. 1981 .)
Cheaper to Leave Fluorescents On? Forget that Myth and Switch'Em Off. Santa Monica, CA: Engineering Manual Novitas
Inc., 1982.
"Fluorescents-onloff," Lighting Design Appl.. vol. 3, pp. 38-39, Jan. 1973.
"Economics of fluorescent lighting," Light Lighting. p. 101, May1 June 1976.
"Data on lighting equipment necessary for the development of efficient standards," California Energy Commission, Sacramento, Consultant Rep. P400-80-008, pp. 14.1zi4.5, June 1980.
"The ons and offs of fluorescent lamps," California Energy Commis- sion, Sacramento, Rep. 400-80-018, 1980.
"The economics of lamp switching," Energy Conservation Div., BC Hydro, Rep. L104C. May 1982.
Energy Management in Lighting Design. Lesson 10, Fundamentals of Commercial and Industrial Lighting. Washington: Electrification
Council, 1977.
"Turning Off Fluorescent lamps," Duro Test Corp., 2321 Kennedy Blvd., North Bersen, NJ, 07047, Form 879-01-741 1 U 10M. 1974.
"Systematic lighting maintenance can reduce the cost of light," General Electric Co., Lamp Dept., 1705 Noble Rd., Nela Park,
Cleveland, OH 441 12, no. 8737. -
[14] F. J. Vorlander and E. H. Raddin, "The effect of operating cycles on fluorescent lamp performance," Illuminating Eng., pp. 21-27, Jan. 1950.
1151 R. N. Thayer, "Determinants of fluorescent lamp life," Illuminating
Eng., pp. 527-588, Nov. 1954.
(161 C. L. Amick, Fluorescent Lighting Manual, 3rd ed. Toronto, ON, Canada: McGraw-Hill, 1960, pp. 115-144.
1171 Lamps and Lighting, 3rd ed. Cay less and Marsden, 1983, pp. 191- 192, 280-283.
[IS] "Fluorescent lamps," GTE Sylvania Canada Ltd., Engineering Bulle- tin 0.330, no date.
[I91 "Relamping economics," Relamping Service Canada Ltd., Brampton, ON (personal communication).
[20] "IES approved method for life performance testing of fluorescent lamps," J. IES, pp. 213-215, July 1982.
I. Trawic. "Ballasts and retrofit lamps for energy savings," Canadian Electrical Assoc., Res. Rep. 009 USOA, p. 14, Sept. 1981.
IES Lighting Handbook, Reference Volume. New York: Illumi-
nating Engineering Society, 1984, pp. 8-26-8-35.
W. B. Nelson, "Basics of product life data analysis," General Electric Co., Rep. 83CRF017, p. 9, Feb. 1983.
"Fluorescent Lamps," General Electric Co., Nela Park, Cleveland, OH, TP-I IlR. no date, p. 12.
Fluorescent Lamp Ballasts, Energy Efficiency Standards, California
Energy Commission, Sacramento, P400-82-064, June 1982. M. Anderson and R. Lee, Industrial Energy-Conservation, Manual
10, Efficiency in Lighting. Cambridge, MA: MIT Press, 1982, pp.
60-61.
M. Christensen, "A method for determining minimum cost of relamping," Illuminating Eng., pp. 7 12-7 17, Nov. 1962.
"Lighting energy conservation from labelling switches-A study," National Res. Council of Canada, Contract Rep. DSS 09SX.31155-1- 4405, Nov. 1983.
L. A. Carrikre and M. S. Rea, "Lighting energy consumption in an office building having manual switches," Nat. Res. Council Canada, Div. of Building Res., Building Res. Note 221, 1984.
Personal communication, Elec. Eng. Section, Public Works Canada, Ottawa, ON.
S. Lyons, "A switch in time," Lighting Equipment News, p. 16, Jan. 1981.
P. Coleman, "Energy effective lighting control," Elec. Equipment, pp. 19-22, Oct. 1983.
Louis A. Cambe received the B.S. degree (hon- ors) in physics from Carleton University, Ottawa, ON, Canada, in 1982.
From March 1983 to February 1985 he was on a lighting fellowship sponsored by the Canadian Electrical Association (CEA) at the National Re- search Council, Canada (NRCC). The lighting research carried out under the fellowship was conducted in conjunction with and guided by a team of lighting researchers in the Institute for Research in Construction at NRCC.
Mark S. Rea received the Ph.D. degree in sensory biophysics from Ohio State University in 1978.
Since that time he has worked in Ottawa at the National Research Council, Canada (NRCC). He is presently head of the Lighting Group in the NRCC's Institute for Research in Construction. He chairs the IESNA RQQ Committee, which is responsible for making recommendations of lighting standards. He is also active in the Commission Internationale de 1'Eclairage (CIE) and is on the CIE Canadian National Committee. He is author of over 40 papers dealing with lighting and vision.
T h i s paper
![Fig. 1. Typical mortality curve for statistically large group of fluorescent lamps (at 3 hlstart) [22]](https://thumb-eu.123doks.com/thumbv2/123doknet/14277212.491160/6.883.465.824.343.558/typical-mortality-curve-statistically-large-group-fluorescent-hlstart.webp)