Coordinated Splicing of Regulatory Detained
Introns within Oncogenic Transcripts Creates an
Exploitable Vulnerability in Malignant Glioma
The MIT Faculty has made this article openly available.
Please share
how this access benefits you. Your story matters.
Citation
Braun, Christian J. et al. “Coordinated Splicing of Regulatory
Detained Introns Within Oncogenic Transcripts Creates an
Exploitable Vulnerability in Malignant Glioma.” Cancer Cell 32, 4
(October 2017): 411–426 © 2017 Elsevier Inc
As Published
http://dx.doi.org/10.1016/J.CCELL.2017.08.018
Publisher
Elsevier BV
Version
Author's final manuscript
Citable link
http://hdl.handle.net/1721.1/118828
Terms of Use
Creative Commons Attribution-NonCommercial-NoDerivs License
Coordinated Splicing of Regulatory Detained Introns within
Oncogenic Transcripts Creates an Exploitable Vulnerability in
Malignant Glioma
Christian J. Braun1,8, Monica Stanciu1,8, Paul L. Boutz1,8, Jesse C. Patterson1, David Calligaris2, Fumi Higuchi3, Rachit Neupane1, Silvia Fenoglio1, Daniel P. Cahill3, Hiroaki Wakimoto3, Nathalie Y. R. Agar2,4,5, Michael B. Yaffe1,6,7, Phillip A. Sharp1, Michael T. Hemann1,9, and Jacqueline A. Lees1,9,10
1The David H. Koch Institute for Integrative Cancer Research and Department of Biology, Massachusetts Institute of Technology, Cambridge, MA 02139, USA
2Department of Neurosurgery, Brigham and Women’s Hospital, Harvard Medical School, Boston, MA 02115, USA
3Department of Neurosurgery, Massachusetts General Hospital, Boston, MA 02144, USA 4Department of Cancer Biology, Dana-Farber Cancer Institute, Harvard Medical School, Boston, MA 02215, USA
5Department of Radiology, Harvard Medical School, Boston, MA 02115
6Department of Biological Engineering, Massachusetts Institute of Technology, Cambridge, MA 02139, USA
7Division of Acute Care Surgery, Trauma, and Critical Care, Department of Surgery, Beth Israel Deaconess Medical Center, Harvard Medical School, Boston, MA 02215, USA
Summary
Glioblastoma (GBM) is a devastating malignancy with few therapeutic options. We identify PRMT5 in an in vivo GBM shRNA screen and show that PRMT5 knockdown or inhibition potently suppresses in vivo GBM tumors, including patient-derived xenografts. Pathway analysis implicates splicing in cellular PRMT5 dependency, and we identify a biomarker that predicts
Contact information: Michael T. Hemann and Jacqueline A. Lees, David H. Koch Institute for Integrative Cancer Research,
Massachusetts Institute of Technology, 77 Massachusetts Avenue, Cambridge, MA 02139, hemann@mit.edu and jalees@mit.edu. 8These authors contributed equally
9These authors are co-corresponding 10Lead contact.
Publisher's Disclaimer: This is a PDF file of an unedited manuscript that has been accepted for publication. As a service to our
customers we are providing this early version of the manuscript. The manuscript will undergo copyediting, typesetting, and review of the resulting proof before it is published in its final citable form. Please note that during the production process errors may be discovered which could affect the content, and all legal disclaimers that apply to the journal pertain.
Author contributions:
Conceptualization, C.J.B., M.S., M.H. and J.A.L.; Methodology, C.J.B., M.S., P.L.B., J.P., D.C., F.H., S. F., D.P.C., H.W., N.Y.R.A. and M.B.Y.; Software: P.L.B.; Formal Analysis: P.L.B. and J.P.; Investigation: C.J.B., M.S., P.L.B., D.C., F.H. and R.N.; Resources: F.H., D.P.C. and H.W.; Data curation: P.L.B.; Writing - original draft: C.J.B., M.S., P.L.B., M.T.H. and J.A.L; Writing -review and
HHS Public Access
Author manuscript
Cancer Cell
. Author manuscript; available in PMC 2018 October 09. Published in final edited form as:Cancer Cell. 2017 October 09; 32(4): 411–426.e11. doi:10.1016/j.ccell.2017.08.018.
A
uthor Man
uscr
ipt
A
uthor Man
uscr
ipt
A
uthor Man
uscr
ipt
A
uthor Man
uscr
ipt
sensitivity to PRMT5 inhibition. We find that PRMT5 deficiency primarily disrupts the removal of detained introns (DIs). This impaired DI-splicing affects proliferation genes, whose
down-regulation coincides with cell cycle defects, senescence and/or apoptosis. We further show that DI-programs are evolutionarily conserved and operate during neurogenesis, suggesting that they represent a physiological regulatory mechanism. Collectively, these findings reveal a PRMT5-regulated DI splicing program as an exploitable cancer vulnerability.
Graphical Abstract
Braun et al. show that glioblastoma is selectively sensitive to the inhibition of PRMT5 and identify a predictive biomarker for this sensitivity. PRMT5 inhibition primarily disrupts the removal of detained introns, which results in the reduction of functional transcripts of mainly proliferation-associated genes.
Keywords
Splicing addiction; GBM; PRMT5; EPZ015666; biomarker
Introduction
Glioblastoma (GBM) is a highly malignant brain tumor with a grim clinical prognosis despite aggressive and multimodal treatment regimens (Stupp et al., 2005). With few exceptions, there is a dearth of targeted therapeutics to treat this disease (Lau et al., 2014). Moreover, there is a lack of well-defined GBM dependencies that represent possible therapeutic targets. In vivo loss of function screens offer an unbiased method to identify cellular processes that represent key vulnerabilities for cancer cells. These screens are particularly useful in identifying cancer dependencies that are not induced by mutation and, consequently, not revealed by tumor genome sequencing efforts (Gargiulo et al., 2014). However, high-throughput genetic approaches are challenging in GBM where the
heterogeneity and consequent differential growth rates of patient derived xenograft (PDX) tumors causes high experimental noise.
A
uthor Man
uscr
ipt
A
uthor Man
uscr
ipt
A
uthor Man
uscr
ipt
A
uthor Man
uscr
ipt
Recent publications have suggested that aberrant RNA splicing is essential to the development and progression of certain malignancies (Dvinge et al., 2016). A putative regulator of this process is the arginine methyltransferase PRMT5. PRMT5 activity accounts for most of the symmetric dimethylation of arginine residues (SDMA) in mammalian cells (Stopa et al., 2015) with substrates acting in a wide variety of biological processes. For example, PRMT5 regulates transcription by targeting histones, nucleosome remodeling and co-repressor complexes, and numerous transcription factors. PRMT5 is thought to regulate splicing largely via its role as the enzymatic component of the methylosome, a multi-subunit complex that also contains PRMT5’s obligate binding partner, MEP50, and the co-factor pICln (encoded by CLNS1A and herein referred to as such). The methylosome modifies specific Sm-proteins to facilitate small ribonucleoprotein (snRNP) assembly (Battle et al., 2006; Chari et al., 2008). Consistent with this role, complete Prmt5 knockout (KO) is lethal to murine neural stem/progenitor cells and was reported to impair splicing (Bezzi et al., 2013). PRMT5 has recently emerged as a promising drug target, due to its frequent over-expression in a variety of malignancies (Stopa et al., 2015) as well as its synthetic lethal relationship with methylthioadenosine phosphorylase (MTAP) (Kryukov et al., 2016; Marjon et al., 2016; Mavrakis et al., 2016). Although PRMT5’s potential as a cancer therapeutic target is widely appreciated, there is still considerable debate about which of its numerous activities underlie the PRMT5 dependency of tumor cells.
The realization of splicing as a targetable process in cancer will require answering important questions: if splicing is an essential process in all cells, is there a therapeutic window in which splicing inhibitors would specifically target cancer cells? Alternatively, are there targetable forms of RNA splicing that are preferentially relevant to cancer cells? The complexity of the problem is intensified by the ongoing discovery of new splicing modalities such as detained introns (DIs). DIs occur within otherwise completely spliced and
polyadenylated transcripts but, in contrast to retained intron-containing transcripts, DI-containing pre-mRNAs remain in the nucleus (Boutz et al., 2015), where they are eventually post-transcriptionally spliced or degraded (Bresson et al., 2015; Yap et al., 2012). Notably, an increase in transcripts entering the DI pathway will result in reduced levels of productive coding mRNA. Intron retention has previously been observed to differentiate tumors from matched normal tissue (Dvinge and Bradley, 2015; Jacob and Smith, 2017).While there is extensive data showing that splicing processes are altered in cancer cells, little is known about how to target these processes in cancer patients.
In this study, we sought to develop a high-throughput screening approach to identify key GBM dependencies. We then aimed to use this information to elucidate the nature of these dependencies, to explore their druggability with inhibitors, to identify genetic factors influencing inhibitor sensitivity, and to define their role in normal brain development and biology.
Results
A pooled in vivo shRNA screen identifies PRMT5 as a key mediator of GBM growth
To establish the suitability of Gl261 for in vivo pooled shRNA screens, we generated mixed Gl261 populations in which a fraction of cells expressed Doxycycline (Dox) inducible
A
uthor Man
uscr
ipt
A
uthor Man
uscr
ipt
A
uthor Man
uscr
ipt
A
uthor Man
uscr
ipt
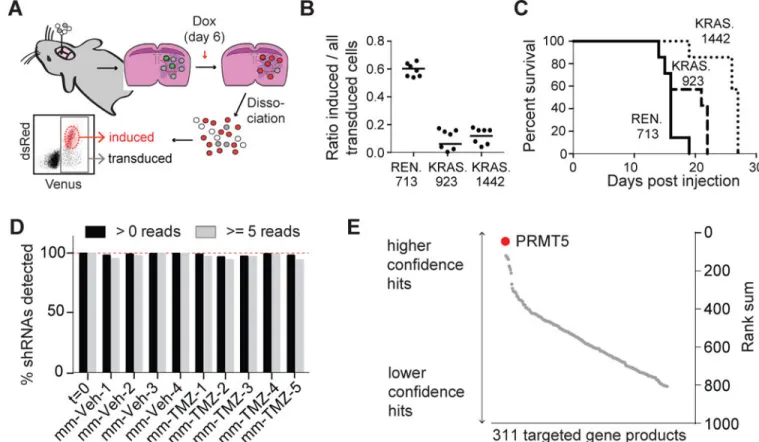
shRNA vectors targeting either KRAS, the driving oncogene of Gl261 cells (Newcomb and Zagzag, 2009), or Renilla luciferase (RLuc). Importantly, whereas transduced but uninduced cells only express the fluorophore Venus, upon Dox induction cells become positive for both Venus and dsRed, allowing assessment of both transduction and induction levels by flow cytometry. These cells were then injected into mouse brains to allow tumor engraftment, and shRNA expression was induced by oral Dox administration. Following mouse euthanasia and tumor dissociation, we assayed single-cell suspensions by flow cytometry to determine the proportion of transduced Venus+ cells expressing the shRNAs (Venus+ dsRed+, Fig 1A). The results were highly reproducible between replicates and showed a strong selection against cells expressing KRAS shRNAs, compared to consistently high induction levels of control shRNAs (Fig 1B, S1A,B). The observed selective pressure against KRAS shRNA-expressing cells was sufficient to increase median survival (Fig 1C). We also tested the feasibility of positive selection by overexpressing O6-methylguanine methyltransferase (MGMT), which confers resistance to Temozolomide (TMZ) (Hegi et al., 2005). We created mixed Gl261 populations in which a fraction of the cells overexpressed MGMT and found that the percentage of cells expressing MGMT was increased following TMZ exposure when compared to vehicle controls (Fig S1C,D). Thus, we can successfully score both negative and positive selection.
Another requirement for in vivo pooled screens is that neutral shRNAs are not subject to stochastic loss of library complexity or clonal outgrowth. To determine the library size that fulfilled these requirements, we performed limiting dilution experiments in which
progressively smaller fractions of the Gl261 cells were labeled with GFP. We compared GFP
+ cell representation before and after formation of intracranial tumors and found that 0.2%
GFP+ cells were detected in all end stage tumors but 0.02% GFP+ cells were not (Fig S1E), placing the maximal feasible in vivo library size between 500 and 5000 shRNAs (Fig S1F). The contributions of epigenetic regulators to GBM growth and therapeutic response are becoming increasingly appreciated (Rodríguez-Paredes and Esteller, 2011). Thus, we conducted our screen using a pooled shRNA library that targeted 312 epigenetic regulators. We included two validated KRAS shRNAs to serve as positive controls, and the pool was transduced into cultured Gl261 cells. A fraction of the infected cells was kept as the input control, and the remainder cultured in vitro or immediately used for intracranial injection into 28 C57BL/6J recipients. Both in vitro and in vivo samples were divided into two cohorts and treated with TMZ or vehicle control. Mice were sacrificed at morbidity, and those closest to the median survival (n=4 for vehicle and n=5 for TMZ) were used to generate tumor cell DNA. The in vitro samples were harvested at the corresponding median survival times. We amplified the integrated shRNA loci and identified shRNA distributions by next generation sequencing (Table S1). Our shRNA enrichment and quantification protocol did not introduce significant amounts of stochastic variation (Fig S1G). Moreover, the majority of our library was preserved in the in vivo samples, suggesting that we successfully avoided bottlenecking (Fig 1D, S1H). Additionally, we found that our pre-validated, positive control KRAS shRNAs were selectively depleted (Fig S1I–N). We then scored the total library shRNA changes (Fig S1I–N, Table S2). The majority of shRNAs targeting PRMT5 were depleted under all four conditions. By mathematically combining the
A
uthor Man
uscr
ipt
A
uthor Man
uscr
ipt
A
uthor Man
uscr
ipt
A
uthor Man
uscr
ipt
behavior of all shRNAs for each gene, we generated a gene level score and found that PRMT5 was the most significant hit (Fig 1E, S1O).
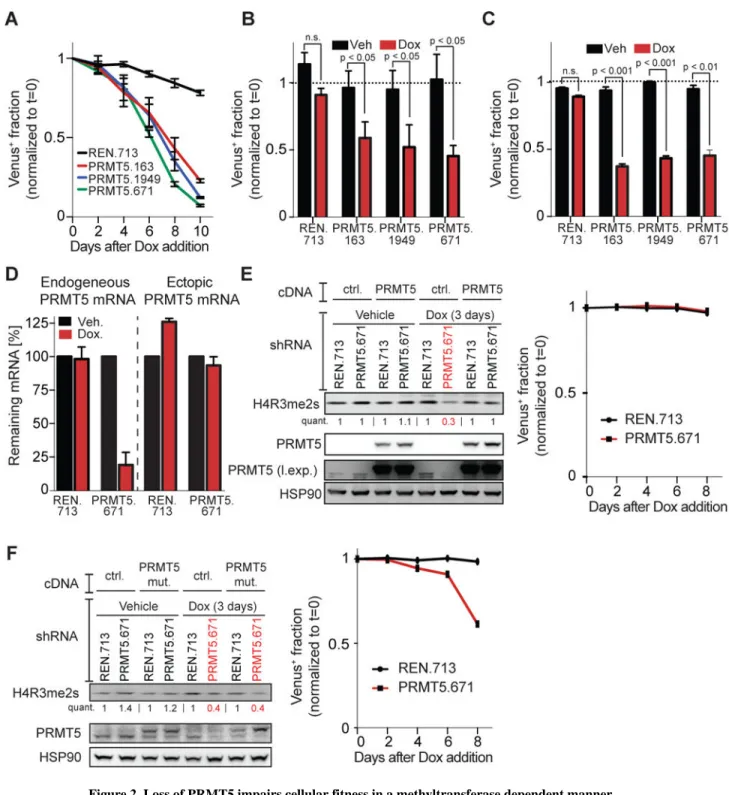
The enzymatic function of PRMT5 is essential for the proliferative fitness of GBM cells To validate the importance of PRMT5 for tumor cell proliferation and/or viability, we conducted in vitro single-shRNA competition experiments in a set of human GBM cell lines using Dox-induced expression of either a RLuc control or three different PRMT5 shRNAs. The latter significantly reduced PRMT5 mRNA and protein levels (Fig S2A, B). PRMT5 depletion was rapidly selected against, as indicated by the outgrowth of shRNA-negative cells after Dox addition (Fig 2A–C, S2C). To confirm that these phenotypes were PRMT5-dependent, and not shRNA off-target effects, we overexpressed a shRNA-resistant PRMT5 cDNA. This restored PRMT5 expression in the PRMT5 knockdown cells (Fig 2D,E). It also fully restored symmetrically dimethylated histone 4 arginine 3 (H4R3me2s), a known PRMT5-mediated histone mark (Yang and Bedford, 2012) (Fig 2E, S2D). PRMT5 cDNA expression did not further increase H4R3me2s levels above the wild-type background suggesting that endogenous PRMT5 levels are saturating. Most importantly, the PRMT5 cDNA completely abolished the depletion of PRMT5 shRNA-expressing cells in our competition assay (Fig 2E). We also expressed a mutant PRMT5 lacking two residues (Y304 & Y307) critical for substrate interaction (Antonysamy et al., 2012). This mutant restored PRMT5 protein levels in the shRNA expressing cells, but did not rescue either loss of H4R3me2 dimethylation or competitive depletion of the cells (Fig 2F, S2E). Thus, PRMT5’s enzymatic function is required for the persistence of GBM growth post-engraftment.
Inhibition of PRMT5 by EPZ015666 induces cell cycle defects and senescence
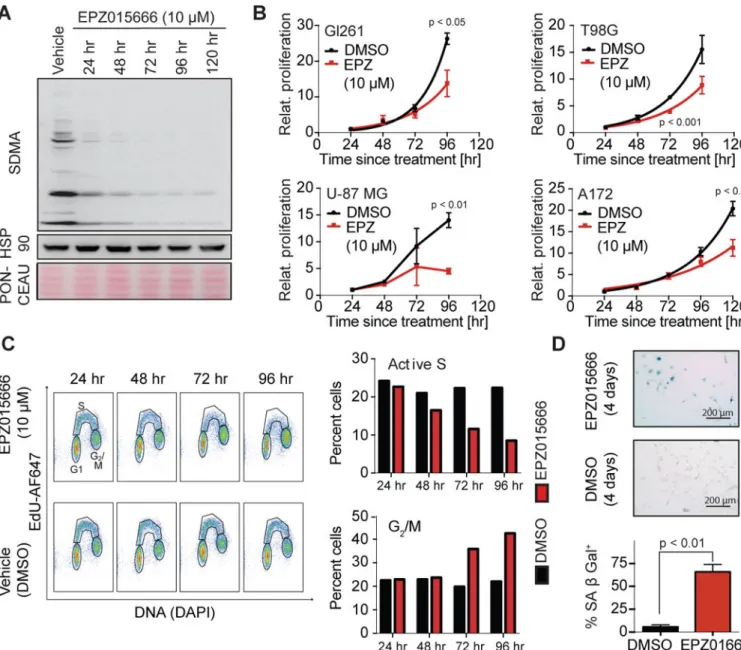
To further test the importance of PRMT5 for GBM growth, we used the PRMT5 inhibitor EPZ015666 (EPZ; Chan-Penebre et al., 2015). Treatment of U-87 MG cells with 10 µM EPZ yielded a dramatic reduction of SDMA marks (Fig 3A). EPZ treatment significantly suppressed the proliferation of several human GBM cell lines (Fig 3B). Studies in U-87 MG cells showed that this reflected loss of active S phase cells and accumulation of G2/M
populations (Fig 3C). EPZ did not induce apoptosis (judged by the absence of sub-G1 cells,
Fig 3C), even though U-87 MG cells possess wild-type TP53. Instead we saw induction of various senescence regulators (Fig S3) and most of the cells stained positive for senescence-associated (SA) β Gal (Fig 3D). Thus, PRMT5 inhibition results in potent suppression of glioma cell proliferation in vitro.
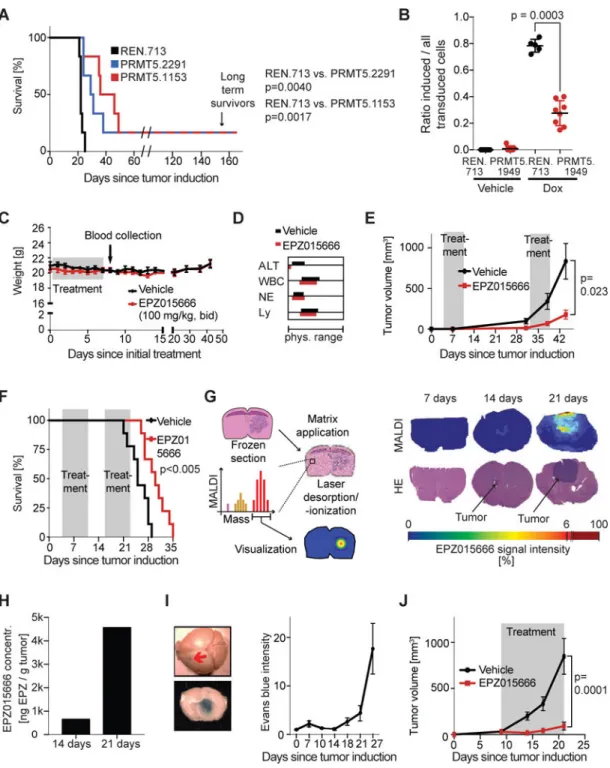
Genetic and pharmacological inhibition of PRMT5 impedes brain cancer growth in vivo We next tested the validity of PRMT5 as a therapeutic target in vivo. First, we constitutively expressed either a control RLuc shRNA or two independent PRMT5 shRNAs, which both yield partial PRMT5 mRNA knockdown (Fig S4A). Both PRMT5 shRNAs conferred a significant extension of lifespan to mice bearing intracranial Gl261 tumors (Fig 4A). Since the PRMT5 shRNAs were constitutively expressed, the survival benefit of PRMT5
knockdown could result from impaired tumor cell engraftment or suppressed tumor growth. To directly test the latter mechanism, we transduced U-87 MG cells with viruses allowing Dox-inducible expression of control or PRMT5 shRNAs and injected these intracranially into immunocompromised mice, activating shRNA expression 5 days later. The shRNAs
A
uthor Man
uscr
ipt
A
uthor Man
uscr
ipt
A
uthor Man
uscr
ipt
A
uthor Man
uscr
ipt
were not expressed in the absence of Dox, based on the absence of dsRed signal (Fig 4B). In the presence of Dox, we observed significant selection against expression of the PRMT5 shRNA in end-stage tumors, in contrast to high induction rates of the control shRNA (Fig 4B). Thus, PRMT5 deficiency is highly deleterious to GBM tumors.
Next we then assessed the in vivo impact of EPZ. Twice-daily administration of EPZ by oral gavage for seven days did not cause weight loss, increased liver serum transaminase levels or decreased peripheral blood cell counts (Fig 4C–D). Having ruled out toxicity, we then tested oral EPZ treatment on tumors. First, we subcutaneously injected U-87 MG cells into nude mice, allowed tumor cell engraftment, and treated the mice with EPZ or vehicle for two one week periods. Longitudinal tumor monitoring showed a significantly lower tumor volume in treated, versus control, animals post-treatment (Fig 4E). Moreover, after 10 days of
treatment, these tumors showed significant downregulation of KI67 and upregulation of Cleaved Caspase 3, as well as profound tumor fibrosis (Fig S4B–C). We next tested EPZ’s effect on intracranial U-87 MG tumors and found that EPZ yielded a significant lifespan extension (Fig 4F). However, EPZ seemed to yield less impressive benefits for U-87 MG intracranial tumors, than for U-87 MG subcutaneous tumors. Moreover, EPZ provided no detectable survival benefit for intracranial Gl261 tumors (Fig S4D), in stark contrast to the anti-tumorigenic effects of PRMT5 shRNAs in the same model (Fig 4A). We therefore hypothesized that the blood brain barrier (BBB) limits EPZ’s ability to access intracranial tumors. We used an in-silico algorithm to predict BBB permeability, and this analysis demarcated EPZ as a relatively poor BBB penetrator (Fig S4E). We then experimentally tested EPZ’s BBB penetration efficiency by treating animals bearing intracranial U-87 MG tumors with EPZ at various times post-implantation and quantifying EPZ uptake by matrix-assisted laser desorption ionization mass spectrometry imaging (MALDI-MSI) of frozen brain sections (Fig 4G). EPZ was not detected within the normal brain tissues and only accumulated in tumors that were highly advanced (Fig 4G, S4F–I), where it successfully achieved significant inhibition of PRMT5 function (judged by loss of H4R3me2s; Fig S4J). Drug uptake was not simply proportional to tumor burden, but showed a dramatic increase between 14 and 21 days post injection (Fig 4H). The likely cause of this late stage-specific uptake is a breach of the BBB, due to development of leaky tumor vasculature upon
neoangiogenesis. Accordingly, Evans Blue, a dye that is sequestered in the vasculature if the BBB remains intact (Leten et al., 2014), only accessed intracranial U-87 MG tumors at late stages (>21 days in this experiment; Fig 4I). Taken together, these data show that the BBB blocks uptake of EPZ, but the drug is able to access late stage tumors with a compromised BBB. Importantly, even short exposure to EPZ, late in tumor progression, is sufficient to achieve profound suppression of SDMA markers and significantly extend lifespan.
PDX models have become the gold standard for compound testing in oncology (Hidalgo et al., 2014). Thus, we also examined the effect of EPZ on the growth of subcutaneous
transplants of MGG8, a GBM PDX (Wakimoto et al., 2012). Continuous treatment with EPZ for 12 days, starting on day 9 after tumor cell transplantation, yielded cellular senescence (Fig S4K) and profound tumor suppression (Fig 4J). We therefore conclude that PRMT5 is a promising targetable vulnerability in GBM, and there is strong rationale for developing next generation PRMT5 inhibitors with increased BBB penetration.
A
uthor Man
uscr
ipt
A
uthor Man
uscr
ipt
A
uthor Man
uscr
ipt
A
uthor Man
uscr
ipt
RNA processing and splicing pathways emerge as potential resistance mechanisms to PRMT5 inhibition
PRMT5 is known to influence a wide variety of biological processes. However, there is still considerable debate as to which of these underlie the PRMT5 dependency of tumor cells. We used two unbiased and complementary approaches to address this key question. First, we compared the responses of various cell lines to EPZ and then identified gene expression patterns that correlated with sensitivity or resistance. For this, we treated 25 tumor cell lines from various tissue origins in triplicate with 11 different EPZ concentrations (ranging from 0.5 µM to 500 µM) and assayed response 120 hr post-treatment (Fig 5A, S5A). We calculated absolute half-maximal inhibitory concentrations (IC50), maximum drug effect
(Emax) and drug activity scores to capture the efficacy and potency of the drug (Fig 5B). The
highly reproducible responses identified both sensitive and resistant cell lines (Fig 5C), indicating that EPZ is not universally toxic. To identify the causative mechanism(s) for cellular drug resistance, we began by probing obvious candidates. First, we ruled out that drug-efflux pumps or drug metabolism were simply blocking PRMT5 inhibition by
demonstrating that EPZ successfully reduced SDMA marks in highly resistant cell lines (Fig S5B). Second, we examined MTAP-status, because MTAP deletion is synthetic lethal with PRMT5 knockdown, although not with PRMT5 inhibition by EPZ (Kryukov et al., 2016; Marjon et al., 2016; Mavrakis et al., 2016). Consistent with this latter finding, we saw no correlation between MTAP-status and EPZ sensitivity (Fig S5C). Third, we established that neither TP53 status, a common modulator of chemotherapeutic response, nor cell division rate were predictive of response (Fig S5C, D). Having ruled out these candidates, we undertook a systematic approach by examining transcriptome data available for 18 of our tested lines. We calculated Pearson correlation coefficients between the measured drug activity areas and individual gene expression levels across all 18 lines (Fig 5D, Table S3), and subjected the resulting rank ordered gene list to gene set enrichment analysis (GSEA). Gene sets associated with RNA-biology, RNA processing and splicing stood out in this analysis. These gene sets were strongly enriched at the bottom end of the ranked list (Fig 5E), suggesting that high expression of genes involved in RNA processing/splicing pathways correlates with resistance to PRMT5 inhibition.
We sought to identify a diagnostic gene signature that could predict relative responsiveness to EPZ. The splicing gene sets most strongly enriched by GSEA included snRNP
components that are well-known targets of the PRMT5 methylosome. Given this finding, we created a curated list of 59 genes that included those encoding core components of the spliceosomal complex, the SMN complex, the PRMT5 methylosome, and co-factors that determine PRMT5 substrate specificity. The expression levels of some of these individual genes showed a reasonable correlation or anti-correlation with EPZ response (data not shown). However, we hypothesized that a combination of two gene expression profiles might better predict sensitivity, particularly if the gene products functionally interact. Thus, we calculated pairwise expression comparisons for all 59 genes to yield 1711 expression profiles, which were used to calculate Pearson significance p values for their correlation with drug activity scores across our 18 cell lines. 301 of these ratios outperformed the predictive value of either of the contributing single genes (Fig 5F). Amongst these, one of the top hits was the CLNS1A to RIOK1 (C/R) ratio, where high C/R correlated with high
A
uthor Man
uscr
ipt
A
uthor Man
uscr
ipt
A
uthor Man
uscr
ipt
A
uthor Man
uscr
ipt
EPZ sensitivity (Fig 5G and H). The C/R ratio had higher predictive value than CLNS1A (r = 0.04, p=0.87) or RIOK1 (r = −0.43, p=0.075) alone, and even PRMT5 itself (r = −0.45, p=0.06). Notably, CLNS1A and RIOK1 are mutually-exclusive PRMT5 co-factors that direct PRMT5’s activity towards snRNP or ribosomal biogenesis, respectively (Guderian et al., 2011). The correlation between a high C/R ratio and increased EPZ sensitivity strongly suggests that sensitive tumor cells have limiting PRMT5 activity, which is preferentially directed towards the spliceosome.
To directly test the diagnostic value of the C/R ratio, we used gene expression data for previously untested cell lines to calculate their C/R ratios and thus predict their
responsiveness (Fig S5E). We selected 11 lines and experimentally determined their EPZ activity scores, revealing a strong correlation with these predictions (Fig 5I). Furthermore, knockdown experiments in two different cell lines showed that these factors both have determinative roles. Specifically, CLNS1A knockdown (Fig S5F) increased sensitivity to EPZ (Fig 5J and S5G), suggesting that CLNS1A downregulation causes less PRMT5 activity to be directed towards spliceosome biogenesis, thereby reducing splicing capacity (Fig 5H). Accordingly, RIOK1 knockdown (Fig S5F) decreased EPZ sensitivity (Fig 5J and S5G), presumably by shifting PRMT5 activity towards spliceosome biogenesis. Collectively, our data suggest that EPZ-sensitive cells have lower expression levels of splicing-associated genes, and maintain a higher C/R ratio to direct limiting PRMT5 activity towards
spliceosomal functions. Essentially, these cells appear to be addicted to splicing.
Pharmacological PRMT5 inhibition primarily reduces the expression of productive gene isoforms by promoting intron detention
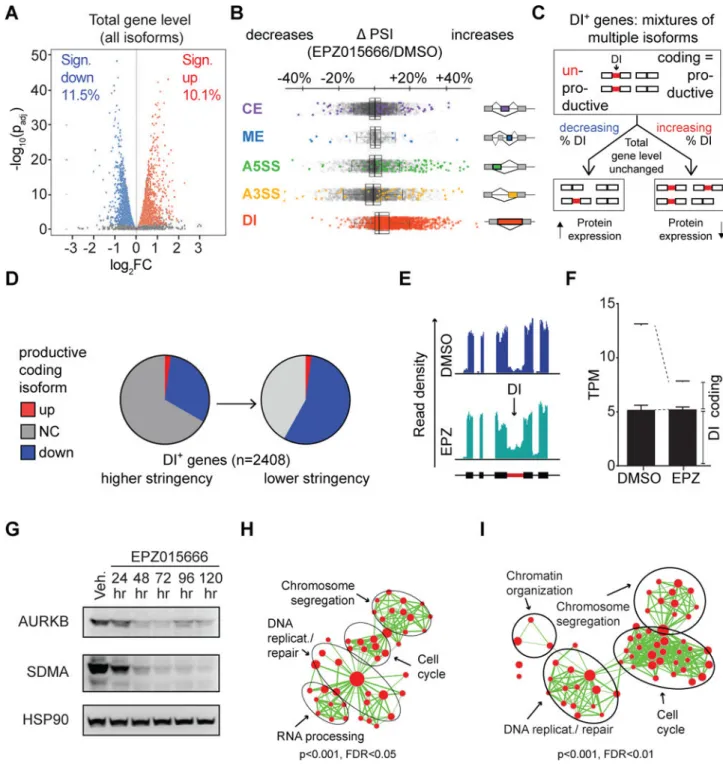
As a parallel approach to determine how PRMT5 inhibition achieves tumor suppression, we compared the gene expression patterns of U-87 MG cells treated with EPZ or vehicle for 72 hr. Using standard approaches to detect changes in the total levels of gene transcripts irrespective of splicing variants (counting reads falling within exons), we found that many expressed genes exhibited significant [Posterior Probability of Differential Expression (PPDE) > 0.95; FDR-adjusted p value < 0.05] downregulation (11.5%) or upregulation (10.1%) in response to EPZ (Fig 6A, S6A–C). We then screened for EPZ-associated changes in splicing patterns. Unexpectedly, PRMT5 inhibition had little influence on the relative representation of canonical alternative splicing (AS) isoforms (Fig 6B, S6D; significant events shown in color).
In stark contrast to other AS events, we found that the splicing of detained introns (DIs) was profoundly perturbed by PRMT5 inhibition. In toto, we identified 3801 DIs distributed across 2408 individual genes in our samples. Of these, 1619 (43%) reached statistical significance (FDR-adjusted p value <0.05) for differential splicing following EPZ treatment. Importantly, the vast majority of these DIs (1557, or 96%) were significantly upregulated following PRMT5 inhibition (Fig 6B, S6D). Thus, the dominant effect of PRMT5 inhibition on splicing is to decrease the splicing efficiency of many DIs (see Fig S6E, F).
Transcripts with DIs are trapped in the nucleus and thus remain untranslated until their eventual decay (Boutz et al., 2015). Consequently, increased levels of DI-containing
transcripts result in reduced levels of productive isoforms and thus encoded proteins. Despite
A
uthor Man
uscr
ipt
A
uthor Man
uscr
ipt
A
uthor Man
uscr
ipt
A
uthor Man
uscr
ipt
this fact, exon reads from DI-containing transcripts are typically included in the measured transcript pool of a gene. To assess the level of transcripts productive for protein synthesis for each gene, we corrected our data by removing DI-isoforms from the gene expression calculation (Fig 6C). This identified 750 genes whose coding isoforms were significantly downregulated by EPZ (PPDE< 0.95; Fig 6D, left pie chart). A less stringent cutoff (DI-containing genes with a consensus coding isoform drop ≥ 10%, Fig S6G) identified an additional 597 genes that were downregulated at the coding isoform level (Fig 6D, right pie chart; Fig S6H). This raised the total number of downregulated DI-containing genes to 1347, representing more than 55% of all DI-containing genes. In contrast, total transcript
quantification without correction for isoform composition resulted in only 171 of the 2408 DI-containing genes meeting the statistical cutoff for up- or down-regulation upon PRMT5 inhibition (Fig S6H, leftmost pie chart). This underscores the importance of considering the contributions of productive isoforms for gene expression quantification, and unveils a profound effect of DI regulation on productive mRNA levels. The changes observed with the mitotic spindle regulator kinase AURKB illustrate this point: EPZ decreased the total AURKB transcript levels by 30%, but after removing non-productive DI-containing transcripts, the productive coding isoform was actually decreased by more than 80% (Fig 6E, F).
To establish the robustness of this PRMT5-DI connection, we assayed additional representative genes for DI-inclusion, and also transcript and protein levels. qRT-PCR analyses of both AURKB and the translation initiation factor EIF4E confirmed that the levels of unproductive DI-containing transcripts were increased relative to the total transcript pool in response to either pharmacological or genetic PRMT5 deficiency (Fig S6I–L). Importantly, this resulted in reduced levels of both AURKB and EIF4E proteins (Fig 6G, Fig S6I–K). We also detected an increased ratio of DI-containing transcripts to total transcripts, and/or a reduction in protein levels for RAF1, TRIO, DNA2, RPS6KB1, FBXO18, SOS1, and STAT5B (Fig S6M, N). Additionally, we observed an increased ratio of DI-transcript to total transcript for AURKB, EIF4E and RAF1 in vivo following EPZ treatment of PDX tumors (Fig S6O). Notably, single-gene in vitro competition assays showed selection against cells harboring knockdown of AURKB or another DI-regulated gene, FGFR1 (Fig S6P). Thus, for two different genes within our DI-regulated set, depletion of even a single gene is sufficient to confer a proliferative disadvantage to GBM cells.
A prior study reported that genetic KO of Prmt5 in murine neuronal progenitor cells (NPCs) resulted in several hundred AS changes and also noted a general accumulation of reads within introns without further investigation of their identity (Bezzi et al., 2013). This raised the question of whether genetic loss of Prmt5 also perturbed DI splicing. To address this, we quantified significant splicing differences affecting canonical AS events versus DIs within the murine NPC Prmt5 KO data set. The results of this analysis were consistent with EPZ-treated human GBM cells. While ~200 canonical AS events were significantly altered in the KO cells compared to wild-type controls, these affected events represented only a small percentage (1–5%) of all AS variants detected in these cells. In contrast, and again consistent with the effects of the PRMT5 inhibitor, DI splicing was profoundly disrupted in the Prmt5 KO cells with 1755 DIs (or 38.4%) being affected (Fig S6Q). Taken together, our analyses show a predominant upregulation of DIs in vitro and in vivo in response to depletion of
A
uthor Man
uscr
ipt
A
uthor Man
uscr
ipt
A
uthor Man
uscr
ipt
A
uthor Man
uscr
ipt
PRMT5 via pharmacological inhibition, siRNA-knockdown or genetic ablation that is conserved across different species.
The PRMT5-DI axis affects genetic regulators of proliferation
DIs are frequently phylogenetically conserved and exhibit cell-type and context-dependent changes in splicing efficiency, suggesting that they are regulated events rather than splicing errors (Boutz et al., 2015). Indeed, many DIs affected by PRMT5 depletion are already observed at significant levels in untreated human U-87 MG and wild-type murine NPC cells, indicating that PRMT5 inhibition acts to increase levels of existing DIs rather than causing de novo splicing changes. These findings raised the possibility that DI-containing genes are regulated as part of a coherent biological program. To address this question, we identified the functional categories of DI-containing genes within our complete data set from both control and drug-treated cells. This analysis revealed a highly significant enrichment for genes involved in cell cycle progression, chromosome segregation, RNA biology and DNA repair (Fig 6H). Moreover, DI-regulated genes in the murine NPC data set were similarly enriched in proliferation-associated gene sets (Fig S6Q). This strongly suggests that DIs play a role in the coordinate regulation of specific functional gene expression programs, which is conserved across species.
It is important to note that PRMT5 inhibition also alters the expression levels of non-DI containing genes. To gain further insight into the broader functional consequences of PRMT5 inhibition, we also performed pathway enrichment analysis for all genes downregulated by EPZ treatment of U-87 MG cells i.e., both DI-containing genes, after correcting for isoform-specific effects, and non-DI containing genes (Fig 6I). We found gene sets associated with cell cycle, DNA replication, and chromosomal segregation to be significantly downregulated upon PRMT5 inhibition, suggesting that PRMT5 inhibition affects DI-containing and non DI-containing genes that function in a coherent gene expression program strongly associated with cell cycle regulation (Fig S6R). Prmt5 KO in murine NPCs yielded similar results (Fig S6Q). Moreover, qRT-PCR analysis of 18 different proliferation genes confirmed coordinated downregulation in response to EPZ treatment (Fig S6C). In contrast to the downregulated genes, few upregulated genes were affected by DI inclusion, and therefore the vast majority of gene expression changes (93%) were identical whether we corrected for productive isoforms or not (Fig S6S). Pathway enrichment analysis of upregulated genes identified programs associated with cell and organ development, not proliferation (Fig S6S). Taken together, our data indicate that depleting PRMT5 activity causes dramatic down-regulation of cell cycle regulators through two distinct mechanisms: it promotes intron detention and thereby reduces the levels of the productive coding isoforms for a large fraction of DI-containing genes and it reduces the mRNA levels of many other genes either indirectly, or through a DI-independent mechanism. The overwhelming impact on cell cycle genes is consistent with the anti-proliferative effects of PRMT5 suppression. Weak 5′ splice sites are a frequent feature of PRMT5-dependent introns but are
insufficient to determine selectivity
Our data indicate that PRMT5 inhibition has significant selectivity for a subset of DIs, rather than affecting splicing in general. This raises questions about the underlying mechanistic
A
uthor Man
uscr
ipt
A
uthor Man
uscr
ipt
A
uthor Man
uscr
ipt
A
uthor Man
uscr
ipt
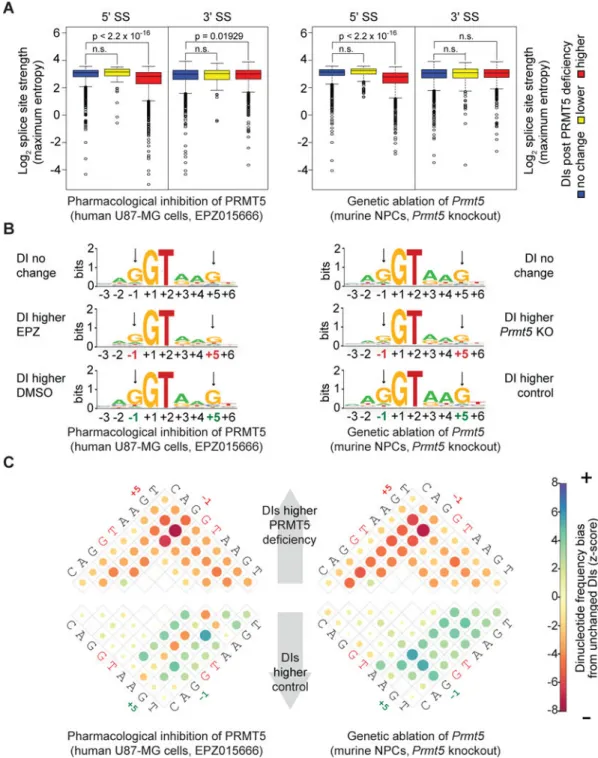
bases for this specificity. Thus, we asked whether DIs that are upregulated upon EPZ treatment exhibit genomic features that distinguish them from DIs with constant or decreased levels. We examined 5′ and 3′ splice sites because these tend to be weaker for DIs than other introns (Boutz, et al. 2015), and weak 5′ splice sites have previously been reported to be associated with PRMT5-dependent splicing changes (Bezzi et al., 2013; Sanchez et al., 2010). On a population basis, DIs upregulated by either PRMT5 inhibition or Prmt5 KO were found to have significantly weaker mean 5′ splice site scores than DIs that were not upregulated (Fig 7A). Despite this general tendency, there was not an absolute correlation between 5′ splice site strength and sensitivity to PRMT5 deficiency. Specifically, some individual DIs possessed weak 5′ splice site scores without being upregulated by PRMT5 deficiency, and some of the PRMT5-sensitive DIs had stronger 5′ splice sites than unaffected DIs (Fig 7A, S7A). Additionally, canonical AS events such as cassette exons were rarely affected by PRMT5 deficiency even though they often had similar 5′ splice site scores to PRMT5-affected DIs (Fig S7B). Thus, despite being a frequent feature of PRMT5-dependent DIs, weak 5′ splice sites scores are neither necessary nor sufficient to define PRMT5 dependency of individual introns. We looked more specifically at the sequence features of the 5′ splice sites, asking whether the co-occurrences of specific nucleotides were enriched or depleted in DIs that are increased by PRMT5 deficiency versus DIs that are not (Fig 7B, C and S7C). The most striking difference was an
underrepresentation of 5′ splice splices bearing Gs at both the −1 and +5 positions. Notably, these sequence features are conserved between PRMT5-affected DIs in human GBM cells and murine NPCs suggesting that they are under positive selective pressure. We also considered 3′ splice site strength, and found that on a population basis this was either not significantly different (for Prmt5 KO), or modestly, but significantly, higher (for PRMT5 inhibition) for PRMT5-depedent DIs (Fig 7A). This suggests that 3′ splice site strength is not a major determinant of PRMT5 sensitivity, but does not rule out the possibility that weak 3′ splice sites may contribute to the sensitivity of individual DIs, and/or that other genomic features, such as the branchpoint region or flanking exonic or intronic splicing enhancers that lack consensus sequences and are therefore difficult to define computationally, might also play key roles.
PRMT5 is involved in the assembly of snRNP complexes (Chari et al., 2008). Moreover, the underrepresentation of Gs at positions −1 and +5 of the 5′ splice site might be expected to weaken basepairing with the snRNAs, which is critical for spliceosome assembly and catalysis. Given these issues, we hypothesized that PRMT5 sensitivity might result from a reduction in the biogenesis or steady-state levels of snRNPs. Consistent with the known role of PRMT5, we found that EPZ treatment caused rapid loss of SDMA marks of the Sm proteins SNRPB and SNRPD3 (Fig S7D, E). However, this had no detectable impact on either the levels or nuclear/cytoplasmic localization of spliceosomal snRNAs (Fig S7F). Thus, the ability of PRMT5 deficiency to impair the splicing of DIs is not a simple consequence of impaired biogenesis of individual snRNP complexes.
A
uthor Man
uscr
ipt
A
uthor Man
uscr
ipt
A
uthor Man
uscr
ipt
A
uthor Man
uscr
ipt
PRMT5-associated intron detention represents a regulated biological process engaged during cellular differentiation
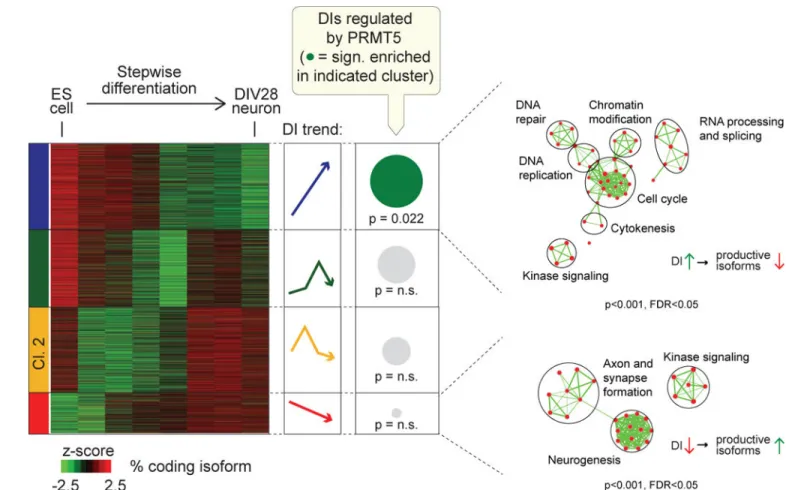
Our finding that PRMT5 deficiency primarily affects DIs that are enriched within proliferation regulators in both mouse and human cells argues for the existence of a coordinated and regulated splicing program under the control of PRMT5. We hypothesized that such a program might be engaged during terminal differentiation. To test this, we turned to a published RNA-seq data set tracking in vitro neurogenesis from mouse embryonic stem cells to >95% mature glutamatergic neurons (Hubbard et al., 2013). We analyzed PRMT5 mRNA levels and found that these declined progressively during the neuronal differentiation process (Fig S8A). We then tracked genome-wide changes in the ratios of coding isoforms to DI-containing isoforms at each time point and identified four distinct clusters (Fig 8, Table S6). Cluster 4 showed increased intron detention and consequent reduction of productive coding transcripts as the cells proceeded through the differentiation process. Importantly, this gene cluster exhibited a strong functional enrichment for cell cycle
regulators. The remaining three gene clusters displayed significant enrichments for gene sets that were unrelated to cell cycle or proliferation (Fig 8, S8B). Intriguingly, cluster 3 showed a reduction in the level of DIs and consequent increases in the levels of coding isoforms as the cells moved towards differentiation and the affected genes were strongly associated with neuronal identity (such as axonal and synaptic genes).
We then directly compared the DI-containing genes in this differentiation data set with those identified in our analysis of the Prmt5 KO in murine NPCs. In particular, we focused on the group of DIs that were significantly upregulated by Prmt5 loss in NPCs (herein referred to as PRMT5-regulated DIs) and asked how these were distributed across the four
differentiation clusters. We found that PRMT5-regulated DIs mapped to all four clusters, but only exhibited statistically significant enrichment in the proliferation-associated Cluster 4. Collectively, these data suggest that the splicing of sets of DIs is differentially regulated during neuronal differentiation, thereby cooperating with transcriptional changes to coordinate cell cycle exit and terminal differentiation. Specifically, steady reduction in PRMT5 levels from ES cells to mature neurons is mirrored by suppression of proliferation genes via upregulation of their constituent DIs. In concert, DI levels are reduced in genes involved in the neuronal differentiation program, enabling their expression. We hypothesize that the strong upregulation of PRMT5 mRNA levels in malignant gliomas (Fig S8C) is phenocopying the high levels of PRMT5 mRNA in stem cells to enable their proliferative capacity.
Discussion
PRMT5 has recently come into focus as a highly promising cancer target due to its overexpression in many cancer types and the finding that its depletion is tumor suppressive in many of these settings (Stopa et al., 2015; Yang and Bedford, 2012). This appreciation has created strong impetus to understand the underlying bases of PRMT5’s oncogenic activity. Our data strongly suggests that splicing regulation is a, if not the, major component of PRMT5’s oncogenic activity. Specifically, our broad and unbiased tumor cell line screen led to the conclusion that limited splicing capacity creates a vulnerability for PRMT5 inhibition.
A
uthor Man
uscr
ipt
A
uthor Man
uscr
ipt
A
uthor Man
uscr
ipt
A
uthor Man
uscr
ipt
Indeed, we believe that PRMT5 inhibitor-sensitive cells are essentially addicted to splicing. This conclusion is reinforced by the finding that a high CLNS1A/RIOK1 ratio predicts PRMT5 inhibitor sensitivity and that knockdown of these factors can render cells more sensitive (CLNS1A) or more resistant (RIOK1) to EPZ treatment. This suggests that PRMT5’s activity is highly skewed towards spliceosomal targets in sensitive cells and that inhibition of PRMT5 diminishes splicing capacity in a manner that impedes tumor maintenance and progression. Importantly, our data argue that the C/R ratio can serve as a molecular biomarker to predict sensitivity to PRMT5 inhibition. A major challenge in cancer therapy is the high frequency with which targeted therapeutics fail to demonstrate efficacy in clinical trials, despite promising pre-clinical results (Braun and Hemann, 2016). It is possible that the C/R ratio can be used to predict patient response to PRMT5 inhibitors. Although there is a widespread perception that introns within polyadenylated transcripts are simply a consequence of splicing errors, recent studies have raised the possibility that such introns are regulatory units (Boutz et al., 2015; Braunschweig et al., 2014). We consider the PRMT5-DI program to be a bona fide physiological mechanism. First, DIs are seen at significant levels in normal cells, i.e. without inhibition or mutation of splicing regulators and they are well conserved between mouse and human. Second, our data show that DIs are highly enriched in proliferation regulators and changes in DI inclusion result in the
coordinate downregulation of cell cycle genes, which accounts for the proliferative impairment of PRMT5-deficient tumors. Finally, during normal neuronal differentiation, PRMT5 levels are progressively reduced and the inclusion of DIs within many genes including proliferation regulators increases, resulting in reduced expression levels, as the cells move towards the post-mitotic state. This suggests that the frequent upregulation of PRMT5 in tumor cells acts to co-opt the developmental PRMT5-DI axis to enhance DI splicing and enable tumor cell proliferation.
How is PRMT5 deficiency selectively targeted to particular DIs while rarely affecting other classes of introns? Given PRMT5’s known role in Sm protein methylation and snRNP assembly, our initial hypothesis was that PRMT5 deficiency would deplete the pools of snRNAs, which in turn might negatively, and selectively, impact the splicing of introns with the “weakest” recognition sequences. However, we do not detect any significant reduction in the levels or nuclear accumulation of snRNAs. This does not rule out the possibility that PRMT5 deficiency somehow alters the assembly or function of the mature spliceosome. Indeed, we favor the idea that PRMT5 loss disrupts the biogenesis and/or recycling of tri-snRNP complexes that are critical for the splicing process, perhaps via changes at Cajal bodies, of which several constituent components possess, or recognize, SDMA marks (Boisvert et al., 2002). However, extensive additional analyses will be required to test this hypothesis. Our data clearly identify weak 5′ splice sites as a frequent feature of PRMT5-regulated DIs. Additionally, we determined that there is a general under-representation of 5′ splice sites with Gs at both the −1 and +5 positions in PRMT5-sensitive introns. However, these features are not sufficient to explain PRMT5 dependency. Many DIs, and also most cassette exons, are immune to the effects of PRMT5 deficiency despite exhibiting these features. Thus, we hypothesize that other splicing regulators expressed at different
developmental stages will work in concert with the weak 5′ splice sites to achieve complex splicing patterns such as the ones observed during neuronal differentiation.
A
uthor Man
uscr
ipt
A
uthor Man
uscr
ipt
A
uthor Man
uscr
ipt
A
uthor Man
uscr
ipt
It is becoming apparent that core spliceosome components are frequently mutated in cancer and that splicing factors hold great promise as therapeutic targets (Lee and Abdel-Wahab, 2016). It is tempting to speculate that all tumor cells require a mechanism to circumvent the regulatory processes that restrain efficient splicing in non-proliferative, post-mitotic cells. Upregulation of PRMT5 is one way to achieve this goal, potentially as a cause or
consequence of acquiring a more stem cell-like state. We anticipate that other mutations will impinge on DI regulation, in a similar manner to PRMT5 upregulation. These will offer additional or alternate therapeutic targets, beyond PRMT5, to broaden the treatment options for GBM, as well as other tumor types.
STAR METHODS
CONTACT FOR REAGENT AND RESOURCE SHARING
Further information and requests for resources and reagents should be directed to and will be fulfilled by the Lead Contact, Jacqueline A. Lees (jalees@mit.edu).
EXPERIMENTAL MODEL AND SUBJECT DETAILS
In vivo tumor models—Gl261 and U-87 MG cells were injected into the left cerebral hemispheres of 7 to 9 week old female C57BL/6J (The Jackson Laboratory, 000664) or female NCr nude mice (Taconic, NCRNU-F) performed in close analogy to previously described methods (Ozawa and James, 2010). Subcutaneous injections of U-87 MG and MGG8 cells lines were performed by carefully lifting up the flank skin of NCr nude mice and injecting a sterile cell/PBS suspension (106 cells in 100 µl) into the subcutaneous space. Mice were observed daily for the development of tumors. Treatment was initiated when roughly 50% of mice had developed palpable subcutaneous tumors. For experiments with multiple treatment groups, mice were randomly distributed across experimental cohorts. Dimensions of subcutaneous tumors were estimated by repetitive caliper measurements. Tumor volume was calculated with the following formula: Volume = length × width × height × 3.14/6. All mouse experiments were approved by MIT’s committee on animal care (CAC) prior to execution. We confirm that all experiments conform to the relevant regulatory standards.
Cell lines—Gl261 murine glioma cells were a kind gift from David Zagzag (New York University) and were cultured in DMEM complete medium (90% DMEM/10%FBS). U-87 MG (ATCC HTB-14), T98G (ATCC CRL-1690), PANC-1 (ATCC CRL-1469), U-2 OS (ATCC HTB-96), HCT-116 (CCL-247), Foreskin fibroblasts CCD-1112Sk (ATCC CRL-2429), A172 (ATCC CRL-1620), LN229 (ATCC CRL-2611), C2BBe1 (ATCC
CRL-2102), LN-18 (CRL-2610) and U138 (ATCC HTB-16) cells were acquired from ATCC and grown in DMEM complete medium. HEK293T cells were a kind gift from Piyush Gupta (Massachusetts Institute of Technology) and were propagated in DMEM complete medium. NGP, ACN, KELLY, SKNAS, LAN-1 and BE(2)-C cells were gifts from
Alexandre Puissant and Kimberly Stegmaier (Dana-Farber Cancer Institute) and were kept in DMEM complete medium. MCF-7 (ATCC HTB-22) cells were acquired from ATCC and kept in EMEM media supplemented with 10% FBS and 0.01 mg/l bovine insulin (Sigma, I6634). WM2664 (ATCC CRL-1676), SKMEL2 (ATCC HTB-68) and MEWO (ATCC
A
uthor Man
uscr
ipt
A
uthor Man
uscr
ipt
A
uthor Man
uscr
ipt
A
uthor Man
uscr
ipt
HTB-65) cells were acquired from ATCC and cultured in EMEM medium supplemented with 10% FBS. ZR-75-1 (ATCC CRL-1500) cells were acquired from ATCC and kept in RPMI supplemented with 10% FBS. T47D (ATCC HTB-133) cells were acquired from ATCC and kept in RPMI supplemented with 10% FBS and 0.2 U/mL bovine insulin (Sigma, I6634). OVCAR-8 cells were a kind gift from Madeleine Oudin and Frank Gertler
(Massachusetts Institute of Technology) and cultured in DMEM complete media. CAL-33 cells were acquired from DSMZ (ACC 447) and cultured in DMEM complete media. HT-29 cells were acquired from ATCC (ATCC HTB-38) and kept in McCoy’s 5a Medium
Modified supplemented with 10% FBS, HepG2 were acquired from the David H. Koch Institute core cell line collection bank and grown in EMEM media supplemented with 10% FBS. NCIH2009, SKLU1, NCIH460, A549, NCIH358 and Calu6 cells were kept in RPMI media with 10% FBS and were a kind gift of Jens Köhler and Pasi A. Jänne (Dana-Farber Cancer Institute). The human patient-derived xenograft line MGG8 was derived from a patient tumor at Massachusetts General Hospital (Wakimoto et al., 2012) and grown in Neurobasal medium (Life Technologies) supplemented with N2/B27, penicillin/
streptomycin (Life Technologies), GlutaMAX (Life Technologies), recombinant human EGF (20 ng/mL, R & D systems), and recombinant human FGF2 (20 ng/mL, R & D systems). METHOD DETAILS
In vivo competition assays—Mixed populations of tumor cells were transplanted intracranially as described above. ShRNA expression was then induced by Doxycycline administration at for all mice within the same experiment in parallel at the indicated times post tumor cell injection. Upon display of signs of morbidity, mice were euthanized and decapitated. Tumor tissue was liberated from the brain followed by preparation of a single-cell suspension employing a brain tumor dissociation kit (Miltenyi, #130-095-942) in combination with the gentleMACS dissociator (Miltenyi) according to the manufacturer’s instructions. Flow cytometry was conducted using BD Fortessa or BD LSR-II machines. Raw data was analyzed using FlowJo software v10 (Tree Star). The ratio of induced over non-induced cells was calculated by the following formula: (dsRed2+)/(mVenus+, dsRed2-).
ShRNA screen—GFP dilution assays were used as a surrogate for shRNA library sizes in order to establish a feasible library complexity for in vivo screens in the Gl261 model. In detail, Gl261 cells transduced at different percentages with a retroviral vector expressing GFP were injected into the brain of C57BL/6J mice. Upon onset of morbidity, mice were euthanized and tumors were dissociated. Percentage of GFP+ cells was estimated by flow cytometry. The relationship between the percentage of GFP+ cells in a mixed population and the modeled library size is: Library size = 1/GFP+ %.
The shRNA library was acquired from Transomic technologies and consisted of 2059 shRNAs targeting 311 epigenetics-related genes in a MSCV/LTR/mIR30/PGK/Puromycin/ IRES/green fluorescent protein (pMLP) retroviral vector. The library was then transferred into a MSCV/LTR/mIR30/SV40/green fluorescent protein (MLS) retroviral vector by EcoRI/XhoI liberation of the shRNA encoding regions and two shRNAs targeting KRAS were spiked in. Gl261 cells were then infected at low infection rates to avoid multiple infections per cell. Successfully transduced cells were later enriched by
fluorescence-A
uthor Man
uscr
ipt
A
uthor Man
uscr
ipt
A
uthor Man
uscr
ipt
A
uthor Man
uscr
ipt
activated cell sorting (FACS). After a brief in vitro expansion, cells were either injected into syngeneic C57BL/6J mice, distributed into 9 culture dishes (3 × in vitro vehicle control, 3 × in vitro low-dose temozolomide, 3 × in vitro high-dose temozolomide) or subjected to genomic DNA extraction for the t=0 days control. In vitro culture conditions were kept so that at least a 250 × shRNA representation was conserved at all times. Half of the mice were treated with either a single i.p. injection of temozolomide (Sigma) at 50 mg/kg BW on day 8 after cell injection or with the corresponding vehicle. On the same day, tissue culture cells were either treated with vehicle, a low dose of temozolomide (7.5 µM) or a high dose of temozolomide (10 µM). Mice were examined daily for clinical signs of tumor onset and were euthanized once they had reached established euthanasia criteria. In vitro samples were harvested when roughly 50% of the mice of the corresponding treatment or control mouse cohort had been euthanized. Tissue was flash-frozen in liquid nitrogen. Genomic DNA from both the tumors and the tissue culture samples was extracted using Trizol reagent (Sigma) followed by ethanol precipitation. Integrated shRNA viral vectors were then amplified from genomic DNA using HotStarTaq DNA Polymerase (Qiagen, # 203205).
The DNA integrity and quantity was determined on the Agilent 2100 Bioanalyzer (Agilent), followed by pooling of the multiplexed DNA fragments and sequencing with a HiSeq sequencer (Illumina). Non-normalized count numbers per shRNA were calculated by aligning the sequencing reads to the input shRNA library allowing for a single mismatch. The counts tables were then used as an input for the edgeR based shRNA-seq
bioinformatical tool for pooled shRNA screen analysis (Dai et al., 2014). Cell line screen statistical analysis
Cell line dosing and creation of dose-response-curves: The half maximal inhibitory concentration (IC50) and the maximum effect (Emax) were calculated using the Dr. Fit
software package (Di Veroli et al., 2015). Drug activity areas were calculated by summing up the individual differences between a measured activity at a certain drug dose and a fixed reference point of no activity similar to an approach taken in the Cancer Cell Line
Encyclopedia (CCLE, (Barretina et al., 2012)). Therefore, a drug activity area of 0
corresponds to an inactive drug, whereas an activity area of 11 corresponds to a drug with a complete activity at any concentration. TP53 gene mutation status was derived from literature, MTAP status was both derived from literature (where available) and tested by qRT-PCR.
Gene set enrichment analysis: For pathway enrichment analysis of cell lines with published transcriptome data, activity areas were Pearson-correlated to the level of individual gene transcripts across cell lines. Gene-centric RMA-normalized mRNA expression data was acquired from CCLE (http://www.broadinstitute.org/ccle, (Barretina et al., 2012)). The resulting ranked Pearson-correlation-score/gene transcript matrix was then used as an input for the pre-ranked list tool of gene set enrichment analysis (GSEA) (Subramanian et al., 2005). Enrichment scores were calculated for the following Molecular Signatures Database (MSigDB) collections: (1) CP:KEGG: KEGG gene sets (http:// www.genome.jp/kegg/pathway.html) and (2) CP:REACTOME: Reactome gene sets (http:// www.reactome.org/). Highlighted REACTOME splicing/mRNA processing data sets:
A
uthor Man
uscr
ipt
A
uthor Man
uscr
ipt
A
uthor Man
uscr
ipt
A
uthor Man
uscr
ipt
MRNA_PROCESSING,
PROCESSING_OF_CAPPED_INTRON_CONTAINING_PRE_MRNA, REACTOME_MRNA_SPLICING, REACTOME_MRNA_CAPPING, REACTOME_MRNA_SPLICING_MINOR_PATHWAY.
EPZ sensitivity biomarker derivation: We first created a curated list of 59 genes with core components of the spliceosome complex, the SMN complex, the PRMT5 methylosome and PRMT5 cofactors. We next calculated pairwise expression comparisons of these 59 genes yielding 1711 expression profiles. These expression profiles were then used to calculate Pearson significance p values for their correlation the drug activity scores across 18 cell lines.
Functional enrichment analysis for gene level changes and DIs—Functional enrichment analysis was performed utilizing either the publicly available DAVID functional annotation tool (https://david.ncifcrf.gov/) or GSEA gene set enrichment analysis (http:// software.broadinstitute.org/gsea/index.jsp). Gene set enrichment scores were calculated for the following gene sets:
CP:REACTOME: Reactome gene sets (http://www.reactome.org/) and CP:KEGG: KEGG gene sets (http://www.genome.jp/kegg/pathway.html).
Functional enrichment maps were generated by processing DAVID output files with the Enrichment map tool (Merico et al., 2010) for Cytoscape 3.4.0 (Shannon et al., 2003).
Functional enrichment analysis of genes affected by DIs in U-87 MG cells: We first identified genes harboring DIs and then ran DAVID functional enrichment using all expressed genes as a background control.
Functional enrichment analysis of gene level/coding isoform changes in U-87 MG cells following EPZ treatment: We first identified genes downregulated upon PRMT5 inhibition with EPZ in the corresponding stringency categories. We then ran DAVID functional enrichment using all expressed genes as a background control.
Functional enrichment analysis of genes affected by DI increase upon ES cell differentiation: We first identified genes harboring DIs and belonging to the indicated behavioral cluster. We next performed DAVID functional enrichment analysis using all genes expressed as a background control.
Nuclear/cytoplasmic fractionation and Northern blots—U-87 MG cells treated for 72 hr with DMSO or EPZ were harvested by trypsinization, washed and counted, and 5 million cells per sample were pelleted by centrifugation. Nuclear and cytoplasmic fractions were isolated using the NE-PER reagents (Thermo Fisher) according to manufacturer’s directions, except that the initial incubation step was performed for 8 min rather than the recommended 10 min. Nuclear and cytoplasmic RNA was extracted according to manufacturer’s directions using TRIzol-LS (Thermo Fisher) added directly to the final
A
uthor Man
uscr
ipt
A
uthor Man
uscr
ipt
A
uthor Man
uscr
ipt
A
uthor Man
uscr
ipt
lysates. Northern blotting protocols were adapted from published sources (Rio, 2014; Wu et al., 2013). Following purification of RNA, nuclear and cytoplasmic cell equivalents from 500,000 (for Sybr Gold staining) or 50,000 (for Northern blots) cells were loaded on a 10% acrylamide-urea/TBE gel. The gel was then stained with SYBR Gold (Thermo Fisher) and imaged, followed by transfer to a Hybond-N+ membrane (GE Healthcare). The membrane was crosslinked using a Stratalinker UV crosslinker (Stratagene), using the autocrosslink setting (120000 µJ for 1 min at 254 nM). The membrane was then blocked overnight at 42° C with rotation in DIG Easy-Hyb buffer (Roche) containing 1% w/v blocking reagent (Roche). Antisense DNA oligonucleotide probes were labeled at the 3′ end using terminal transferase (NEB) in the presence of digoxigenin-11-UTP (Sigma-Aldrich) for 10 min, then precipitated. After blocking, membranes were then incubated overnight at 42° C with 1nM each probe. The membrane was washed in 2X SSC/0.1% SDS (20X SSC: 3M NaCl, 0.3M trisodium citrate), 1X SSC/0.1% SDS, 0.1X SSC each for 15 min at 42° C. The membrane was then equilibrated in DIG buffer (0.1 M Maleic acid, 0.15 M NaCl, pH 7.5) and blocked for 30 min at room temperature in blocking buffer (DIG buffer containing 1% w/v Roche blocking reagent). The membrane was next incubated for 30 min at room temperature with 1:2000 dilution of alkaline-phosphatase conjugated anti-Digoxigenin Fab fragments (Roche) in blocking buffer. After 4X-10 min washes in DIG buffer + 0.3% Tween 20, the membrane was equilibrated in detection buffer (0.1 M Tris-HCl, 0.1 M NaCl, pH 9.5), then submerged in CDP-STAR reagent (Roche) for detection. For quantification, a SYBR Gold-stained gel containing three independently fractionated replicates was scanned and quantified using a Typhoon Trio with ImageQuant software (GE Healthcare) and the gel was aligned with the Northern blot to identify the correct bands representing each snRNA.
Western Blot—Proteins were extracted in RIPA buffer (Boston Bioproducts, #BP-115DG) and separated by SDS-PAGE. They were then transferred onto PVDF membranes and probed with antibodies against Symmetric Di-Methyl Arginine Motif/SDMA (Cell Signaling, #13222, MultiMab rabbit monoclonal antibody mix, 1:1000), HSP90 (BD, #610418, Clone 68, 1:10,000), PRMT5 (Cell Signaling, #2252S, 1:1000), GAPDH (Santa Cruz, #sc-365062, Clone G-9, 1:1000), SOS1 (Cell Signaling, #5890, 1:1000), STAT5B (Santa Cruz, #sc-1656, 1:200), RAF1 (Cell Signaling, #9422, 1:1000), AURKB/AIM1 (BD, #611082, Clone 6, 1:1000), SNRPB (Sigma, #HPA003482, 1:200), SNRPD3 (Sigma, #HPA001170, 1:200), SART3/TIP110 (Bethyl, #A301-521A, 1:10,000), PRP3 (MBL, #D171-3, 1:1000), SNRNP40 (MBL, #RN096PW, 1:1000), anti-H4R3me2s (Abcam, #5823, 1:500) and EIF4E (Cell Signaling, #9742, 1:1000). Proteins of interest were detected with HRP-conjugated α-Rabbit (Cell Signaling, #7074, 1:3000), Rat (Cell Signaling,
#7077,1:2000) and α-Mouse (Cell Signaling, #7076, 1:2000) antibodies and visualized with the Pierce ECL Western blotting substrate (Thermo Scientific) using the ImageQuant LAS 4000 imaging system (GE) or film exposure.
Cell cycle staining and flow cytometry—For cell cycle analysis, 5-ethynyl-2 ′-deoxyuridine (EdU) was purchase from Life Technologies (#E10187), suspended in DMSO and incorporated into cells at a concentration of 10 µM for 30 min. Cells were then
harvested by trypsinization, washed with PBS and fixed with ethanol. They were then permeabilized with ice-cold 0.25% TritonX100 in PBS for 15 min on ice, rinsed with 1%
A
uthor Man
uscr
ipt
A
uthor Man
uscr
ipt
A
uthor Man
uscr
ipt
A
uthor Man
uscr
ipt
BSA dissolved in PBS and stained with a Click-it reaction cocktail (Life Technologies, # C10269) according to the manufacturer’s instructions. Cells were then washed with ice-cold 0.25% Tritonx100 in PBS and stained with DAPI (Life Technologies, #D1306) at a final concentration of 1 µg/mL. In vitro competition assays were performed by noting the percentage transduced GFP+ on the day 0 and day 12 of doxycycline treatment. Flow cytometry was conducted using BD Fortessa, BD Canto, BD Celesta or BD LSR-II machines. Raw data was analyzed using FlowJo software v10 (FlowJo LLC).
Cell proliferation assays—CellTrace Far Red Cell Proliferation Kit (Life technologies, # C34564) was used for in vitro cell proliferation studies according to the manufacture’s manual. In brief, tissue culture cells were fluorescence dye stained for 20 min at 37°C in a tissue culture incubator, washed multiple times with serum containing sterile tissue culture medium and then incubated in the presence of EPZ or vehicle for multiple days. On the stated days, cells were trypsinized, washed and then subjected to flow cytometry (channel: APC-Cy7). The mean fluorescence of cells was noted and later normalized to the initial mean fluorescence at 24 hr after CellTrace labeling. The relative amount of proliferation for every time point was then estimated by calculating the reciprocal of the mean fluorescence fraction.
Cell line doubling time analysis—Cell line doubling time information was derived from the NCI60 screen and can be found at https://dtp.cancer.gov/discovery_development/ nci-60/publications.htm.
Senescence-associated (SA) β-Galactosidase Staining—Cells were fixed in 0.5% gluteraldehyde in PBS for 15 min at room temperature and then washed in 1mM MgCl2 in PBS. They were then stained in β-galactosidase staining solution (5 mM potassium ferrocyanide, 5mM potassium ferricyanide, 1 mg/ml X-Gal (Affymetrix, #10077) in PBS/1mM MgCl2), washed with water and overlaid with a 25% glycerol/water solution. Cells were imaged on an EVOS microscope (Life Technologies).
Vector generation—The following retroviral shRNA constructs were used: MSCV/LTR/ miR30/SV40/GFP (MLS), constitutive pRSF91-GFP-miRE and Doxycycline-inducible Tre/ dsRed/miRE/PGK/Venus/IRES/rtTA3 (RTREVIR). pRSF91-GFP-miRE was a kind gift of Adrian Schwarzer and Axel Schambach (MH Hannover, Germany), RTREVIR was a gift of Johannes Zuber (IMP Vienna, Austria). ShRNA target sequences are listed separately. A mouse MGMT cDNA vector was purchased from Origene (clone ID: MC202089), the protein coding DNA sequence was PCR amplified and ligated into the restriction-enzyme linearized retroviral vector pMIG. pMIG was a gift from William Hahn (Addgene plasmid # 9044). A DNA string encoding for a codon-optimized PRMT5 coding sequence (CDS) was synthesized (Gene Art Project, Thermo Fisher Scientific), PCR-amplified and cloned into the restriction enzyme linearized lentiviral vector pLJM1- by Gibson assembly to create pLJM1-PRMT5. pLJM1-EGFP was a gift from David Sabatini GFP (Addgene plasmid # 19319). A mutant PRMT5 CDS (p.Tyr304del, p.Tyr307del) lentiviral expression construct was created by PCR-based site-directed mutagenesis of pLJM1-PRMT5.
A
uthor Man
uscr
ipt
A
uthor Man
uscr
ipt
A
uthor Man
uscr
ipt
A
uthor Man
uscr
ipt
In vitro and in vivo Doxycycline treatment—Doxycycline powder was purchased from Clontech (#631311) and resuspended in water. Tissue culture cells were treated with a final concentration ranging from 1 µg/mL to 10 µg/mL (depending on the induction to toxicity profile of individual cell lines). Doxycycline was delivered in vivo by drinking water (1 mg/mL + 2% sucrose) or solid food pellet (purchased from Bio-Serv, #S3888)
supplementation.
In vitro EPZ sensitivity cell line screen—The PRMT5 inhibitor EPZ015666 was purchased from Selleck Chemicals (#S7748) and DC Chemicals (#DC8012). Compound integrity was controlled for every new batch by both Nuclear Magnetic Resonance (NMR) Spectroscopy and Matrix-assisted laser desorption/ionization (MALDI). EPZ was dissolved in DMSO. A 12-point EPZ dilution series (including the no-drug DMSO control point) was plated in a 96-well plate 2-fold dilution steps, starting at 500 mM. 100 nl of the compound solutions were pin-transferred (V&P Scientific, CA, pin tool mounted onto Tecan Freedom Evo 150 MCA96 head, Tecan, CA) into 96-well plates and incubated for 120h. Cells were seeded in 96-plates on the day prior to drug treatment. Seeding cell numbers were adjusted for different cell lines so that vehicle-treated wells reached sub-confluence 120 hr after vehicle treatment. The IncuCyte zoom microscope (Essen Bioscience) was used to estimate well confluence.
In vitro shRNA competition assays
To score influence factors on EPZ sensitivity: Tumor cells were transduced with the constitutive shRNA vector pRSF91-GFP-miRE. Mixed populations of transduced and untransduced tumor cells were then seeded out (day 0) and treated with 10 µM EPZ or DMSO (vehicle). Percentages of transduced cells were estimated by FACS 6 days after drug treatment. Fold-changes were calculated by: Fold change = GFP%EPZ/GFP%Vehicle.
To score depletion following shRNA knockdown: Tumor cells were transduced with the Doxycycline-inducible shRNA vector RTREVIR. Mixed populations of transduced and untransduced tumor cells were then seeded out and treated with Doxycycline at
concentrations stated above or vehicle (day 0). Cells were then cultured in the presence of vehicle or Doxycycline for the indicated time periods. Relative percentages of transduced cells were either estimated by FACS repetitively over the course of the experiment or at a single endpoint. The transduced Venus+ fraction of cells was then normalized for every time point to the fraction of Venus+ cells on day 0.
In vivo EPZ and Temozolomide drug treatment—The PRMT5 inhibitor EPZ was purchased from Selleck Chemicals (#S7748) and DC Chemicals (#DC8012). For in vivo treatment studies, EPZ was dissolved in 0.5% methyl-cellulose in water (10 mg/mL) and administered to mice every 12 hr by oral gavage (dose: 100 mg EPZ per kg body weight) for the indicated times. 0.5% methyl-cellulose in water administered per oral gavage was used as a negative control. Temozolomide was purchased from Sigma-Aldrich and administered by intraperitoneal injection at a dose of 50 mg/kg body weight.