Continental Deformation at Varying Spatial and Temporal Scales by Mousumi Roy B.S., Physics (1989) Stanford University M.S., Physics (1992) Boston University
Submitted to the Department of Earth, Atmospheric and Planetary Sciences in Partial Fulfillment of the Requirements for the Degree of
Doctor of Philosophy in Geophysics at the
Massachusetts Institute of Technology September, 1997
© 1997 Massachusetts Institute of Technology All rights reserved
Signature of Author . ... . .... ... . . . . ...
Department of E*11r, Atmospheric and Planetary Sciences August 11, 1997 Certified by ... .... . ... ... .. .. .. .. .. .
/ Leigh Royden
Professor of Geology and Geophysics Thesis Supervisor
Accepted by ... . ...
- *Thomas H. Jordan Department Head
Continental Rheology and Deformation at Varying Spatial and Temporal Scales
by
Mousumi Roy
Submitted to the Department of Earth, Atmospheric and Planetary Sciences in Partial Fulfillment of the Requirements for the Degree of
Doctor of Philosophy in Geophysics ABSTRACT
This thesis investigates continental deformation at many different spatial and temporal scales and at several plate-tectonic settings. Our main purpose is to understand how the continental crust behaves under applied forces, both over geologic times and over shorter time scales such as the seismic cycle. The thesis consists of separate investigations of long-term and short-term plate boundary deformation and also a two-part study investigating the interactions between deformation at these two time scales.
In the first part of the thesis we investigate the long-term flexural elastic response of the lithosphere to vertical loads due to normal faulting and extension. Our study suggests that high topography in the Stara Planina range in Central Bulgaria is probably related to flexural footwall uplift in response to Pliocene to Quaternary normal faulting in this region. In the second part we focus on small scale deformation on an individual brittle fault in the upper crust and study how frictional properties and constitutive behavior of the fault, described by laboratory-derived rate- and state-variable friction laws, govern the nucleation of earthquakes. The last part of the thesis investigates how the average rheologic properties of the crust govern deformation at a strike-slip plate boundary. In particular, we study the growth and evolution of fault networks within the upper crust over geologic times and how this process interacts with deformation at deeper crustal levels. Short time scale deformation such as sudden brittle failure on upper crustal faults is combined with long-term elastic and viscoelastic responses in the upper crust. Our results indicate that the rheology of the lower crust places strong controls on the nature and growth of fault networks at a strike-slip plate boundary.
Thesis Supervisor: Leigh Royden
Acknowledgments
First, my advisor Wiki Royden for her continuing support, encouragement, exacting criticism, and her insistence on understanding the essential physics of a problem using analytic models. This approach has rescued me many times after spinning my wheels helplessly in numerical details! For great discussions and for sharing her scientific insights (which generally took me clear across whatever my quandary happened to be; usually along a new, straighter path). For allowing me the freedom to explore and develop my own ideas, but providing guidance whenever I needed it. I realize the leaps of faith this must have entailed, and I will always be grateful for the freedom it gave.
Chris Marone for that first eye-opening seminar on earthquake mechanics which inspired me to delve into the fineries of friction beyond static and dynamic. For the chance to work with him on an exciting project (Chapter 3) and his continuing guidance, not just in scientific matters but also in the important realm of presenting my work. Finally, for the constant stream of journal articles and references he sends to his students (return to Room 711 or die).
Roger Buck, Brad Hager, and Maria Zuber for critical comments and great discussions on the thesis, particularly Chapters 4 and 5, and for sharing their enthusiasm and interest. Jim Rice and Renata Dmowska for stimulating discussions, fun seminars, and their always-open door to students. Clark Burchfiel, Kip Hodges and CJ Northrup for patiently guiding my introduction to the complexities of real rocks, in the field and in classes. Rob van der Hilst for the chance to lecture in his class for a week and for occasional chats about careers and families. Tom Jordan for his guidance in the early stages of my work in friction, his abiding interest, and infectious enthusiasm. Peter Molnar for taking the time to discuss my early, half-baked ideas on incorporating faulting into continuous models.
Students past and present who have shared their ideas, opinions, advice, silliness, and woes: Gretchen Eckhardt, Anke Friedrich, Carrie Friedman, Jim Gaherty, Allegra Hosford, Audrey Huerta, Yu Jin, Kelsey Jordahl, Steve Karner, Pete Kaufman, Kirsten Nicolaysen, Lana Panasyuk, Carolyn Ruppel, Gunter Siddiqi, Mark Simons, Odin Smith, Paula Waschbusch, and Helen Webb. Among them, Helen made the 8th floor feel like home and Yu Jin, with his great questions, kept me on my toes.
Across many borders, my parents for their curiosity and sense of adventure which instilled in me the nomadic urge to wander into realms unknown; in their words, Keep Walking! Their love is an enduring fact within everything I do. My sister Srabani for unselfishly enduring me and, most of all, for teaching me what it means to have a heart of gold. Her generosity preserved the scattered fragments of my life outside the thesis.
Finally, ineffably, Dinesh. Without whom life and learning would be an incredibly lonely journey, walking dull, and the effort to express inexpressible things, pointless.
Table of Contents
AbstractAcknowlegments Chapter 1. Introduction
Chapter 2. Flexural Uplift of the Stara Planina Range, Central Burgaria Introduction
Geologic Setting
Topography, Gravity and Deflection Data
Pliocene-Quaternary Flexure of a Uniform Rigidity Plate Flexure of a Two-Rigidity Plate
Discussion and Conclusions Acknowledgments
References Tables Figures
Chapter 3. Earthquake Nucleation on Model Faults With Rate and State-Dependent Friction: The Effects of Inertia
Introduction
Rate and State Variable Constitutive Laws Transition from Quasi-Static to Dynamic Slip Simulations Results Discussion Conclusions Acknowledgments References Figures
Chapter 4. Fault Systems at a Strike-Slip Plate Boundary (1) Introduction
Idealized Bulk Rheology and Brittle Failure Analytic Model of Crustal Deformation Discussion Conclusions Appendix Tables References Figures 52 53 55 57 61 62 66 72 73 74 81 101 102 103 105 114 115 117 120 122 124
5
Chapter 5. Fault Systems at a Strike-Slip Plate Boundary (2) 141
Introduction 142
Model of Crustal Deformation 143
Deformation of a High Viscosity Crust 147
Deformation in the Presence of a Low Viscosity Lower Crust 150
Discussion 155 Conclusions 158 Appendix 160 Tables 162 References 163 Figures 165
Chapter 1
Introduction
Patterns of deformation observed at the surface within continents are considerably more complex and variable than those in oceanic settings, due to inherent complexities of lithology and structure within the continental crust. Deformation within continents occurs on a wide range of length and time scales, but to study plate boundary deformation we focus on two classes of behavior: long spatial and temporal scale distributed deformation which occurs over geologic times (>100 km, >106 yr) and short spatio-temporal scale deformation, such as associated with the earthquake cycle. The first class of deformation includes, for example, flexural responses to plate loading and large-scale viscous flow in the lower crust, whereas the second includes localized seismic and aseismic faulting and distributed transient responses to stress accumulation between earthquakes.
The complexity of continental deformation, which involves many different length and time scales, does not allow straightforward interpretation of surface deformation patterns (e.g., topography, seismicity patterns, or strain rates observed using geodetic methods) in terms of the overall rheologic structure within continents. Using geodynamic models of the continental lithosphere, we explore the relationships between surface manifestations of deformation and the rheologic structure of the lithosphere at depth. In Chapters 2 and 3, we present separate investigations of long-term (geologic) and short-term (seismic) continental deformation which are highly simplified because we focus on a particular length and time scale.
Chapter 2 is a study of large-scale lithospheric flexure, used to model the broad features of surface deformation in the Stara Planina Range in central Bulgaria. The results of our modeling, in conjunction with geologic and geomorphologic arguments, suggest that
topography in the Stara Planina is not due to Mesozoic shortening events as previously believed, but is a result of Pliocene-Quaternary flexural uplift. We show that forces on the lithosphere due to unloading on Pliocene-Quaternary normal faults to the south of the range are sufficient to cause uplift of the Stara Planina and thus give rise to present-day topography. An extremely low effective elastic thickness of the lithosphere (~3 km) is required in this region to match observed topography, suggesting that the lithosphere beneath the Stara Planina is significantly weaker than beneath the Moesian platform to the north.
In Chapter 3 we present a model of the onset of frictional instability on faults during the pre-seismic (nucleation) phase of an earthquake. Frictional properties of brittle faults in the upper crust control the slip distributions on them and to a large extent govern the stress accumulations adjacent to the faults. We study one aspect of the slip distribution on faults, namely the amount and duration of slip prior to an earthquake, using a simple spring-slider model of a homogeneous fault. To model the frictional constitutive behavior of faults, laboratory-derived rate and state variable friction laws are used. By solving the equations of motion of the system coupled to the constitutive laws for friction, we derive an approximate definition of the onset of unstable slip. This definition allows us to identify the pre-seismic phase of motion and determine the role of friction constitutive parameters in governing the amount of pre-seismic slip.
While these studies illuminate various aspects of each class of deformation, in order to understand how the crust evolves in time, we need to include the interactions between the two classes of deformation. For example, although the broadest features of regional scale deformation may be described using a continuum model of the crust (e.g., a viscous fluid as in Buck, 1991 or Royden, 1996), long-term deformation at plate boundaries must involve the growth and evolution of large-scale brittle fault networks within the upper crust which may represent zones of significant strain localization. In particular, the evolution of
deformation must involve interactions between continuous deformation and new and old (pre-existing) zones of weakness such as faults.
Chapters 4 and 5 address these issues in an idealized model of a strike-slip plate boundary, focusing on the complexities which arise from the interaction of brittle faulting and continuous strain, and how such interactions are related to the strength profile of the crust with depth. We study the extent to which the continuum rheologic structure of the crust governs the nature and evolution of localized deformation within fault networks in the upper crust. For example, we investigate the effects of a weak lower crustal layer (which may undergo large-scale viscous flow) on the growth and dynamics of upper crustal brittle faults. First, a simple analytic model to determine the general character of the deformation is presented (Chapter 4) and second, a more detailed, numerical (finite-difference) approach (Chapter 5). In both parts a linear viscoelastic rheology is used for the crust and primarily elastic or primarily viscous behavior is specified at different crustal levels by varying the viscosity structure with depth. We represent faulting by static elastic dislocations, which are imposed when a critical stress threshold for failure (either fracture of a new fault or sliding on a pre-existing one) is exceeded. As we are interested here in the evolution of crustal deformation, we do not model mantle motions; instead deformation in both models is driven by imposed basal mantle velocities.
The main objective in Chapter 4, the analytic model, is to simplify the problem as much as possible in order to understand the coupling between deformation in the upper and lower parts of the crust. We therefore specify a fixed depth of faulting (confined to the uppermost crust) and divide the crust into two layers with different viscosities. By varying the viscosity of each layer and also the viscosity contrast between layers, we establish general controls on the width of the deformation zone at the surface and the number and spacing of faults in the upper crust. In Chapter 5 we allow variable depth of faulting, determined by stresses within the crust itself, and include the effect of far-field plate
motions by driving the model at the edges (in addition to basal velocities at the Moho). The viscosity of the crust is allowed to vary continuously with depth so that we specify a smooth transition from primarily elastic behavior in the upper crust to either primarily elastic or primarily viscous behavior in the lower crust. We study the time-evolution of deformation within the crust and the relation between surface deformation features such as episodic faulting and complex strain-rate patterns, and the deeper rheologic structure of the crust.
REFERENCES
Buck, R. W., Modes of continental lithospheric extension, J. Geophys. Res., 96, 20161-20178, 1991.
Royden, L. H., Coupling and decoupling of crust and mantle in convergent orogens: Implications or strain partitioning in the crust , J. Geophys. Res., 101,
Chapter 2
Flexural Uplift of the Stara Planina Range, Central Bulgaria'
ABSTRACT
The Stara Planina is an east-west-trending range within the Balkan belt in central Bulgaria. This topographically high mountain range was the site of Mesozoic through early Cenozoic thrusting and convergence, and its high topography is generally thought to have resulted from crustal shortening associated with those events. However, uplift of this belt appears to be much younger than the age of thrusting and correlates instead with the age of Pliocene-Quaternary normal faulting along the southern side of the range. Flexural modeling indicates the morphology of the range is consistent with flexural uplift of footwall rocks during Pliocene-Quaternary displacement on south-dipping normal faults bounding the south side of the mountains, provided that the effective elastic plate thickness of 12 km under the Moesian platform is reduced to about 3 km under the Stara Planina. This small value of elastic plate thickness under the Stara Planina is similar to values observed in the Basin and Range Province of the western United States, and suggests that weakening of the lithosphere is due to heating of the lithosphere during extension, perhaps to the point that large-scale flow of material is possible within the lower crust. Because weakening is observed to affect the Moesian lithosphere for approximately 10 km beyond (north of) the surface expression of extension, this study suggests that processes within the uppermost mantle, such as convection, play an active role in the extension process. The results of this study also suggest that much of the topographic relief in thrust belts where convergence is accompanied by coeval extension in the upper plate (or "back arc"), such as in the Apennines, may be a flexural
1 Roy, M., L. H. Royden, B. C. Burchfiel, Tz. Tzankov, and R. Nakov, Flexural uplift of the Stara Planina range, Central Bulgaria, Basin Research, 8, 143-156, 1996.
response to unloading during normal faulting, rather than a direct response to crustal shortening in the thrust belt.
INTRODUCTION
Most active and recently active orogenic belts are associated with high topography (Argand, 1924). Earth scientists have generally attributed the development of these topographically high mountain belts to isostatic compensation for crustal thickening and shortening during convergence (Figure 2.1a). However, another mechanism for the creation of linear belts of high topography was recognized as early as 1950 by Vening Meinesz (1950). He pointed out that within extensional domains, topographically high mountains could be created during normal faulting by unloading and buoyancy driven flexural uplift of the footwall (Figure 2.lb). While it seems clear that the high topography in many orogenic belts is the result of isostatic compensation for crustal thickening, such as in the Andes and the Himalaya, there are others in which crustal shortening is accompanied or overprinted by extension of the overriding plate and the relative roles of shortening and extension in the creation of high topography is unclear.
The territory of Bulgaria has been greatly deformed by Mesozoic to Early Tertiary convergence and crustal thickening as part of the Alpine orogenic system, and the topographically high mountains of Bulgaria are generally supposed to be the direct result of Alpine crustal shortening (Figure 2.2). However, recent mapping within Bulgaria has shown that Miocene and younger normal faults, some with very large displacement, are present throughout much of Bulgaria (e.g. Dinter and Royden, 1993; Zagorchev, 1992; Tzankov et al., 1995) and Miocene to Recent extensional subsidence has occurred throughout much of central eastern Bulgaria.
A good example of the superposition of extensional and compressional structures occurs in the Stara Planina range within the Balkan belt in central Bulgaria. Shortening of the Stara Planina occurred during Mesozoic to Early Tertiary time, whereas extension occurred from Pliocene to Recent time and is currently active (Figure 2.2). Like much of the rest of Bulgaria, the topography of the Stara Planina range has been thought to be due to Mesozoic thrusting, and the role of extension in controlling the topography of the Stara Planina has been largely ignored. In this
paper we test the idea that most of the topographic relief within the Stara Planina may be due to young extensional deformation by examining the geometrical relationships between topography and normal faulting in the Stara Planina and the role of isostasy in creating footwall uplift during normal faulting.
GEOLOGIC SETTING
The Stara Planina, located in central Bulgaria, is an east-west trending range of mountains that is commonly thought to have developed antithetically to north-dipping subduction of the Vardar Ocean to the south (Burchfiel, 1980). North-directed thrusting occurred episodically within the Stara Planina from Triassic to early Tertiary time, and the frontal thrust faults of the mountain belt override upper Cretaceous and, in places, lower Tertiary sedimentary rocks of the Moesian platform (Boyanov et al., 1989). The Moesian Platform north of the Stara Planina forms an intermediate foreland between the north-vergent nappes of the Stara Planina and the south-vergent nappes of the South Carpathians (Figure 2.2). Along the southern margin of the Moesian foreland there is little evidence for the development of a foredeep basin adjacent to the Stara Planina. In contrast, there is a well-developed foredeep basin of middle to late Miocene age along the northern margin of the Moesian platform adjacent to the South Carpathians. The formation of this basin (referred to as the South Carpathian foredeep in following sections) was roughly coeval with the last major episode of thrusting and shortening in the South Carpathians (Sandulescu 1975, 1980; Paraschiv 1979).
To the south of the Stara Planina lies a broad zone of Miocene to Recent extension, which is approximately 150 km in width (Tzankov et al., 1995). The northern limit of this zone is a linear east-west-trending chain of Pliocene-Quaternary half-grabens situated immediately adjacent to the topographically high Stara Planina. To the north, this chain of grabens is bounded by the Stara Planina and to the south by the Sredna Gora range. In the central part of this chain, subsidence began in latest Miocene to Pliocene time as indicated by the presence of Pliocene and some upper Miocene sediments in the lower part of the graben fill (Figure 2.3 and Tzankov et al., 1995). In the eastern and western parts of the chain subsidence began in Quaternary time and Pliocene
13 sediments are absent. Typical thicknesses of sedimentary fill within the grabens are approximately 500-1000 m of predominantly Pliocene and Quaternary rocks (Tzankov et al., 1995). Faulting within the graben system appears to be currently active (Tzankov et al., 1995).
Along the entire length of the graben chain, the dominant extensional structures are south-dipping normal faults that bound the northern edge of the grabens. The normal-fault surfaces are well exposed in many places along the southern margin of the Stara Planina, where some are observed to dip gently southward at about 100 to 200 (Tzankov et al., 1995). The fault surfaces themselves are typically planar microbrecciated surfaces that parallel the hillslope at the foot of the Stara Planina, and are reminiscent of the microbrecciated surfaces observed on low-angle normal faults within the Basin and Range Province (e.g. Wernicke and Axen, 1988). Geological relations on the south side of the Stara Planina indicate that in places south-dipping normal faults are exposed for considerable distances up the southern slope of the mountains (Figure 2.3 and Tzankov et al., 1996). This observation strongly suggests that the southern slope of the Stara
Planina represents the exhumed, partially eroded footwall of the graben-forming normal faults. If this interpretation is correct, the topographic relief associated with the Stara Planina is coeval with the initiation of normal faulting along the south side of the mountains, indicating that uplift of the Stara Planina is of Pliocene-Quaternary age. Thus, the topography in the Stara Planina would be primarily due to footwall uplift as a result of young normal faulting rather than to Mesozoic thrusting. In the following sections we examine the topographic data in the Stara Planina to determine whether the geometry of the range is consistent with the morphology of a flexurally uplifted footwall.
Topography in the Stara Planina
North-south topographic profiles through the Stara Planina show a pronounced asymmetry (Figure 2.4a). The southern slope of the mountains is relatively steep with a horizontal distance between the bottom of the slope and the peaks of about 15 km. The northern slope of the mountains is relatively gentle with a horizontal distance between the bottom of the slope and the peaks of about 100 km. This morphology is reminiscent of that produced by footwall uplift
during normal faulting (Vening-Meinesz, 1950; Wernicke and Axen, 1988) and suggests that the northern flank of the Stara Planina represents an originally horizontal to sub-horizontal surface uplifted by flexural unloading during Pliocene-Quaternary normal faulting on the southern side of the range. A coarsely contoured topographic map of the Stara Planina (Figure 2.5) shows that the northern slope of the Stara Planina is a nearly planar surface gently warped around an east-trending axis, consistent with the interpretation that this surface has been flexurally uplifted to its present position.
The northern slope of the Stara Planina consists of nappes containing folded Mesozoic and early Cenozoic sedimentary cover of the Moesian platform (Figure 2.4b). Because of the absence of late Cenozoic rocks on this slope, we do not have precise constraints on the timing of uplift of this surface. However, its grossly planar morphology, coupled with deep incision by young rivers, suggests that uplift has been very recent. In addition, the steep valley profile of the Iskar River, which flows northward across the highest part of the western Stara Planina, strongly suggests that incision of this river is of a young age. Because downcutting of the river must have kept pace with uplift of the mountains, the uplift must also be of a comparably young age.
The absence of Upper Tertiary and Quaternary rocks on the northern slope of the Stara Planina makes it difficult to constrain the pre-uplift elevation of this surface. However, north of the Stara Planina sedimentary facies of the Moesian platform indicate that this region was covered by a broad deltaic to fluvial platform in Pliocene-Quaternary time (Steininger et al., 1985). At the beginning of Pliocene time much of the region was covered by shallow waters of the Paratethys Sea, but by the end of Pliocene time the entire region became emergent and sedimentation continued with fluvial deposition. Thus the region north of the Stara Planina appears to have been a broad, sub-horizontal plain with an initial elevation near that of modern sea level throughout Pliocene-Quaternary time.
Taken together, the arguments presented in this section strongly suggest that the present topographic expression of the Stara Planina is the result of flexural unloading of footwall rocks during normal faulting on the south side of the mountains. In addition, the data indicate that the uplift of the mountains to their present topographic elevation is of Pliocene-Quaternary age. If this
interpretation is correct, then the topographic mountains of the Stara Planina have little relationship to the older Mesozoic and Early Tertiary shortening events within the orogenic belt (except insofar as older structures may have localized the position of younger normal faults). The topography of the mountain belt can therefore be almost entirely characterized as the result of extension and flexural uplift. In the following sections we test the feasibility of this hypothesis through flexural analysis of surface slopes on the north side of the Stara Planina.
TOPOGRAPHY, GRAVITY AND DEFLECTION DATA
Topographic data in Bulgaria were obtained from a 1:500,000 scale topographic map contoured at 50 m intervals for elevations less than 200 m, 100 m intervals for elevations less than 1000 m and 200 m intervals elsewhere (Stoyanova, 1986). Topographic data in Romania were obtained from the Digital Bathymetric Data Base 5 (DBDB5) topographic data set (Defense Mapping Agency). (A comparison of DBDB5 data from Bulgaria with a smoothed version of topography from Stoyanova (1986) shows good agreement.) Topographic profiles were generated by averaging data over a 40 km wide swath centered on each profile (Figure 2.6). All profiles were smoothed using a 5-point moving window average (data spacing is roughly 2 km in Bulgaria and 10 km in Romania). Gravity profiles in Bulgaria were obtained from unpublished data; no gravity data were available for Romania (Figure 2.7).
For the following analyses, quantitative estimates of deflection are needed for two different time periods. Deflection data are needed to constrain the total flexural deflection of the Moesian platform, which can be approximated as the end-Cretaceous to Recent vertical motion of the platform, and to constrain the the Quaternary deflection of the platform. Because Cretaceous sedimentary rocks consist of platformal deposits (mainly platform carbonates), the Moesian platform must have been near sea level throughout Cretaceous time. Thus the total flexural deflection of the Moesian platform can be defined as the current depth (or elevation) of the top of the Cretaceous section.
On the north side of the Moesian platform, beneath the South Carpathian foredeep, the total flexural deflection is given by the depth to the base of the Neogene, where Neogene rocks sit
unconformably on Mesozoic platform carbonates (Paraschiv, 1979). On the south side of the Moesian platform, immediately north of the thrust sheets of the Stara Planina, Upper Cretaceous platform carbonates are exposed at the surface where they are overthrust from the south by nappes of the Stara Planina (probably in Early Tertiary time, Figure 2.4b). Thus the total (end-Cretaceous to Recent) deflection at this point can be approximated as its modem elevation, approximately 100 m above sea level. (Although there is older platform subsidence of the Moesian foreland, there is no evidence for older flexural subsidence or for the development of a southward deepening foredeep basin of Cretaceous or early Cenozoic age adjacent to the Stara Planina.)
Throughout most of Pliocene-Quaternary time, the surface elevation of the Moesian platform was near and slightly above sea level, based on the depositional environment of Pliocene-Quaternary sedimentary rocks (see preceding section). Thus we assume in earliest Pliocene-Quaternary time this surface was horizontal to subhorizontal and slightly above sea level. Quaternary deflection can then be defined as the present elevation of the base Quaternary or, as Quaternary sediments are everywhere thin, as the present surface elevation of the platform.
On the north slope of the Stara Planina, Pliocene-Quaternary rocks are absent. In our analysis we assume that at the beginning of Quaternary time this surface was planar and horizontal, and had the same elevation as the rest of the Moesian platform to the north. Quaternary deflection of the Stara Planina is thus defined by the current elevation of the northern Stara Planina, with several possible adjustments due to minor short wavelength irregularities in topography. For example, at the northern edge of the Stara Planina river channels and associated topographic depressions trend approximately east-west, parallel to the mountains. If these east-trending topographic features primarily represent pre-existing topography with little erosion in the river channels, then the elevation of the river valleys should give the best estimate of the vertical deflection of the underlying lithosphere. Alternatively, if these east-west trending topographic features primarily represent young downcutting of the river valleys, then the elevation of the ridge tops should give the best estimate of the vertical deflection of the underlying lithosphere.
If the northern slope of the Stara Planina is formed by flexural uplift of an originally horizontal to sub-horizontal surface, then the modem topography of the northern slope and of regions north of the Stara Planina should be a measure of the flexural bending of the underlying lithosphere. In particular, the vertical deflection of the surface from an originally horizontal position to the warped, slightly eroded, and locally incised surface defined by modem topography should reflect the flexural response to unloading of the underlying lithosphere by normal faulting on the south
side of the Stara Planina.
In our analysis we first test whether this modem topography is consistent with deflection of a uniformly strong Moesian lithosphere. We use the method of Kruse and Royden (1994) for flexure of an elastic plate to obtain the best flexural fit to specified topography and deflection (and gravity) data. We assume that the effective plate end is located at the crest of the Stara Planina and solve for the flexural rigidity of the Moesian lithosphere, the initial surface elevation of the Moesian plate (constrained to be above sea level), and the bending moment and shear stress
applied to the plate end.
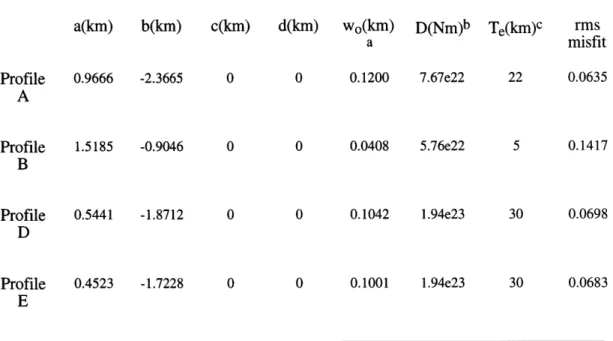
The flexural rigidities that provide the best fits to topography on profiles A and B from the western Stara Planina correspond to effective elastic plate thicknesses of Te=20 and 10 kin,
respectively (Figure 2.8 and Table 2.1). In the rest of this paper, we will refer interchangeably to the terms "flexural rigidity", D, and "effective elastic plate thickness", Te, where we have used the value of E = 8.lxlO1 0Pa for Young's modulus and v= 0.25 for Poisson's ratio. In our opinion, neither of these fits are acceptable because they underestimate the slope at the crest of the range and misfit the northern half of the profiles. If a subset of the topographic data is used to constrain the plate flexure (using only ridge tops or only valley bottoms), the fit does not improve substantially. Thus profiles A and B cannot be adequately fit by flexure of a uniformly strong plate. On the other hand, topographic data on profiles D and E from the eastern Stara Planina are adequately fit by flexure of a uniformly strong plate (best fitting Te=30 km on both profiles). However, because
the lithosphere appears to be only gently flexed along these profiles, the plate strength is not very well constrained and a broad range of plate strengths provide adequate fits.
The best fitting initial elevation of the pre-uplift topographic surface (or initial water depth) is between 40 and 120 m above modem sea level. Although the initial water depths for profiles A
and B are quite different (40 m for profile A and 120 m for profile B), these numbers may not be meaningful estimates of the initial elevation along these profiles because of the poor fits to topographic data. Along profiles D and E however, the initial water depths obtained are approximately 100 m for both profiles. This elevation is consistent with the expected elevation of a broad, sub-horizontal deltaic platform near sea level. In addition it is also consistent with the average present-day elevation of Moesian platform (50-150 m) in the vicinity of the Danube river floodplain north of the Stara Planina.
We conclude that if the topography on the northern slope of the Stara Planina is the result of flexure of the underlying lithosphere, then the strength of the lithosphere changes from north to south, at least on profiles A and B. In particular, the best fitting models for profiles A and B in Figure 2.8 have lower curvature than indicated by the topographic data for x =0-25 km and have higher curvature than indicated by the topographic data for x =25-150 km. This suggests that the flexural strength in the southernmost parts of profiles A and B is significantly lower than the flexural strength of the rest of the Moesian platform. In the next section we examine the effect of assuming that the strength of the Moesian lithosphere may be significantly lower beneath the southernmost parts of profiles A-E than on the northern and central parts of these profiles.
FLEXURE OF A TWO-RIGIDITY PLATE
In this section we treat the Moesian lithosphere as a continuous elastic sheet with two regions of different strength. Within each region the flexural rigidity is uniform. Provided that the width of the transition zone between these two regions is narrow compared to the flexural wavelength(s) of the lithosphere, it can be approximated as a zone of zero width. In this approximation the transition zone will be a discrete point on each of profiles A-E. At the boundary between the two regions the shear stress, bending moment, slope and deflection are constrained to be continuous. Thus three variables determine the strength distribution on each profile (the flexural rigidities of the northern and southern regions, and the lateral position of the transition point).
We first make an independent estimate of the flexural rigidity of the northern zone, which probably composes most of the Moesian platform. Then, after determining the strength of the northern zone, we need to solve only for the strength of the southernmost part of the Moesian platform and the location of the transition between the regions of differing strengths from the
Quaternary deflection data.
How can we estimate the flexural rigidity of the northern Moesian platform? Flexure in the central and northern regions of the Moesian platform should be determined primarily by the flexural rigidity of the underlying lithosphere. Provided that the zone of significantly weaker lithosphere is confined to the southernmost portion of the Moesian platform (x=0-25 km? on profiles A and B), then the flexural rigidity of this weak zone will not greatly influence the flexure of the central and northern parts of the Moesian platform. Although the central and northern parts of the Moesian platform were not greatly flexed during Quaternary time (Figure 2.8), they show significant Mesozoic through Quaternary flexure (Figures 2.4b and 2.7). This occurred in response to Mesozoic to Early Tertiary overthrusting along the southern margin of the platform and Miocene overthrusting along the northern margin of the platform (see section on geologic setting). (Most of the older subsidence of the Moesian platform appears to be regional, probably due to thermal cooling of the lithosphere, and not flexural in origin.) We can therefore use the total (Mesozoic to Quaternary) flexural deflection of the central and northern Moesian lithosphere to estimate the flexural rigidity of the northern part of the platform.
Total (Mesozoic to Recent) Flexure of the Moesian Platform
In the northern part of the Moesian platform, the depth to the base of the South Carpathian foredeep (base Miocene) is a measure of the total flexural deflection of the plate. In the central part of the Moesian platform, the deflection of the lithosphere can be constrained to be zero immediately north of the thrust sheets of the Stara Planina (x =60 km). In the central to southern part of the Moesian platform the flexure can be constrained by gravity data (although gravity data from the southernmost portion of the platform may be affected by the zone of weaker lithosphere).
In analyzing the total deflection of the central and northern Moesian platform, we assume that the flexural rigidity of the lithosphere is uniform in this region and that the effective plate ends are located at the topographic crest of the Stara Planina in the south and at the deepest part of the South Carpathian foredeep basin in the north (x=0 and 220 km on Figure 2.9). The flexural deflection at the southern plate end is not tightly constrained (see discussion above) but must be consistent with the deflection of the central and northern parts of the Moesian platform, and with the gravity data. The best fits to the deflection and gravity data are obtained with flexural rigidities corresponding to Te =12 and 20 km (Figure 2.9). The flexural profiles for Te=20 km are unable to match the condition that the deflection be approximately zero immediately north of the thrust sheets of the Stara Planina (x =60 km). Thus the best fitting effective elastic thickness which is also consistent with the deflection of the central Moesian platform is Te=12 km (parameters are listed in Table
2.2). The flexural rigidity corresponding to this fit is D =1.24x10²² Nm.
Pliocene-Quaternary Flexure in the Stara Planina
The total flexural deflection of a plate with position-dependent flexural rigidity is governed by the simplified equation (in one dimension)
d2 D(x) d2,,(X)w Ix+ Apgw
1
{x)=t
(x)pegdx2 dx2 - (2.1)
where D is the flexural rigidity, w(x) is the deflection, Ap is the density contrast responsible for the restoring force and t(x) is the distributed (topographic) load on the plate. Under the assumption that the Moesian lithosphere consists of two regions of uniform rigidity, we can divide a north-south profile though the Moesian platform into a northern region corresponding to the part of the plate between x=xt and x= o and a southern region between x=O and x=xt where xt is the
location of the transition point. The solutions for the deflection in these two regions, Wsouth (x) and wnorth (x), can be written as:
wsouth (x)=aicos( exp(- -
)
+bisi)
exp(- X )+\suth; Asouth \ south south \
+clco s(~t exrp - xt'~ + di si( t'~
)
exd -'~ + wOasouthI 'southl + nsouth) southi (2.2)
and
Wnorth (x )=a2 co ex - x ~t)+ b2 Sin ' ex - + WO
unrt!
north! anothUorthi
(2.3)where wo is the initial water depth, assumed to be uniform for the whole plate. The six coefficients ai, a2, bi, b2, ci, and di are related by matching four boundary conditions at x =xt,
(the continuity of deflection, slope, bending moment and vertical shear stress), leaving only two independent coefficients to determine the best fitting plate flexure. For a given value of xt, we
solve for the best fitting flexural profile using a modified version of the method outlined in Kruse and Royden (1994), where the flexural rigidity of the north-central Moesian platform is constrained to be Dnorth =1.24x10²² Nm (Tenrth =12 km), and the coefficients a,b,c and d are constrained by matching boundary conditions at x =xt and solving for the bending moment and vertical shear force at x=0. For each profile, we consider a range of transition points to determine the best fitting value of xt.
Fits to profiles A and B using an elastic plate with two rigidities are significantly improved over those obtained using a plate with uniform rigidity (compare Figures 2.10 and 2.11 to Figure 2.8). Topographic slopes near the highest part of the western Stara Planina are matched well using a lower flexural rigidity in the southernmost part of the Moesian platform and the fit to the topography of the flatter central and northern parts of the Moesian platform is also much improved. The best fitting flexural rigidity in the southern region of both profiles A and B is
Dsouth =1.94x10²⁰ Nm (corresponding to Teso,,th =3 km) and the best fitting value for xt for both
profiles is 10 km (parameters listed in Table 2.3). The flexural fits obtained for transition points xt
>20 km are not significantly better than those obtained with a uniform rigidity plate. In particular, the best fitting range of transition point locations is about 7 km < xt < 12 km for both profiles A
and B. The initial topographic elevation obtained for both profiles is about 40 m and is in good agreement with the constraints on the pre-uplift elevation of the Moesian platform (see previous section).
In order to investigate the effects of pre-existing topography and erosion, we use a subset of the topographic data, either the tops of ridges only (Figure 2.12) or the bottoms of valleys only (Figure 2.13), to constrain the flexure of the lithosphere. The best fitting parameters using these data sets are in the range Tesouth= 3-4 km for both profiles A and B, and xt=10 km for profile A and xt =10-12 km for profile B. These parameters are in agreement with those found using the full data sets.
In the eastern parts of the range, a two-rigidity elastic plate model does not provide significant improvements to the flexural fits to profiles D and E. For a wide range of transition points the best fitting value of the flexural rigidity in the southern part of the Moesian platform is approximately equal to that in the central and northern parts. These results suggest that the zone of lower flexural rigidity in the southernmost part of the Moesian platform underlies the western Stara Planina and does not extend significantly to the east.
Normal-Fault Geometry and Crustal Thinning
The analysis above suggests that modern topography in the Stara Planina is consistent with flexural footwall uplift due to Pliocene-Quaternary unloading on normal-faults to the south of the mountains, and that it is not the direct result of crustal shortening across the mountain belt. Using the results above, we calculate the buoyancy forces required to drive the observed flexural uplift, and therefore estimate the amount of mass removed by extension.
Figure 2.14a illustrates how crustal thinning occurs above a normal-fault as a result of material removed during normal motion on the fault. If isostatic uplift of the footwall is neglected, the resulting geometry is that shown in Figure 2.14a. When isostatic uplift of the footwall is included, the resulting geometry is that shown in Figure 2.14c, where the volume of material removed during normal faulting is indicated by the shaded region. In Figure 2.14c,b, we estimate the geometry and volume of the material removed during normal faulting in the region south of the
Stara Planina, by solving equation (2.1) in this region for an effective elastic plate thickness of Te=3 km. The boundary conditions applied are that the deflection, w(x), and the horizontal gradient of deflection, dw/dx, at the crest of the Stara Planina match those computed for the deflection on the north side of the Stara Planina in the preceding section (and that w goes to zero far south of the Stara Planina). The total material removed during normal faulting is then the difference between the deflection computed on the south side of the Stara Planina and the observed topography, as shown in Figure 2.14b,c.
The results of this computation indicate that flexural uplift of the north side of the Stara Planina is consistent with thinning of the hangingwall, during extension, over a distance of several tens of kilometers south of the Stara Planina, with a maximum thinning of approximately 5 km (and a maximum crustal thinning of about 15%). This is small compared to the large magnitudes of unroofing observed in some core complexes in the Basin and Range Province (e.g. Wernicke and Axen, 1988, Block and Royden, 1990), and agrees well with the apparently shallow levels of exposure south of the Stara Planina. It is also of note that the deflection shown in Figure 2.14c for the south side of the Stara Planina yields a vertical shear stress at the crest of the range of 1.3x10¹¹ Nm-1. This value agrees well with the vertical shear stresses computed at the crest of the range for flexure of the region north of the Stara Planina: 2x10 11 Nm-1 for Profile A and 1x10 11 Nm-1 for Profile B.
Figure 2.14b shows the reconstructed geometry of the normal-fault system on the south side of the Stara Planina prior to movement on the normal-fault. Near the surface the geometry of the incipient normal-fault can be estimated reasonable well because it is assumed to coincide with the south slope of the Stara Planina and the northern margin of the Quaternary grabens. This indicates an initial dip for this part of the fault of about 200. Below about 5 km depth the fault geometry is unconstrained, except that it must be deeper than the base of the material removed during faulting and probably flattens with depth in a listric geometry (Tzankov et al., 1995).
DISCUSSION AND CONCLUSIONS
The modern topography of the Mesozoic to early Tertiary thrust belt of the Stara Planina in Bulgaria appears to be almost entirely due to post-Miocene extensional processes. Because shortening and extensional events are temporally separated within the Stara Planina, the role of young normal faulting in the development of high topography can be clearly distinguished from the role of older convergent deformation in this region. The flexural modelling presented in this paper suggests that much of the morphology and modern topographic relief within the Stara Planina is the result of buoyancy-driven footwall uplift in response to (Neogene-Quaternary) normal faulting to the south of the range.
The Stara Planina, Sredna Gora and the topographically low sub-Balkan graben system are the northernmost elements of a broad Neogene extensional system that comprises much of southern Bulgaria and includes the Thracian Basin. The analysis presented here suggests that the modern topographic relief of much of this region could be the result of Neogene-Quaternary extension. For example, the topographically high region of the Rhodope "massif" of southern Bulgaria and northern Greece is bounded by Neogene (and older) normal faults that dip away from Rhodope, so that the uplifted regions lie in the footwalls of these young normal-faults. We suggest that, similar to the Stara Planina, the Rhodope "massif" has been uplifted by flexural unloading during normal faulting (see also Dinter and Royden, 1993). Other morphologic features related to young normal faulting probably include the Sredna Gora, which in our interpretation represent tilted and rotated blocks contained within the hangingwall of the normal fault system present on the south
side of the Stara Planina.
Heat flow measurements within the Thracian Basin and the sub-Balkan graben system show that this extended region is the site of high surface heat flow, indicating that surface extension is related to regional extension and heating within the mantle. It is interesting that surface heat flow values generally decrease northward across the Stara Planina, and that the Stara Planina separate the zone of elevated heat flow to the south from regions of lower heat flow to the north (Cermak et al., 1979; Velinov and Boyadjieva, 1981; Velinov, 1986). This suggests that the northern limit of
heating within the lithosphere is approximately coincident with the northern limit of surface extension.
The flexural rigidity of the lithosphere beneath the Stara Planina is probably also related to the thermal structure beneath the northern edge of this extensional region. In particular, the effective elastic thickness of the Moesian plate changes from Tenrth =12 km in the central and northern parts of the Moesian platform to about Teso,,th =3 km near the topographic crest of the central Stara Planina. The 3 km value of Te obtained for the western Stara Planina is similar to that obtained for the Basin and Range Province of the western United States, and suggests that the Moesian lithosphere beneath the Stara Planina is sufficiently hot to allow for large-scale ductile flow within the lower crust (Block and Royden, 1990, Kaufman and Royden, 1994). We propose that the part of the Moesian lithosphere underlying the Stara Planina (at least in the central part of the range) was greatly weakened during post-Miocene extension, and that the Moesian lithosphere was probably uniformly strong prior to this event.
The flexural modeling presented in this paper indicates that the northern limit of the zone of weak lithosphere lies approximately 10 km north of the crest of the Stara Planina. This is also 10 km north of the surface exposure of major normal faults and probably at least several tens of kilometers north of where the south-dipping normal faults penetrate to lower crustal or upper mantle depths (see Tzankov et al., 1995, Figure 10). This suggests that heating and weakening of mantle and lower crustal lithosphere extends significantly beyond (north of) the region of crustal extension. It is highly unlikely that this is due to lateral diffusion of heat from beneath the extended region because the characteristic time for diffusion across a distance of 30 km is about 10 my, significantly greater than the age of initiation of extension in the sub-Balkan graben system. In addition, the amount of heating needed to reduce the effective plate thickness from 12 to 3 km is probably too large to be due to lateral diffusion over these distances. One possibility that is consistent with the observations is that the lithosphere adjacent to the zone of upper crustal extension has been heated and weakened by active processes (e.g. convection) within the uppermost mantle beneath and adjacent to the region of crustal extension (see, for example, Buck,
1986). If this hypothesis is correct, then it indicates that the mantle must play a very active role in the extension process in Bulgaria.
The idea that the high topography observed within thrust belts with back-arc extension might be due primarily to extensional deformation behind the thrust belt is radically different from traditional notions about the development of high topography within thrust belts. In the Stara Planina, the temporal separation between younger extensional and older shortening events allowed us to determine the role of extension in the development of high topography in this region. However, in mountain belts in which crustal shortening is accompanied by coeval extension of the overriding plate immediately adjacent to the zone of thrusting (Figure 2. 1d), the role of extension in generating high topography is more difficult to isolate. Our results suggest that in such orogenic belts extension and flexural unloading of footwall rocks during normal faulting may be responsible for a significant portion of the topographic relief.
For example, within the Apennines the spatial relationship between normal faulting and the locus of high topography is nearly identical to that observed within the Stara Planina, and significant normal faulting begins immediately behind the topographic crest of the range (Bally et al., 1986, 1988). This suggests the possibility that uplift of the topographically high regions of the Apennines may be controlled in large part by extensional unloading of the footwall of normal faults within the extensional region, rather than to crustal shortening and thickening beneath the orogen. Other regions of high topography that are commonly supposed to be due to crustal shortening, but that we believe may be partially due to footwall uplift during normal faulting, include the Olympos region of northern Greece and mountains of the East Carpathian orogen.
27 ACKNOWLEDGEMENTS
This work is part of a cooperative project between the Geological Institute of the Bulgarian Academy of Sciences and M. I. T. It was supported by both sides. Support was provided by the Geological Institute and by National Academy of Science, Exchange Program for Eastern Europe, and a grant from the International Division of the National Science Foundation grant INT 9216217 awarded to B. C. Burchfiel and L. H. Royden. Part of the work on this project was completed at California Institute of Technology from 1991-1992 by L. H. Royden while supported by a Visiting Fellowship for Women from the National Science Foundation.
REFERENCES
Argand, E., 1924, La tectonique de l'Asie, Proc. 13th Int. Geol. Congr. Brussels, 7, 171-372. Bally, A. W., L. Burbi, J. C. Cooper and R. Ghelardone, 1986, La tettonica di scollamento
dell'Appennino Centrale, paper presented at 73rd National Congress of Geology of Central Italy, Rome, Sept. 30 to Oct. 4, 1986.
Bally, A. W., L. Burbi, C. Cooper and R. Ghelardone, 1988, Balanced sections and seismic reflection profiles across the central Apennines, Memorie della Societa Geologica Italiana,
257-310.
Block L. and L. H. Royden, 1990, Core complex geometries and regional scale flow in the lower crust, Tectonics, 9, no. 4, 557-567.
Boyanov I., Ch. Dabovski, P. Gocev, A. Charkovske, V. Kostadinov, Tz. Tzankov, I. Zagorcev, 1989, A new view of the Alpine tectonic evolution of Bulgaria, Geol. Rhodopica, 1, 107-121.
Buck, R. W., 1986, Small-slace convection induced by passive rifting: the cause for uplift of rift shoulders, Earth and Planetary Science Letters, 77, 362-372.
Burchfiel, B. C., 1980, Geology of Romania, GSA Special Paper.
Cermak, V. and L. Rybach, 1979, (eds.) Terrestrial heat flow in Europe, Scientific report - Inter-union Commision on Geodynamics, No. 58, Springer-Verlag.
Dinter, D. A., and L. H. Royden, 1993, Late Cenozoic extension in northeastern Greece: Strymon Valley detachment and Rhodope metamorphic core complex, Geology, 21, 45-48.
Kaufman P. S. and L. H. Royden, 1994, Lower crustal flow in an extensional setting: Constraints from the Halloran Hills region, eastern Mojave Desert, California, Journal of Geophysical Research, 99, 15,723-15,739.
Kruse, S. E. and L. H. Royden, 1994, Bending and unbending of an elastic lithosphere: The Cenozoic history of the Apennine and Dinaride foredeep basins, Tectonics, 13, 278-302. Paraschiv, D., 1979, Romanian oil and gas fields, Geophysical Prospecting and Exploration,
Sandulescu, M., 1975, Essai de synthese structurale des Carpathes, Bull. Dov. Gaol. Fr., Parin, XVII, n.3, 299-358.
Sandulescu, M., 1980, Analyse geotectonique des chaines alpines situdes autour de la Mer Noire occidentale, Ann. Inst. Geol. Geophys., Bucuresti, LVI, 5-54.
Steininger, F. F., J. Senes, K. Kleemann, F. R6gl, 1985, Neogene Mediterranean Tethys and Paratethys, Vol. 1, Institute of Paleontology, University of Vienna, Vienna, Austria. Stoyanova, D., ed., 1986, Topographic map of the Peoples's Republic of Bulgaria, scale:
1:500000, Primary Directorate for Geodesy, Cartography and Cadastre, Bureau of Cartography, Sofia.
Tsankov, Tz., R. Angelova, R. Nakov, B.C. Burchfiel and L. Royden, 1996, Basin Research, 8. Velinov, T., 1986, Geothermal field in Bulgaria, Reviews Bulgarian Geol. Soc., v. XLVII, part i,
p. 1-18 (in Bulgarian with English abstract).
Velinov, T. and K. Boyadjieva, 1981, Geotermichni izsledvania v Bulgaria (Geothermal studies in Bulgaria), Tehnika, Sofia (in Bulgarian).
Vening-Meinesz, F. A., 1950, Les "grabens" africains, resultat de compression ou de tension dans la croute terrestre?, Bulletin of the Royal Colonial Institute of Belgium, 21, 539-552. Wernicke, B. and Axen, G. J., 1988, On the role of isostasy in the evolution of normal fault
systems, Geology, 16, p. 848-851.
Zagorchev, I., 1992, Neotectonic development of the Struma (Kraistid) Lineament, southwest Bulgaria and northern Greece, Geological Magazine, 129, 197-222.
Table 2.1. Best Fitting Flexural Rigidities and Flexural Coefficients for Loading on One Side of a Plate of Uniform Rigidity, Quaternary Flexure.
a(km) b(km) c(km) d(km) wo(km) D(Nm)b Te(km)c rms
a misfit Profile 0.9666 -2.3665 1.5185 -0.9046 0.5441 -1.8712 Profile 0.4523 -1.7228 E 0 0.1200 7.67e22 0 0.0408 5.76e22 0 0.1042 1.94e23 0 0.1001 1.94e23 22 0.0635 5 0.1417 30 0.0698 30 0.0683
a wo is the initial water depth obtained in the inversions. b Flexural rigidity
c Effective elastic plate thickness. Profile
B
Profile D
31 Table 2.2. Best Fitting Flexural Rigidities and Flexural Coefficients for Loading on Both Sides of a Plate of Uniform Rigidity, Pliocene Flexure in the Carpathian Foredeep, Profile D
a(km) b(km) c(km) d(km) wo(km)a D(Nm)b Te(km)c rms
misfit
1.32320 0.34482 -1.15183 3.64516 -0.03277 5.76e22 20 46.5321 -2.47400 7.07581 -0.89128 3.50566 -0.13625 1.244e22 12 41.0083
a wo is the initial water depth b Flexural rigidity
c Effective elastic plate thickn
Table 2.3. Best Fitting Flexural Rigidities and Flexural Coefficients for Loading on One Side of a Plate of Changing Rigiditya, Quaternary Flexure.
a(km) b(km) c(km) d(km) wo xt D (km)b (km)c (Nm)d 0.8659 -0.3470 0.7754 -0.4877 0 0 0.0373 10 1.94e20 3 0.1218 0 0 0.0364 10 1.94e21 3 0.0758
a Flexural rigidity for x > xt is fixed at D=5.76e22Nm, but can vary for 0 <x <xt.
b wo is the initial water depth obtained in the inversions.
c xt is the x-coordinate of the point at which the plate changes rigidity. d Dl here is for the region 0 < x < xt.
e Effective elastic plate thickness Tel here is for the region 0 < x < xt.
f Profiles D and E did not give significantly better fits with a two-rigidity model than a uniform rigidity one. Tel (km)e rms misfit Profile A Profile B Profile Df Profile Ef
33
FIGURE CAPTIONS
Figure 2.1. Mechanisms for generating high topography via shortening and extension. (a) At convergent boundaries high topography is formed by crustal thickening; (b) In extensional settings high topography is formed by uplift and rotation of footwall due isostatic compensation during normal faulting; (c) Mechanisms (a) and (b) operating in the same orogenic belt where thrusting and extension are widely separated in time, such as in the Stara Planina range, where thrusting is Mesozoic-Early Tertiary and the extension is Quaternary; (d) Mechanisms (a) and (b) operating together during coeval thrusting and "back-arc" extension.
Figure 2.2. (a) Major tectonic elements of central-eastern Europe, with the territory of Bulgaria indicated by a heavy line; (b) Major topographic features of Bulgaria with the location of the Sub-Balkan graben system shown in black. Other Middle Miocene and younger extensional basins are shown with closely spaced dots and late Neogene deposition along the Moesian plain is shown with widely spaced dots. SB = Sofia graben, M = Mesta graben, S = Struma graben. (Figure modified from Tzankov et al.,1996.)
Figure 2.3. Simplified north-south cross-sections across the sub-Balkan graben system and corresponding approximately to profiles A (top) and B (bottom) on Figure 2.5. Graben fill is shown by dotted and cross-hatched areas and arrows show sense of motion on graben-bounding normal faults.
Figure 2.4(a) North-south topographic profile across the Stara Planina along Profile C. Arrows show the position of the Quaternary grabens on the south side of the range and the position of the frontal thrust fault of the Stara Planina. (b) Cross-section along profile C constructed from surface geological data and unpublished seismic and drilling data. pP = pre-Permian metamorphic rocks; Trlu = base Triassic unconformity; J3Kla,b = Upper Jurassic -Lower Cretaceous sedimentary '111, 1 W1911 AN 1111111 1111111INA11111IN 111 Al 111111 UIIIIIW INN
34
rocks in surface outcrop; Kla,b = Lower Cretaceous sedimentary rocks exposed at the surface; K2 = Upper Cretaceous sedimentary rocks. Details of hanging wall structure above the Mesozoic foreland sequence cannot be resolved on the seismic section. No vertical exaggeration.
Figure 2.5. Smoothed topographic map of the central Stara Planina, after Stoyanova (1986), and locations of profiles A-E. The east-trending dark solid line indicates the locations of the highest topographic points along the range. Stippled regions to the south of the range are extensional grabens bounded on the south side by the Sredna Gora mountains. Thick barbed lines indicate south dipping normal faults (barbs on the hanging wall).
Figure 2.6. Topographic data for profiles A-E. Profile C contains data with no lateral average; other profiles contain data averaged across a 40 km wide swath. All data was smoothed using a five-point moving window average. By definition, x=O corresponds to the crest of the Stara Planina. The thick solid line shows Quaternary grabens on the south side of the Stara Planina.
Figure 2.7.(a) Deflection data used to constrain the flexure of the Moesian platform along profile C. Smaller dots indicate the depth to base Neogene beneath the South Carpathian foredeep. Larger dot is the location of the frontal thrusts of the Stara Planina. (b) Bouguer gravity data along Profile C.
Figure 2.8. Best fitting flexural solutions for profiles A, B, D and E as described in the text for a uniformly strong plate with Te=10 km (solid line) and Te=20 km (dashed line). Profiles D and E are reasonably well fit by flexure of a uniformly strong plate while Profiles A and B are not.
Figure 2.9. Best-fitting flexural solutions for profile C using a uniformly strong plate with Te=12 and 20 km, using a simultaneous joint solution for deflection and gravity data. (a) Fit to deflection data. Star indicates the toe of Mesozoic-Early Tertiary thrust sheets. (b) Fit to gravity data. (c) RMS-misfit as a function of Te. Stars show Te=12and 20 km.