HAL Id: hal-00659868
https://hal.archives-ouvertes.fr/hal-00659868
Submitted on 13 Jan 2012
HAL is a multi-disciplinary open access archive for the deposit and dissemination of sci-entific research documents, whether they are pub-lished or not. The documents may come from teaching and research institutions in France or
L’archive ouverte pluridisciplinaire HAL, est destinée au dépôt et à la diffusion de documents scientifiques de niveau recherche, publiés ou non, émanant des établissements d’enseignement et de recherche français ou étrangers, des laboratoires
Mortality transition and differential incentives for early
retirement
Hippolyte d’Albis, Paul Lau Sau-Him, Miguel Sanchez-Romero
To cite this version:
Hippolyte d’Albis, Paul Lau Sau-Him, Miguel Sanchez-Romero. Mortality transition and differential incentives for early retirement. Journal of Economic Theory, Elsevier, 2012, 147 (1), pp.261-283. �10.1016/j.jet.2011.11.004�. �hal-00659868�
Mortality transition and differential
incentives for early retirement
∗
Hippolyte d’Albis
†Sau-Him Paul Lau
‡,
§Miguel Sánchez-Romero
¶Abstract
Many studies specify human mortality patterns parametrically, with a parameter change affecting mortality rates at different ages si-multaneously. Motivated by the stylized fact that a mortality decline affects primarily younger people in the early phase of mortality tran-sition but mainly older people in the later phase, we study how a mortality change at an arbitrary age affects optimal retirement age. Using the Volterra derivative for a functional, we show that mortal-ity reductions at older ages delay retirement unambiguously, but that mortality reductions at younger ages may lead to earlier retirement due to a substantial increase in the individual’s expected lifetime hu-man wealth.
JEL Classification Numbers: D91; J11; J26
Keywords: mortality decline; incentive for early retirement; years-to-consume effect; lifetime human wealth effect
∗We are grateful to Robert Canwell, Malene Kallestrup-Lamb, Takuma Kunieda,
Alexander Ludwig, Vai-Lam Mui, Jim Vere, participants of various seminars/conferences, an Associate Editor and three referees for helpful comments and suggestions, and to Zhipeng Cai and Zhuojiong Gan for efficient research assistance. Hippolyte d’Albis, S. Paul Lau, and Miguel Sánchez-Romero thank the European Research Council (European Community’s Seventh Framework Programme Grant Agreement no. 230589) and the Chaire Dauphine-Groupama, the Research Grants Council of Hong Kong (project no. HKU7008-PPR-10), and the Fulbright Commission and Spanish Ministry of Education (reference no. 2007-0445), respectively, for financial support.
†Paris School of Economics, University Paris I, France
‡School of Economics and Finance, University of Hong Kong, Hong Kong
§Corresponding author. Fax: +852 25481152. E-mail addresses: [email protected]
(Hippolyte d’Albis), [email protected] (Paul Lau), [email protected] (Miguel Sánchez-Romero).
1
Introduction
In the twentieth century, people tended to retire earlier in most developed countries, despite the fact that there was a steady and significant increase in life expectancy. In the US, for example, the life expectancy at birth for men who were born in 1900 was about 50 years. This figure increased substantially to over 70 years for those who were born in the middle of the century, and increased further to almost 80 years for those born in the 1990s.1 Despite
increasing life expectancy, however, labor force participation rates of men aged 65 and over steadily declined from over 60% in 1900 to around 20% at the last decade of the century, while the rates of men aged 55 to 64 declined from around 90% to below 70% for the same period (Costa [8, Fig. 2.1]).2
Various explanations have been proposed for this seeming paradox. For example, the important role of the generous benefits provided by the so-cial security system has been analyzed by Gruber and Wise [10, 11], and the wealth effect associated with sustained economic growth has been exam-ined by Costa [8]. To complement these well-known explanations, several researchers (such as Bloom et al. [3], Kalemli-Ozcan and Weil [17]) examine the relatively neglected question of how mortality decline affects retirement age. In particular, Kalemli-Ozcan and Weil [17] show that people may re-tire earlier if the decrease in the variability of age at death associated with mortality decline is very significant. In this article, we continue this line of inquiry by studying the differential incentives for early retirement provided by mortality changes at different stages of demographic transition.
A salient feature of mortality changes in many countries is that, while life expectancy has increased steadily over the last two centuries, mortality decline does not occur uniformly across age groups (Lee [18], Wilmoth and Horiuchi [23], Cutler et al. [9]).3 In the earlier stage of mortality transition,
a decline in mortality pertains mainly to younger people, particularly infants
1The data, which are based on the life tables constructed by the Office of the Actuary
of the Social Security Administration, can be downloaded from the Berkeley Mortality Database (http://www.demog.berkeley.edu/~bmd/). Obviously, some figures for these cohort life tables reflect projected mortality.
2Similar conclusions are also obtained for slightly different age groups, countries and
time periods. For example, clear downward trends are observed in labor force participation rates for men aged 60 to 64 in a larger set of developed countries (except perhaps Japan) in the second half of the twentieth century (Gruber and Wise [11, Fig. 1]).
3Another feature of observed mortality decline, one that is emphasized by
Kalemli-Ozcan and Weil [17, p. 66], is that “as life expectancy has risen, uncertainty regarding the date of death has fallen.” Both features have been mentioned in Wilmoth and Horiuchi [23]. In Section 3 we will compare Kalemli-Ozcan and Weil [17] with this article, and link their differences to these two features of mortality decline.
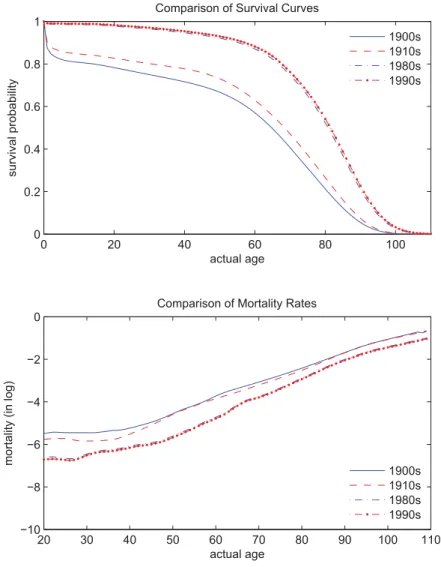
and children, whereas in the later stage, an “aging of mortality decline” has occurred, characterized by “successively larger reductions in mortality rates at older ages, and by smaller reductions at younger ages” (Wilmoth and Horiuchi [23, pp. 484-485]).4 An illustration of this pattern is given in Fig.
1, which is based on the survival data, starting from age 20, of different cohorts of men in the US. The upper panel shows the survival curves of men born in four different decades: the 1900s and 1910s at the beginning of the century, and the 1980s and 1990s towards the end of the century. It is observed that the improvement in survival probabilities at various ages is more substantial for the earlier period. Moreover, unlike the later period, the mortality decline at the beginning of the century pertained mainly to younger people. This is seen more clearly in the lower panel of Fig. 1, in which we plot the mortality rates (in log) at different ages.5 The mortality
decline occurred in greater concentration among people aged 20 to 50 from the 1900s to 1910s.
[Insert Fig. 1 here.]
Motivated by the stylized facts regarding the aging of mortality decline, we study the effect on optimal retirement age of a change in mortality at an arbitrary age. To do so, we use a method different from that of most existing studies, which usually address the effect of mortality decline by modeling the human mortality pattern using a parametric approach and considering the derivative of retirement age with respect to a change in the survival para-meter. One characteristic of this approach is that a change in the survival parameter usually affects mortality rates at different ages simultaneously. For example, in an article examining whether an individual’s saving level or retirement age adjusts more substantially when there is a mortality decline, Bloom et al. [3] show in a model with age-invariant mortality rates (as in Blanchard [2]) that the optimal response to a mortality decline is to delay retirement, with zero (or possibly negative) effect on saving rates. How-ever, a change in the parameter of an age-invariant mortality process affects
4A related and more formal term is “epidemiologic transition”, which refers to the
transition “in which degenerative and man-made diseases displace pandemics of infection as the primary causes of morbidity and mortality.” (Omran [19, p. 510]). In this article, we do not investigate the causes of mortality decline but rather take them as given, and focus on the implications of the “aging of mortality decline” aspect of this transition.
5Note that age-specific mortality rate, (), is related to the survival probability, (),
according to Eq. (1) below, or equivalently, () = −()1 ()
. Note also that in Fig.
1 we plot the data up to age 110 (instead of 120 in the original data set), because the mortality rates for men aged above 105 or so are based on an extremely small number of observations.
mortality rates at all ages to the same extent.6 Thus, although this widely
used specification is helpful for analyzing some economic phenomena (such as government debt policies), it is not appropriate if one’s objective is to isolate the impact of mortality change at a particular age. In other paramet-ric specifications of the survival curve (such as in Boucekkine et al. [6]), a mortality parameter change does not go so far as to affect mortality rates at all ages to the same extent, but it still affects mortality rates at different ages simultaneously. Thus, if there are systematic differences in how changes in mortality at different ages affect the retirement age, the differences are not clearly illuminated through these methods.
In this article, we consider a life-cycle model of consumption and ment choice with lifetime uncertainty, and characterize the optimal retire-ment age and consumption path. We then investigate the effect of a change in age-specific mortality rate on the optimal retirement age. Since the op-timal retirement age is a function of mortality rates that are themselves dependent on age, the appropriate method to use is the derivative of a func-tional. We use the Volterra derivative (Volterra [22], Ryder and Heal [20], Bommier [5]) to show that, while a mortality decline among older people unambiguously leads to a delay in retirement, a mortality decline among young people may lead to earlier retirement. We provide economic intuition of this systematic difference by decomposing the effect of a mortality change on retirement age into the “years-to-consume” and “lifetime human wealth” effects. (More detailed discussion of these effects will be provided in Sec-tion 3.) When a mortality decline occurs among an older age group, as in the later phase of mortality transition, the increase in individuals’ expected lifetime human wealth is usually negligible, and thus the years-to-consume effect dominates. On the other hand, when a mortality decline occurs among a younger age group, as in the early phase of mortality transition, it turns out that the increase in individuals’ expected lifetime human wealth can be quite substantial, dominating the years-to-consume effect.
The remainder of this article is organized as follows. Because the effect of mortality changes on retirement age is most clearly seen in a life-cycle model in which perfect annuities are present and disutility of labor does not depend on life expectancy, we begin by analyzing this basic model. In Sec-tion 2, we use the model to examine consumpSec-tion and retirement decisions, and in Section 3, we consider the effect of a mortality decline at an arbitrary age on optimal retirement age. Section 4 extends the model to allow for
6The survival probability of an age-invariant mortality process is given by () = −,
where is the instantaneous mortality rate at any age. Thus, a change in affects mortality rates at all ages by the same extent.
the dependence of disutility of labor on life expectancy to capture the “com-pression of morbidity” hypothesis (as in Bloom et al. [3]) and to allow for imperfect annuities. We demonstrate the robustness of the main results in the basic model vis-à-vis these different specifications. Concluding remarks are presented in Section 5.
2
The model
We consider a life-cycle model in which age is modeled as a continuous vari-able between 0 and Ω (the maximum age).7 Lifetime uncertainty is captured
by a general specification of the survival function (), where
() = −0() (1)
is the survival probability at age , (0) = 1, (Ω) = 0, and () ≥ 0 (with lim→Ω () = ∞) is the instantaneous mortality rate at age .
We make the convenient yet realistic assumptions that labor supply is indivisible and retirement decision is irreversible. These assumptions follow many articles such as Heijdra and Romp [15] and Kalemli-Ozcan and Weil [17], and are consistent with the stylized description of retirement as “a complete and permanent withdrawal from paid labor” in Costa [8, p. 6].
In this model, an individual chooses a consumption path and a retirement age to maximize expected lifetime utility
Z Ω 0 − () ( ()) − Z 0 − () () (2)
subject to the law of motion 0() = ½ [ + ()] () + ()− () [ + ()] ()− () if ≤ if (3)
and boundary conditions
(0) = 0 (Ω) ≥ 0 (4)
where ∈ [0 Ω] is the retirement age, is the discount rate, is the constant (real) interest rate, () is the (real) wage income at age if the individual
7As in many studies examining the relation between life expectancy and retirement
age, we abstract from the childhood stage of the human life cycle. Thus, age in our model refers to adult age (which can be conveniently interpreted as actual age minus 20), unless specified otherwise.
is working, () is consumption at age , () is financial wealth at age , and () is disutility of labor at age .
We assume that individuals have no bequest motive, and that annuities are perfect (as in Yaari [24]). It is well known that in such an environment, individuals will find it optimal to purchase annuity contracts. As captured in (3), an individual of age will surrender financial wealth () to the insurance company if death occurs, but will receive an extra amount equal to () () if death does not occur. We make the standard assumption that marginal utility of consumption is positive and diminishing:
0() 0 00() 0 (5)
We also assume that disutility of labor is non-negative and non-decreasing in age:
()≥ 0 0()≥ 0 (6)
The assumption 0()≥ 0 has also been used in Hazan [13] and Heijdra and Romp [15].
The various specifications of this model are guided by related studies and the particular objectives of this article. We first review several closely related articles examining the effect of mortality decline on retirement age, and or-ganize their differences according to three aspects: survival function, annuity market and objective function. As summarized in Table I, researchers use different specifications of the survival curves, including rectangular, exponen-tial, a two-parameter model suggested by Boucekkine et al. [6], and a general specification based on actual data. For the annuity market, it is assumed to be perfect in most of these articles, but the alternative assumptions of an absence of or an imperfect annuity market have also been used in Chang [7], Heijdra and Mierau [14] and Kalemli-Ozcan and Weil [17]. For the objective function, all of these articles assume time separability and no bequest mo-tive, and all but one of these articles assume that the instantaneous objective function is separable in consumption and labor (or leisure). Furthermore, a general concave utility function of consumption, as well as special functional forms ranging from linear, log and Constant Relative Risk Aversion (CRRA), have been used. For disutility of labor function, researchers make various assumptions such as being independent of age, depending on age only, or depending on age and life expectancy.
[Insert Table I here.]
Since our objective is to investigate the impact on retirement age of the aging of mortality decline, we use a general non-parametric survival function
to isolate the impact of mortality decline at an arbitrary age. We assume a perfect annuity market for the following reasons. Kalemli-Ozcan and Weil [17] focus on the decrease in the uncertainty about the age at death during the mortality transition, and show that mortality decline may lead to earlier retirement. Their suggested mechanism depends crucially on a lack of annu-ities, since the effect on retirement age of a decrease in the variability of age at death is eliminated if perfect annuities exist, and other channels associated with mortality decline lead to a delay in retirement (see the discussion in pp. 76-77 of their article). We make the opposite assumption of perfect annuity market, such that the channel through the decrease in the variability of age at death is shut down, and any possible effect of mortality decline is purely due to the aging of mortality decline.8
Following most researchers, we choose an objective function with time separability as well as separability in consumption and labor. For the vari-ous specifications about disutility of labor mentioned in Table I, we obtain the same qualitative results. Since the intuition is most clearly seen when disutility of labor depends on age only, we make this assumption in the main model of this section, and incorporate the role of life expectancy in the disu-tility of labor function in Section 4.1. For udisu-tility of consumption, we start with a general concave function and obtain unambiguous results about the impact on retirement age of mortality decline after retirement. However, the effects of mortality reductions before retirement are ambiguous in general. To obtain sharper results, we make further assumptions regarding the utility function, and we do so in two directions: (a) assuming CRRA, as in Heijdra and Romp [15] and Kalemli-Ozcan and Weil [17]; and (b) assuming = , as in Hazan [13] and Bloom et al. [4]. In either case, the stronger assumptions allow us to provide interesting economic interpretations of the results.9
We obtain the individual’s optimal consumption and retirement choices in two steps. First, conditional on a particular retirement age, we obtain the optimal consumption path. Define the optimal consumption at age , conditional on retirement age , as ( ). Second, based on the conditional consumption choices in the first step, we obtain the optimal retirement age. This two-step procedure has also been used in d’Albis and Augeraud-Véron [1] and Heijdra and Romp [15].
8In Section 4.2, we conduct robustness analysis regarding annuity market imperfection. 9To summarize, our assumptions of the survival function, annuity market and objective
function turn out to be very similar to those in Heijdra and Romp [15] and Bloom et al. [4].
In the following analysis, we assume that there exists an age such that
− +
0()
() ≤ 0 (7)
for all ≥ , and
− () 0( (0 ))− − () 0 (8)
for all ≤ .10 We also assume that
−Ω (Ω) 0( (0 Ω))− −Ω (Ω) 0 (9)
In Proposition 1, we characterize the optimal consumption path and re-tirement age. We also show that the interior solution for rere-tirement age, ∗ ∈ (0 Ω), exists and is unique when (7) to (9) hold.11 The proof of
Propo-sition 1 is given in Appendix A.
Proposition 1. For the life-cycle model given by (1) to (6), the optimal path of consumption, conditional on retirement age , is characterized by
0( ( )) = (−)0( (0 )) (10)
Moreover, an interior optimal retirement age ( ∗), which is defined by
−∗ (∗) 0( (0 ∗)) = −∗ (∗) (11)
exists and is unique if (7) to (9) are satisfied.
Eq. (10) is the (continuous-time version of) Euler equation characterizing the optimal consumption path. The retirement age decision is determined by the two terms on the right-hand side of (A5) in Appendix A; the first term is the marginal benefit of delaying the retirement age at age , the second term is the marginal cost, and both are discounted back to age 0.12 Equating
the marginal benefit with marginal cost and simplifying gives condition (11).
10Assumption (7), which may be restrictive for younger ages, is reasonable for older ages
(say, for ages above = 50), since wage profile is usually hump-shaped. Assumption (8) is reasonable for younger ages below , since disutility of labor is quite low when compared with the benefit of working at these ages. Together with assumption (9), they are sufficient for Proposition 1 to hold.
11For a modern economy, corner solutions of retirement age are not very interesting. 12Equivalently, (11) can be expressed as (∗) 0( (∗ ∗)) = (∗). This form has
been used, for example, in Sheshinski [21, chapter 4]. We use (11) because it is more convenient to present our subsequent results in terms of the initial consumption level (0 ∗).
3
Differential incentives for early retirement
We now study the differential incentives for early retirement at different stages of the mortality transition. The use of a general survival function (1) allows us to consider the derivative of optimal retirement age with respect to a mortality change “around” an arbitrary age 0 ∈ (0 Ω), holding mortalityrates at other ages unchanged. Specifically, we use the Volterra derivative of a functional (see, for example, Ryder and Heal [20, Section 3]) to analyze the impact of a change in (0). First, using (1), we obtain
− () (0) = ½ 0 () if 0 if ≥ 0 (12)
Note that we use −()(
0), which corresponds to the effect on survival
proba-bility of a mortality decrease, instead of that of a mortality increase, (()
0).
Eq. (12) has an intuitive interpretation that a mortality decline at age 0
only increases the survival probability at ages above or equal to 0, but has
no effect on survival probability before that age.
To examine the impact on optimal retirement decision of a change in mortality rate at age 0, we totally differentiating (11) with respect to ∗
and (0) to obtain13 ∗ (0) = 1 ((0∗)) 1 (0∗) (0∗) (0) h − + (0(∗∗)) − 1 ((0∗)) 1 (0∗) (0∗) − 0(∗) (∗) i (13) where () = − 0() 00() 0 (14)
is the elasticity of intertemporal substitution when consumption level is . Combining (7), (13) and (14), we have
∙ −∗ (0) ¸ =− ∙ − (0 ∗) (0) ¸ (15)
which means that retirement age and initial consumption move in opposite directions for the optimal solution. The intuition of (15) can be seen from (11). When an external shock (such as a mortality change) increases initial
13Note that initial consumption depends on mortality rate at an arbitrary age
0, (0),
directly as well as indirectly through ∗. While one may express this dependence explicitly
as (0 ∗( ()) ()) for the comparative static exercises in this section, we maintain
consumption, the marginal utility of consumption, 0( (0 ∗)), decreases.
Looking at the two terms in (11) from a marginal benefit and marginal cost perspective, such a mortality change shifts the marginal benefit (of delaying retirement age) schedule downward, but the marginal cost schedule remains unchanged. As a result, optimal retirement age decreases.
The impact of mortality decline in this model is given in Proposition 2. In particular, we obtain unambiguous result concerning the signs of the effects on the consumption path and retirement age of mortality reductions at ages after retirement. The proof is given in Appendix B.
Proposition 2. For the life-cycle model given by (1) to (6), (a) the sign of (−∗
0) is the same as that of (0), and
(b) when 0 ≥ ∗,
− ( ∗) (0)
0 (16)
for all ∈ (0 Ω), and
−∗
(0)
0 (17)
The intuition of Proposition 2 (a) is as follows. A mortality decline at an arbitrary age 0 affects lifetime earning and consumption. The effect on
lifetime earning, given in the right-hand side of (A6), is through changes in survival probabilities. The effect on lifetime consumption, on the other hand, is through changes in survival probabilities and in the consumption level; see the left-hand side of (A6). Since mortality decline at 0only induces increases
in survival probabilities at all ages above it, the two terms related to changes in survival probabilities in (A6) turn out to be closely related to the level of financial assets at 0, because of the intertemporal budget constraint at
0. Combining with an implication of the Euler equation (10) that −(
∗)
(0)
must be of the same sign for all , we can express −(0( ∗)
0) in terms of (0),
as in (A10). Together with (15), we prove Proposition 2 (a).
Proposition 2 (b) is immediate since (0) must be positive for 0 ≥ ∗
to support post-retirement consumption. A further look at the proof of Proposition 2 (b) provides interesting insights useful for subsequent analysis. A mortality decline at 0 ≥ ∗ does not affect lifetime earning. Thus, the
two terms related to lifetime consumption, given in the left-hand side of (A6), have to sum to zero. These two terms represent the effect of consumption level changes (at unchanged survival probabilities) and survival probability changes (at unchanged consumption level), respectively. It is easy to see that the second term, related to survival probability changes, is positive. This implies that the first term, related to consumption level changes, must be negative. According to (A9), −(( ∗)
that the new consumption path must be either all above or all below the old consumption path. If the new consumption path is above the old one, the first term on the left-hand side of (A6) is positive, and it is inconsistent with the intertemporal budget constraint. Thus, this possibility is excluded, and we obtain (16) and (17) in Proposition 2 (b).
It is observed from Appendix B that the proof of Proposition 2 (b) de-pends only on the intertemporal budget constraint and the Euler equation, and it holds for all functional forms of (). This proof works for 0 ≥ ∗
because a mortality decline at a post-retirement age does not affect lifetime earning. On the other hand, when a mortality decline happens before retire-ment, it affects lifetime earning, and Proposition 2 (a) shows that the impact on optimal retirement age depends on the sign of (0), or equivalently, the
relative magnitude of RΩ
0
− () ( ∗) and R∗ 0
− () () . It
is difficult to obtain further results about the sign of (−∗
0), and the source of
difficulty is that with a general utility function, there is no explicit solution for the endogenous consumption path ( ∗). Fortunately, it is well known
that the consumption path can be solved when (a) the instantaneous utility function is CRRA, and (b) = . In the following, we exploit this knowledge and examine these special cases.
3.1
CRRA utility function
For the first special case, we assume that () =
1−1 − 1
1− 1
(18)
where 0 is the constant elasticity of intertemporal substitution for the CRRA utility function. In this case, it can further be shown that the initial consumption level, conditional on retirement age , is given by14
(0 ) = (0) (0 ) (19) where (0 ) = Z 0 − () () (20)
14When the instantaneous utility function is CRRA, (A1) can be simplified as
( )
= ( − ) ( ) (A1a) Using (A1a) and (A3), we obtain (19).
is the individual’s human wealth (i.e., non-financial wealth) at age 0 condi-tional on retirement age , and
(0) = ∙Z Ω 0 −[(1−)+] () ¸−1 (21) is the marginal (and average) propensity to consume with respect to human wealth at age 0.
According to (19), initial consumption is equal to the product of marginal propensity to consume and human wealth. Therefore, we can decompose the impact of mortality change on initial consumption, measured in percentage, as the sum of the impact of mortality change, again in percentage, on mar-ginal propensity to consume and on human wealth according to
1 (0 ∗) µ − (0 ∗) (0) ¶ = 1 (0) µ − (0) (0) ¶ + 1 (0 ∗) µ − (0 ∗) (0) ¶ =− RΩ 0 −[(1−)+] () RΩ 0 −[(1−)+] () + 1 (0 ∗) µ − (0 ∗) (0) ¶ (22) Note that (0)1 ³−(0)( 0) ´
does not depend on ∗, and (12) and (21) have been
used in the second equality of (22).
A mortality decline leads to a higher expected number of years to live. This translates into more years to consume, and thus the marginal propensity to consume is reduced. This effect, which is always negative, is represented by the first term on the right-hand side of (22), and we will refer it as the “years-to-consume” effect. Initial consumption will be reduced if lifetime human wealth remains unchanged. A mortality decline, however, generally increases the expected lifetime human wealth. This effect, which is non-negative, is represented by the second term on the right-hand side of (22), and we refer to it as the “lifetime human wealth” effect.
We now apply this decomposition to the life-cycle model with the CRRA utility function. Obviously, Proposition 2 is applicable for this special case. In particular, a mortality decline at an age 0 ≥ ∗ leads to a delay in
retirement age. For the CRRA utility function, our decomposition provides an additional interpretation of the result in Preposition 2 (b). A mortality decline at a post-retirement age does not affect lifetime human wealth (i.e., the second term on the right-hand side of (22) becomes zero). As a result, there is only a years-to-consume effect for this mortality change. This leads to a negative effect on initial consumption and thus, through (15), a delay in optimal retirement age.
The analysis for a mortality decline occurring at an age before retirement is more complicated. In this case, there is a negative lifetime human wealth effect and a positive years-to-consume effect on initial consumption. The overall result is generally ambiguous, and (15) and (22) imply that the sign of (−∗
0) is the same as that of
(0)≡ RΩ 0 −[(1−)+] () RΩ 0 −[(1−)+] () − R∗ 0 − () () R∗ 0 − () () (23)
Eq. (23) indicates that, when a mortality decline occurs at such an age that there is a substantial increase in expected lifetime human wealth, the lifetime human wealth effect dominates the years-to-consume effect, leading to an increase in initial consumption. The substantial increase in lifetime resources leads to an increase in optimal consumption initially, resulting in earlier retirement according to (15).
The analysis up to this point only indicates that a mortality decline at a younger age leading to an earlier retirement age is a possibility when the life-time human wealth effect dominates the years-to-consume effect. This condi-tion is consistent with a negative financial asset level according to Proposicondi-tion 2 (a), which holds for a general concave utility function. With the CRRA utility function, however, the above decomposition allows us to find suffi-cient conditions under which sharper results are obtained. They are stated in Proposition 3.
Proposition 3. In the life-cycle model with the CRRA utility function, if (0) R∗ 0 − () () RΩ 0 −[(1−)+] () = (0 ∗) (24) and 0()
() is a monotonic function of for all ∈ (0
∗) (25)
then there exists a critical age within the open interval (0 ∗) such that
(a) −(( ∗)
0) 0 for all ∈ (0 Ω) and
−∗
(0) 0 for all 0 ∈ (0 ),
(b) −(( ∗)
0) = 0 for all ∈ (0 Ω) and
−∗
(0) = 0 when 0 = , and
(c) −(( ∗)
0) 0 for all ∈ (0 Ω) and
−∗
(0) 0 for all 0 ∈ (
∗).
Proposition 3 can be understood by comparing the relative magnitude of the lifetime human wealth and years-to-consume effects. In Fig. 2, we provide numerical analysis to examine each of these effects as a function of 0, the
commonly-used parameter values of = 005, = 002 and = 05. The age-specific mortality rates are the average taken from the 1990 to 1999 cohorts of US men from the Berkeley Mortality Database. The wage profile data, taken from the Current Population Survey (http://cps.ipums.org/cps/), are based on the average labor income for US men who are in the labor force from 1990 to 1999.15 It can be seen from (23) that each of the terms on the right-hand side of (23) is downward sloping, with the first term (the years-to-consume effect) decreasing from 1 at the beginning age to some value between 0 and
1 at age ∗ (point A in Fig. 2) and then to 0 at age Ω, and the second
term (the lifetime human wealth effect) decreasing from 1 at the beginning age to 0 at age ∗, thereafter remaining at 0. According to the proof of
Proposition 3, given in Appendix C, if the initial level of wage income, (0), is sufficiently low such that (24) holds, then there exists an interval within which a mortality decline at a particular age will lead to earlier retirement. Moreover, if the wage profile is such that the initial wage level satisfies (24) and its growth rate satisfies the monotonicity properties (25), then there exists a threshold age after which the years-to-consume effect dominates
the lifetime human wealth effect.16 As a result, a mortality decline after the threshold age leads to a higher optimal retirement age. On the other hand, a mortality decline before the threshold age leads to earlier retirement because the lifetime human wealth effect dominates the years-to-consume effect.
[Insert Fig. 2 here.]
3.2
When interest and discount rates are equal
For the second special case, we assume that
= (26)
From (5), (10) and (26), it can be seen that ( ) is independent of age. Because of this property, we can solve (0 ) in a form similar to (19), such that (0 ) is given by (20) and
(0) = ∙Z Ω 0 − () ¸−1 (21a)
15We have performed a robustness check and obtained similar results when, for example,
the survival and wage data are from 1980 to 1989.
16Note that assumption (24) implies that the individual is in debt at young ages. It is
easy to see that either a constant or exponential wage profile satisfies the monotonicity (of growth rate) assumption (25). An empirically more relevant hump-shaped wage profile (where 00() ≤ 0 in the relevant region with a strictly negative value for some ) also satisfies (25), because h()0()i=
00()()−[0()]2
Following an analysis similar to that for the CRRA utility function, it can be shown that17
Proposition 4. In the life-cycle model with = , if (0) R∗ 0 − () () RΩ 0 − () (24a) and (25) hold, then there exists a critical age ∈ (0 ∗) such that
(a) −(( ∗)
0) 0 for all ∈ (0 Ω) and
−∗
(0) 0 for all 0 ∈ (0 ),
(b) −(( ∗)
0) = 0 for all ∈ (0 Ω) and
−∗
(0) = 0 when 0 = , and
(c) −(( ∗)
0) 0 for all ∈ (0 Ω) and
−∗
(0) 0 for all 0 ∈ (
∗).
As for the CRRA utility function, the impact of mortality decline on re-tirement age for this special case can be decomposed into the lifetime human wealth and years-to-consume effects.
3.3
Comparisons with Kalemli-Ozcan and Weil [17]
The result that a mortality decline (at some young ages before retirement) may lead to an earlier retirement age is quite counterintuitive, and has not been emphasized much in the literature. One exception is Kalemli-Ozcan and Weil [17], who argue that, when mortality is high, people who plan to save for retirement have a high risk of dying young and wasting their savings.18
As a result, the optimal plan is to work until a very old age or even until death. On the other hand, when mortality is low and the uncertainty of death is reduced, people may become more willing to plan, and save for, a longer retirement period.
Despite some similarities in the results, our analysis differs significantly from theirs in three major aspects. First, as discussed in Section 2, Kalemli-Ozcan and Weil [17] assume no annuities but we assume that perfect annuities exist. Second, these two articles decompose the effect of mortality decline on
17It is easy to see that when = , (21) becomes (21a), and (24) becomes (24a). As a
result, the proof of Proposition 4 is essentially the same as that of Proposition 3.
18Chang [7] also suggests that early retirement may result when there is a mortality
decline if the individual saves in old age or if the annuity market is imperfect. However, he obtains the results in either a deterministic model or a model in which lifetime uncertainty is captured by an age-invariant mortality process. It is rather unrealistic to assume either no lifetime uncertainty or age-invariant mortality rates, and we, as well as Kalemli-Ozcan and Weil [17], use a model with lifetime uncertainty captured by a general survival function. Heijdra and Romp [15] also show that a mortality decline may lead to early retirement in an open-economy overlapping-generations model. However, they do not emphasize this possibility, but rather point out that, for realistic scenarios, a mortality decline will lead to a delay in retirement.
retirement age in different ways. Kalemli-Ozcan and Weil [17] use a model with rectangular survival (as well as a model with exponential survival and perfect annuity market) to show that a mortality decline leads to a delay in retirement, an outcome they call the “horizon effect”, which is similar to the years-to-consume effect discussed above. They then use models with more general mortality processes and no annuities, and identify the effect of a mortality decline on retirement age as the sum of the horizon effect and what they call the “uncertainty effect”. On the other hand, we emphasize the lifetime human wealth effect instead of the uncertainty effect. Third, they analyze simultaneous mortality changes at all ages, but we analyze the effect of mortality decline at an arbitrary age, holding mortality rates at other ages unchanged.
The differences in features between Kalemli-Ozcan and Weil [17] and this article can be traced to the fact that these two articles emphasize different aspects of mortality decline. Kalemli-Ozcan and Weil [17] focus on a decrease in the uncertainty about the age at death, whereas we focus on the aging of mortality decline. They examine the impact of mortality reductions at all ages, since a decrease in the variability of age at death is more meaningful when one considers mortality reductions at all ages. Moreover, they show that mortality decline may lead to early retirement if the uncertainty effect is very strong. On the other hand, we find that the lifetime human wealth effect is important for the aging of mortality decline channel. We examine mortality decline at an arbitrary age (instead of a mortality decline process consisting of mortality changes at all ages) to highlight that mortality reductions at different ages have systematically different effects on lifetime human wealth, and thus on retirement age.
Both the decrease in the variability of age at death and the aging of mor-tality decline are associated with the mormor-tality transition; see, for example, Wilmoth and Horiuchi [23, Fig. 1].19 Kalemli-Ozcan and Weil [17] and this
article are complementary, since their work focuses on one aspect of mortal-ity decline and we focus on the other, and both show that mortalmortal-ity decline may lead to early retirement.
4
Extension
In Section 3, we obtain the systematic difference between the effects on re-tirement age of a mortality decline at younger and older ages in a life-cycle
19Interestingly, Figs. 1 and 2 in Kalemli-Ozcan and Weil [17] are similar to Figs. 1b and
1c of Wilmoth and Horiuchi [23], and the two panels in Fig. 1 of this article are similar to Figs. 1a and 1c of Wilmoth and Horiuchi [23].
model with the most essential features. The roles of some features of this ba-sic model are as follows. By assuming a perfect annuity market, the survival probability () has the same effect on the marginal benefit and marginal cost of delaying retirement, as seen in (11) or (A5). By assuming that disu-tility of labor depends only on age and not on life expectancy, a mortality change shifts the marginal benefit schedule of delaying retirement, but not the marginal cost schedule. These assumptions enable us to obtain the sharp results in Section 3 and to provide intuitive interpretation.
We now demonstrate that the results in the previous section continue to hold when various assumptions are relaxed. Specifically, we consider: (a) a dependence of disutility of labor on both current age and life expectancy, which affects the marginal cost of delaying retirement; and (b) the possibility of imperfect annuities, which affects the marginal benefit and marginal cost of delaying retirement differently.20
4.1
Allowing for compression of morbidity
One feature associated with the phenomenon of mortality decline is that, besides living longer, individuals also tend to remain healthy for a longer du-ration, as demonstrated by the average sixty-year-old today, who is healthier than a typical sixty-year-old a century ago. To capture this phenomenon, Bloom et al. [3] assume that both health status and disutility of labor de-pend on age relative to life expectancy. They argue that this assumption is consistent with the hypothesis of compression of morbidity, in which the relative, or even absolute, length of time spent in chronic ill-health toward the end of life declines when life expectancy increases (Bloom et al. [3, p. 94]). We follow their logic in this sub-section, but allow for a slightly more general specification in which disutility of labor depends on age positively and on life expectancy negatively.
In this case, the objective function (2) is replaced by
Z Ω 0 − () ( ()) − Z 0 − () ( ()) (27) where () = RΩ () () (28)
20We have also considered the presence of a social security system and found that our
results continue to hold in such an environment. These analyses are not presented here, but are available to interested readers upon request.
is life expectancy at age , and 01( ()) 0and 02( ()) 0 are the partial derivatives of the disutility function ( ()) with respect to age and life expectancy, respectively. There is no change in the budget constraint (3). It can be shown that the optimal retirement age is characterized by
−∗ (∗) 0( (0 ∗)) = −∗ (∗ (∗)) (29)
The first-order condition (29) is similar to (11), except that disutility of labor now depends on life expectancy as well.
Because a mortality change can affect life expectancy according to (28), we can use (1) and (28) to obtain
− () (0) = ( ( 0)(0) () 0 if 0 if ≥ 0 (30)
Note that life expectancy at a particular age is the expectation of further years of life beyond that age. Therefore, a mortality decline at 0 only
affects life expectancy before that age, but has no effect on life expectancy at an age above or equal to 0.
It can be shown from (29) and (30) that ∙ −∗ (0) ¸ =− ∙ − (0 ∗) (0) ¸ (31) for 0 ≤ ∗, and ∙ −∗ (0) ¸ =− ∙ 1 (0 ∗) µ − (0 ∗) (0) ¶ + ( (0 ∗)) 0 2(∗ (∗)) (∗ (∗)) (0) (0) (∗) ¸ 0 (32) for 0 ∗.
A mortality decline at an age ≤ ∗ will have no effect on life expectancy
at ∗, according to (30). As a result, (31) states that there is no change in the marginal cost schedule, as in the analysis of Section 3. It is clear that the results in that section continue to hold when disutility of labor depends also on life expectancy.
When 0 ∗, both (01 ∗) ³ −(0∗) (0) ´ and ( (0 ∗))02(∗(∗)) (∗(∗)) (0)(0) (∗)
in (32) are negative, and their effects on the marginal benefit and marginal cost schedules of delaying retirement are as follows. Since a mortality decline after retirement does not affect lifetime earning, a higher consumption path is inconsistent with the (unchanged) budget constraint. Therefore, (0 ∗)
decreases and the marginal utility of consumption increases, leading to an upward shift of the marginal benefit (of delaying retirement) schedule. Thus, the first term is negative, and the intuition is the same as in Section 3. For the second term, a mortality decline at 0 ∗ will affect life expectancy at
the optimal retirement age, (∗), positively. Thus, it affects the marginal
cost of delaying retirement negatively because 02( ()) 0. As a result,
the marginal cost schedule shifts downward. Both effects lead to an increase in the optimal retirement age.
We conclude that the qualitative results of Section 3 are also applicable when disutility of labor depends on both age and life expectancy.
4.2
Allowing for imperfect annuities
As mentioned in Section 2, we assume a perfect annuity market so as to focus on the effect due to the aging of mortality decline. Because the effect on retirement age of a decrease in the uncertainty about the age at death is eliminated by perfect annuities (Kalemli-Ozcan and Weil [17]), the perfect annuity assumption guarantees that any possible effect obtained in our model is caused by factors other than the uncertainty effect.
While the perfect annuity market has been a useful theoretical benchmark in many articles (including Bloom et al. [3, 4], Boucekkine et al. [6] and Heijdra and Romp [15], which are reviewed in Table I) since Yaari [24], there are imperfections in actual annuity markets. One may question whether the results in earlier sections will continue to hold or not in imperfect annuity markets. We now examine this question by using a tractable specification commonly used in the literature to model annuity market imperfection.21
The objective function of the life-cycle model is not affected by the as-sumptions of the annuity market, and is given by (2). On the other hand, the budget constraint (3) becomes
0() = ½ [ + ()] () + ()− () [ + ()] ()− () if ≤ if (33)
where (0 ≤ 1) measures the degree of imperfection of the annuity market. Hu [16] and Heijdra and Mierau [14] assume that all assets have the
21Different reasons such as adverse selection and bequest motive have been suggested
to explain why many people purchase zero or only a small amount of annuities. Providing detailed analysis regarding different sources of annuity market imperfection, while inter-esting, would be a distraction from this article’s primary objective. We simply follow the approach used by Hu [16], Hansen and ˙Imrohoro˘glu [12] and Heijdra and Mierau [14] to capture the “mis-pricing” of annuities in an imperfect market. This specification allows us to use the methods in earlier sections and extend the economic intuitions there.
same rate of return, which is a weighted average of the rate of return with no annuities and that with perfect annuities. On the other hand, Hansen and ˙Imrohoro˘glu [12] assume that a fraction of assets is annuitized with a higher rate of return and the remaining fraction is not. Either interpretation is consistent with (33). The annuity market is perfect when = 1, and imperfect when 1.
It can be shown that the optimal retirement age is characterized by −∗ (∗)−(1−) (∗) 0( (0 ∗)) = −∗ (∗) (34)
The effect of annuity market imperfection is reflected in the term (∗)−(1−) in (34). The reason for its presence is as follows. When deciding whether to delay retirement or not, the benefit is the marginal utility of the labor income earned, which is discounted back to age 0. Since the rate of re-turn of holding financial assets at age is + () the discount factor is given by −0∗[+()] = −∗ (∗), and thus the marginal benefit is
−∗
(∗)
(∗) 0( (0 ∗)). The term (∗) is also present in the cost
side (through the disutility of labor), as seen in (A5). After cancellation of terms, (∗)−(1−) appears on the left-hand side of (34). In the limiting case of perfect annuities ( = 1), the two effects related to the survival probability at ∗ cancel out exactly. To summarize, relative to perfect annuities, market
imperfection reduces the rate of return of accumulating financial assets. As a result, the importance of the survival probability at ∗ on the marginal
benefit of delaying retirement is less than that on the marginal cost, leading to a net effect of (∗)−(1−) on the marginal benefit schedule.
From (34), we obtain ∙ −∗ (0) ¸ = ∙ −1 ( (0 ∗)) 1 (0 ∗) µ − (0 ∗) (0) ¶ − (1 − ) (1∗) µ − (∗) (0) ¶¸ (35)
Following steps similar to those in Appendix B, it can be shown that when the annuity market is imperfect,
− (0 ∗) (0) = −0 ( 0) (0) + (1− ) RΩ 0 − ()³−0((∗)) 00((∗)) ´ h 00((0∗)) 0((0∗)) i RΩ 0 − () ³−0((∗)) 00((∗)) ´ (36) Note that both integrals on the right-hand side of (36) are positive for 0 ∈
(0 Ω), and the denominator on the right-hand side is negative.
A mortality decline after retirement does not affect the survival proba-bility at age ∗. Therefore, −((∗)
0) = 0 and the sign of
−∗
that of −(0( ∗)
0) , according to (35). Furthermore, we know that (0) after
retirement is positive. As a result, we conclude that when 0 ∗,
= ∙ −∗ (0) ¸ =− ∙ − (0 ∗) (0) ¸ 0 (37)
A mortality decline after retirement also leads to a delay in retirement age when the annuity market is imperfect.
For a mortality decline before retirement, −((∗)
0) = ( ∗). Thus, (35) leads to ∙ −∗ (0) ¸ = ∙ −0 ( 0) (0)− (1 − ) Z 0 0 − () µ −0( ( ∗)) 00( ( ∗)) ¶ ¸ (38)
for 0 ≤ ∗. Since (0) may be positive or negative before retirement, a
mortality decline before retirement may or may not lead to earlier retire-ment. Moreover, the effect of annuity market imperfection on retirement age can be seen by comparing (38) with Proposition 2 (a). For a perfect annu-ity market, Proposition 2 (a) indicates that −∗
(0) is negative if and only if
(0) is negative. On the other hand, (38) implies that with annuity
mar-ket imperfection, (−∗
0) may still be negative even if (0) is zero or slightly
positive. In this sense, imperfect annuities strengthen the result of earlier retirement when 0 ≤ ∗. Intuitively, we know from (34) that the annuity
market imperfection reduces the return of holding financial assets, leading to a downward shift of the marginal benefit (of delaying retirement) sched-ule. Other things being equal, this annuity market imperfection effect tends to reduce the optimal retirement age when mortality decline occurs before retirement.
We conclude that when annuities are imperfect according to (33), a mor-tality decline after retirement always leads to a delay in retirement, but a mortality decline before retirement may lead to earlier or later retirement. The results for the basic life-cycle model in Section 3 continue to hold when there is annuity market imperfection.
5
Conclusion
An important feature of mortality transition is that a mortality decline affects mainly younger people in its early phase but pertains to older people in the later phase. Motivated by these stylized facts, we examine the effect on optimal retirement age of a change in mortality at an arbitrary age.
This article makes two significant contributions. First, we show that a mortality decline at older ages (above the optimal retirement age) will always
result in a delay in retirement, while a mortality decline at younger ages may or may not lead to early retirement. The intuition of this result is as follows. When a mortality decline occurs among older people, the lifetime human wealth effect is absent and thus the years-to-consume effect always leads to a delay in retirement. For mortality decline at younger ages, we find that, under some general conditions concerning the wage profile, there is a threshold age before which the lifetime human wealth effect dominates and the optimal retirement age decreases when there is a mortality decline. On the other hand, optimal retirement age increases with a mortality decline after the threshold age. We show that this systematic difference is also present when the model is extended to account for compression of morbidity and annuity market imperfection.
Our analysis of the effect on retirement age of mortality decline at an ar-bitrary age is complementary to the study by Kalemli-Ozcan and Weil [17], who focus on another important feature of mortality transition: the decrease in the uncertainty about the age at death. Interestingly, both articles show that a mortality decline may lead to early retirement under some conditions (the uncertainty effect dominates the horizon effect in their model, and the lifetime human wealth effect dominates the years-to-consume effect in our model). The counterintuitive result emphasized in these two articles, which is obtained under different modeling assumptions corresponding to the two salient aspects of mortality transition, should be given more serious atten-tion.22
The second contribution of this article is methodological. Existing stud-ies analyzing the relation between mortality change and retirement age often use indexes or parameters to represent mortality changes, and consider the derivative(s) of the optimal retirement age with respect to the mortality para-meter(s). However, such a change in the mortality parameter usually affects the instantaneous mortality rates (and thus the survival probabilities) at dif-ferent ages. We show that the more fundamental question about the effect on retirement age of a mortality decline at an arbitrary age can be addressed by using the Volterra derivative. As mortality changes at different ages may
22Since our objective in this article is to isolate the effect of mortality change on
re-tirement age, we analyze this effect in an environment in which other potentially impor-tant factors, such as wealth of different cohorts, remain unchanged. However, we share Kalemli-Ozcan and Weil’s [17, p. 89] view that while mortality decline is an important factor affecting average retirement age, it is not the only major factor. One possible future study might incorporate all relevant factors determining retirement age (such as increases in wealth due to technological progress, changing social security benefit, and mortality changes) and examine the relative contributions of these factors at different stages of the mortality transition.
also have systematically different effects on other important variables such as growth rate of output per capita (e.g., Boucekkine et al. [6], Zhang et al. [25]), the analysis in this article leads us to believe that the use of the Volterra derivative will be helpful in other economic-demographic studies in the future.
6
Appendix A: Proof of Proposition 1
Using standard dynamic optimization methods, it can be shown that 00( ( )) ( )
= (− )
0( ( )) (A1)
Since the left-hand side of (A1) equals to 0(()) , solving (A1) gives (10). Substitute ( ), which is characterized by (10), into (2) to express the objective function in terms of only. Denote it by (). Differentiating it with respect to , we obtain
0() = Z Ω 0 − () 0( ( )) ( ) − − () () (A2)
Integrating (3) and using (1), (4) and (5), we obtain the intertemporal budget constraint at age 0 as:
Z Ω 0 − () ( ) = Z 0 − () () (A3)
Differentiating (A3) with respect to leads to
Z Ω
0
− () ( )
=
− () () (A4)
Substituting (10) and (A4) into (A2), we obtain
0() = − () () 0( (0 ))− − () () (A5) Setting 0() to 0 and simplifying, the first-order condition for an interior optimal retirement age is given by (11).
Assumption (8) implies that for ∈ [0 ], the individual’s marginal ben-efit of delaying retirement exceeds the marginal cost. Assumption (9) states that marginal cost of delaying retirement until Ω exceeds marginal benefit. When (8) and (9) hold, the existence of an interior optimal solution for ∗
in the interval ( Ω) is guaranteed. Also, ∗ does not exist in the interval
[0 ].
When (7) holds, the second order condition of the maximization problem is satisfied, because 00()|=∗ = (∗) −∗ (∗) ∙ − + 0(∗) (∗) + 00( (0 ∗)) 0( (0 ∗)) (0 ∗) − 0(∗) (∗) ¸ 0 Since (0∗) 0 and 0() ≥ 0, condition (7) implies that when the net difference of marginal benefit and marginal cost equals to zero, this net differ-ence function is always downward sloping at the interior solution. Therefore, it eliminates the possibility of multiple solutions that satisfy (11).
7
Appendix B: Proof of Proposition 2
Differentiating (A3) at = ∗with respect to (
0), and simplifying, gives23
Z Ω 0 − () ∙ − ( ∗) (0) ¸ + Z Ω 0 − ∙ − () (0) ¸ ( ∗) = Z ∗ 0 − ∙ − () (0) ¸ () (A6)
Similar to (A3), the intertemporal budget constraint at age 0 can be
expressed as −0 ( 0) (0) = ( RΩ 0 − () ( ∗) −R∗ 0 − () () RΩ 0 − () ( ∗) if 0 ∗ if 0 ≥ ∗ (A7)
Substituting (12) and (A7) into (A6), we obtain
Z Ω 0 − () ∙ − ( ∗) (0) ¸ + −0 ( 0) (0) = 0 (A8)
Differentiating (10) at = ∗ with respect to (
0), and simplifying, gives 00( ( ∗)) ∙ − ( ∗) (0) ¸ = 0( ( ∗)) 0( (0 ∗)) 00( (0 ∗)) ∙ − (0 ∗) (0) ¸ (A9)
23Because of (A4), we have RΩ
0 − () (∗) ∗ (0) = −∗ (∗) (∗) ∗ (0).
We obtain (A6) after these two terms are cancelled out. A similar cancellation of terms due to the indirect effects through a change in ∗ is also used in (A9) below.
Substituting (A9) into (A8) gives − (0 ∗) (0) = −0 ( 0) (0) h 00((0∗)) 0((0∗)) i RΩ 0 − () ³ −0((∗)) 00((∗)) ´ (A10)
Combining (5), (15) and (A10), we have ∙ −∗ (0) ¸ =− ∙ − (0 ∗) (0) ¸ = [ (0)]
This proves Proposition 2 (a).
Proposition 2 (b) is immediate from Proposition 2 (a) since (0) must
be positive for 0 ∈ [∗ Ω) at the optimal solution.
8
Appendix C: Proof of Proposition 3
From (23), we obtain (0) = 0, (∗) 0, 0(0) = − −[(1−)+]0 ( 0) RΩ 0 −[(1−)+] () + −0 ( 0) (0) R∗ 0 − () () (A11) and 00(0) = [(1− ) + + (0)] −[(1−)+]0 (0) RΩ 0 −[(1−)+] () − h + (0)− 0(0) (0) i −0 ( 0) (0) R∗ 0 − () () (A12)
Therefore, a sufficient condition for (0) 0in some interval within (0 ∗)
is 0(0) 0. It can be shown from (A11) that 0(0) 0 iff
1 RΩ 0 −[(1−)+] () R∗ (0) 0 − () ()
which is equivalent to (24). Since () is continuous in [0 ∗], (0) = 0, 0(0) 0 and (∗) 0 imply that there exists a critical age
within
(0 ∗) such that (
) = 0 and (0) is negative for all 0 .
Moreover, the above properties imply that at least one local extremum
must exist between (0 ∗). At a local extremum (denoted by e
0, with
0(e
0) = 0), we can use (A11) and (A12) to obtain
00(e0) = h 0(0) (0) − ( − ) i −0 (e 0) (e0) R∗ 0 − () () (A13)
Arrange the extrema (where ≥ 1) in an ascending order as a sequence {e0}, = 1 2 . Since (24) implies that the first local extremum is a
minimum, this sequence has the property that 00(e0) 0 for all which
are odd and 00(e
0) 0 for all which are even. According to (A13), the
sign of 00(e0) is the same as that of 0(0)
(0) − ( − ). There are three
distinct cases for (25): (i) h()0()i = 0 for all , (ii) h()0()i ≥ 0 for all with a strictly positive value for some , and (iii) h()0()i≤ 0 for all with a strictly negative value for some . When (24) and either (i) or (ii) hold, then 0(0)
(0) − ( − ) is always positive and must be 1. When (24)
and (iii) hold, then may be either 1 or 2. (The shape of function (0) in
the lower panel of Fig. 2 is based on this case, with = 2.) In each of the above cases, there is only one such that () = 0 and (0) is positive
for all 0 . This proves Proposition 3.
References
[1] H. d’Albis, E. Augeraud-Véron, Endogenous retirement and monetary cycles, Math. Population Stud. 15 (2008), 214-229.
[2] O. J. Blanchard, Debt, deficits, and finite horizons, J. Polit. Economy 93 (1985), 223-247.
[3] D. E. Bloom, D. Canning, R. K. Mansfield, M. Moore, Demographic change, social security systems, and savings, J. Monet. Econ. 54 (2007), 92-114.
[4] D. E. Bloom, D. Canning, M. Moore, Optimal retirement and saving with healthy aging, Working Paper, Harvard School of Public Health and Queen’s University, Belfast, 2010. (A previous version was entitled “A theory of retirement,” NBER Working Paper 13630.)
[5] A. Bommier, Rational impatience? Working Paper, Toulouse School of Economics, 2008.
[6] R. Boucekkine, D. de la Croix, O. Licandro, Vintage human capital, de-mographic trends and endogenous growth, J. Econ. Theory 104 (2002), 340-375.
[7] F.-R. Chang, Uncertain lifetimes, retirement and economic welfare, Eco-nomica 58 (1991), 215-232.
[8] D. L. Costa, The Evolution of Retirement, Univ. of Chicago Press, Chicago, 1998.
[9] D. Cutler, A. Deaton, A. Lleras-Muney, The determinant of mortality, J. Econ. Perspect. 20 (3) (2006), 97-120.
[10] J. Gruber, D. A. Wise, Social security and retirement: An international comparison, Amer. Econ. Rev. Papers and Proceedings 88(2) (1998), 158-163.
[11] J. Gruber, D. A. Wise, Introduction and summary, in: J. Gruber, D. A. Wise (Eds.), Social Security and Retirement around the World, Univ. of Chicago Press, Chicago, 1999, pp. 1-35.
[12] G. D. Hansen, S. ˙Imrohoro˘glu, Consumption over the life cycle: The role of annuities, Rev. Econ. Dynam. 11 (2008), 566-583.
[13] M. Hazan, Longevity and lifetime labor supply: Evidence and implica-tions, Econometrica 77 (2009), 1829-1863.
[14] B. J. Heijdra, J. O. Mierau, Annuity market imperfection, retirement and economic growth, CESifo Working Paper 2717, 2009.
[15] B. J. Heijdra, W. E. Romp, Retirement, pensions, and ageing, J. Public Econ. 93 (2009), 586-604.
[16] S.-C. Hu, Economic growth in the perpetual-youth model: Implications of the annuity market and demographics, J. Macroecon. 21 (1999), 107-124.
[17] S. Kalemli-Ozcan, D. Weil, Mortality change, the uncertainty effect, and retirement, J. Econ. Growth 15 (2010), 65-91.
[18] R. Lee, The formal demography of population aging, transfers, and the economic life cycle, in: L. G. Martin, S. H. Preston (Eds.), Demography of Aging, National Academy Press, Washington, D. C., 1994, pp. 8-49. [19] A. R. Omran, The epidemiologic transition: A theory of the
epidemi-ology of population change, The Milbank Memorial Fund Quarterly 49 (No. 4, Pt. 1) (1971), 509-538.
[20] H. E. Ryder, G. M. Heal, Optimal growth with intertemporally depen-dent preferences, Rev. Econ. Stud. 40 (1973), 1-31.
[21] E. Sheshinski, The Economic Theory of Annuities, Princeton Univ. Press, Princeton, 2008.
[22] V. Volterra, Theory of Functionals and of Integral and Integro-differential Equations, Dover Publications, Inc., New York, 1959
[23] J. R. Wilmoth, S. Horiuchi, Rectangularization revisited: Variability of age at death within human populations, Demography 36 (1999), 475-495.
[24] M. E. Yaari, Uncertain lifetime, life insurance, and the theory of the consumer, Rev. Econ. Stud. 32 (1965), 137-150.
[25] J. Zhang, J. Zhang, R. Lee, Rising longevity, education, savings, and growth, J. Devel. Econ. 70 (2003), 83-101.
0 20 40 60 80 100 0 0.2 0.4 0.6 0.8 1
Comparison of Survival Curves
actual age survival probability 1900s 1910s 1980s 1990s 20 30 40 50 60 70 80 90 100 110 −10 −8 −6 −4 −2 0
Comparison of Mortality Rates
actual age
mortality (in log)
1900s 1910s 1980s 1990s