HAL Id: halshs-02019046
https://halshs.archives-ouvertes.fr/halshs-02019046v4
Preprint submitted on 23 Nov 2020
HAL is a multi-disciplinary open access
archive for the deposit and dissemination of sci-entific research documents, whether they are pub-lished or not. The documents may come from teaching and research institutions in France or abroad, or from public or private research centers.
L’archive ouverte pluridisciplinaire HAL, est destinée au dépôt et à la diffusion de documents scientifiques de niveau recherche, publiés ou non, émanant des établissements d’enseignement et de recherche français ou étrangers, des laboratoires publics ou privés.
Impact of later retirement on mortality: Evidence from
France
Antoine Bozio, Clémentine Garrouste, Elsa Perdrix
To cite this version:
Antoine Bozio, Clémentine Garrouste, Elsa Perdrix. Impact of later retirement on mortality: Evidence from France. 2020. �halshs-02019046v4�
WORKING PAPER N° 2019 – 10
Impact of Later Retirement on Mortality:
Evidence from France
Antoine Bozio Clémentine Garrouste
Elsa Perdrix
JEL Codes: I10, J14, J26, H55
Impact of Later Retirement on Mortality:
Evidence from France
∗
Antoine Bozio
Clémentine Garrouste
Elsa Perdrix
November 2020
Abstract
This paper investigates the impact of delaying retirement on mortality among the French population. We take advantage of the 1993 pension reform in the pri-vate sector to identify the causal effect of an increase in claiming age on mortality. We use administrative data which provide detailed information on career charac-teristics, dates of birth and death. Our results, precisely estimated, show that an exogenous increase of one year in the claiming age has no significant impact on the probability to die, measured between age 61 and 79. To test the power of our sam-ple to detect statistically significant effects for rare events like death, we compute minimum detectable effects (MDE). Our MDE estimates suggest that, if an impact of later retirement on mortality would be detectable, it would remain very small in magnitude.
JEL Codes: I10, J14, J26, H55
Keywords: pension reform, health, mortality
∗Bozio: Paris School of Economics (PSE), EHESS. Garrouste: Université Paris-Dauphine, PSL
Re-search University, CNRS, IRD, LEDa-LEGOS, 75016 Paris, France. Perdrix: PSE, Université Paris 1 Panthéon-Sorbonne. We thank Paul Bingley, Hélène Blake, Eric Bonsang, Pascale Breuil, Eve Car-oli, Andrew Clark, Eirlys Da Costa Seixas, Brigitte Dormont, Carl Emmerson, Agnès Gramain, Anna Hammerschmid, Hélène Huber, Julien Mousquès, Muriel Roger, François-Charles Wolff, and all semi-nar participants from the Longlives project. We thank the Drees and the Cnav for the data. A. Bozio and E. Perdrix gratefully acknowledge financial support from the ANR-15-MYBL-0001-01 under the JP-demographics call for the project LONGLIVES and the EUR grant ANR-17-EURE-0001. C. Garrouste gratefully acknowledges financial support from the Health Chair – a joint initiative by PSL, Université Paris Dauphine, ENSAE, MGEN and ISTYA under the aegis of the Fondation du Risque (FDR).
Introduction
In a context of demographic ageing, most developed countries introduced reforms to maintain the financial sustainability of pension systems. Most of these reforms aim at increasing incentives to delay retirement. These policies are largely considered to be successful in so far as the percentage of older workers has increased in virtually every country where such reforms where implemented (Coile et al., 2019). However, the impacts of an extended working life on health, have been more difficult to establish.
In fact, no such consensus in the literature exists concerning the causal impact of later retirement on health outcomes. Five aspects of health have attracted most of the researchers’ attention: self-reported health;1 physical health;2 depression;3 cognitive func-tioning4 and health related behaviour.5 The most consistent relationships established in the literature is that self-reported health is improved by retirement while cognitive func-tioning decreases with retirement. More detailed literature reviews are provided in van der Heide et al. (2013) and Nishimura et al. (2017).
There are few studies on the impact of later retirement on mortality. The expected results are not necessarily obvious. One may consider that work preserves health, in maintaining physical activities and social interactions. In this case, we could expect a
1Coe and Lindeboom (2008); Coe and Zamarro (2011); Eibich (2015); Gorry et al. (2018) show that
retirement has a positive effect on self-reported health. Blake and Garrouste (2019) find a negative effect on perceived and physical health, concentrated on the less-educated, while Messe and Wolff (2019) find non-significant impact of early retirement on health.
2These studies used activity daily living (ADL), instrumental activity daily living (IADL), and mobility
index (walking ability, strength, climbing stairs). Bound and Waidmann (2007) find a positive, albeit temporary, effect on male (but not female) physical health. Neuman (2008) find no significant effect on muscle function and mobility.
3Bradford (1979); Carp (1967); Sheppard (1985) show retirement may be stressful and associated with
a feeling of ageing and loneliness. Delaying retirement is associated with stress and strains (Ekerdt et al., 1983; Atalay and Barrett, 2014). Coe and Lindeboom (2008); Neuman (2008); Behncke (2012); Fonseca et al. (2014); Coe and Zamarro (2011) find a non significant effect of early retirement on depression while Calvo et al. (2013); Charles (2004); Belloni et al. (2016) find a decrease in depression. Picchio and van Ours (2019) show heterogeneous effects by gender and marital status.
4Most of the studies on cognitive abilities show that retirement has either a negative or a non significant
impact on cognitive functioning – memory test and verbal fluency (Bingley and Martinello, 2013; Bonsang et al., 2012; Coe and Zamarro, 2011; Rohwedder and Willis, 2010; Celidoni et al., 2017; Kajitani et al., 2017). Moreover, Mazzonna and Peracchi (2017) find heterogeneous effects on cognitive abilities across occupational groups.
5Godard (2016) shows retirement is associated with an increase of obesity risk. Celidoni and Rebba
(2017) show an increase in the probability of having physical activities, no significant impact on smok-ing and a positive impact on male alcohol consumption. Ayyagari (2016) find an increase of tobacco consumption at retirement among the ever smokers.
positive impact of later retirement on health and thus a decreased mortality. Conversely, one may consider that work is detrimental to health due to the strain and the stress. In this case, we could expect an increase in the mortality rate consecutive to an increase in retirement age. Delaying retirement may also affect mortality through inter-temporal income effects on the health status. Since income has an impact on health investment (Grossman’s theory) it may change health. Moreover, there is evidence linking income and mortality.6
Mortality is an interesting health outcome for several reasons. First, mortality is an objective health measure, available in most datasets, particularly in both panel data and administrative data. Second, mortality also encompasses various health issues individuals have experienced during their life. Third, mortality is easier to interpret – as opposed to self-reported health which could simply capture well-being. Fourth, measuring mortality is identical in all countries, thus international comparisons are easy to draw up. Self-reported health varies across countries, owing to respondents’ cultural differences when ranking their own health.
Only a limited number of studies estimates the causal impact of retirement on mortal-ity, leading to contrasting results. One part of the literature finds no significant impact. Thus, Coe and Lindeboom (2008) and Hernaes et al. (2013) find no significant impact of early retirement on mortality respectively in the U.S. and in Norway. Similarly, Hagen (2018) finds no significant impact of an increase in retirement age due to the Swedish pension system reform on women’s mortality. However, two studies find a reduction in mortality following early retirement. Hallberg et al. (2015) and Bloemen et al. (2017) find that a decrease in early retirement age is associated with a decline in mortality, among the Swedish military officers and the Dutch male civil servants respectively. Conversely, three studies find that retirement could increase the mortality rate. Kuhn et al. (2019) find that early retirement leads to an increase of the probability to die before age 67 by 2.4 percentage points among blue-collar male workers in Austria. Zulkarnain and Rutledge
6However, the direction of the relationship is not established in the literature. Roger et al. (2005)
show that doubling income leads to a decrease of mortality by 10%. On the opposite, Snyder and Evans (2006) focus on the causal effect of income on mortality, using difference-in-differences analysis and regression discontinuity design, taking advantage of a pension reform that slightly decreases benefits for those born after January 1917. They find that the higher-income group has a statistically significantly higher mortality rate.
(2018) find that delaying retirement reduces the probability to die within five years for men aged 62-65 in the Netherlands. Fitzpatrick and Moore (2018) find a two percent increase of the death counts for American men at the ERA – i.e., at age 62 –, but no effect for women.
Our paper contributes to the above literature by exploiting the 1993 French pension reform which was the first to reverse the trend of earlier retirement in France. The reform progressively increased the contribution length to get a full pension according to the birth year. Individuals born in the same year were differently impacted by the reform, according to the contribution quarters at the ERA, i.e., age 60 at the time. We use the change in retirement incentives as an instrumental variable using a two-stage-least-square (2SLS) estimator to measure the impact on mortality. We use 2017 administrative data from Caisse Nationale d’Assurance Vieillesse (CNAV) encompassing private sector wage earners in France born between 1930 and 1950. The dataset includes more than 10 million observations, i.e. 450,000 to 650,000 retirees per cohort.
The first stage of the 2SLS regression shows a strong and significant effect of the 1993 reform on retirement claiming age, both for the strongly affected youngest cohorts and for the only partially affected oldest cohorts. The second stage of the 2SLS shows that an exogenous increase in claiming age by one quarter has no significant impact on the probability to die between ages 61 and 79. This non-significant result remains true for men and women separately. Our result does not preclude a potential impact on mortality at an earlier age (e.g., between age 60 and 61) or at an older age (after age 79).
As opposed to a large share of the literature, our results are precisely estimated, i.e., we find a very precise effect around 0. In the paper, we discuss the necessary sample size to estimate significant effects of such a tiny size, and we review the previous literature in that light. We also discuss the interpretation of different studies pertaining on specific subsets of the population. Recent work (incl. Romer (2020)), points out the relevance of an analysis on confidence intervals rather than point estimates significance only. Follow-ing that methodological line, we suggest usFollow-ing minimal detectable effect procedure more systematically to identify the ability to estimate small effects with rare events data.
This paper is structured as follows: Section 1 presents the institutional framework and the 1993 French pension reform while Section 2 presents the data, the sample and the
method, Section 3 presents the results and Section 4 a discussion of the results.
1
Institutional Framework
The French pension system is a mandatory pay-as-you-go pension scheme. There are several pension schemes, and individuals contribute to the one of their professional occu-pation group (private sector, public sector, etc.). The 1993 French pension reform only affected wage earners in the private sector. Hence, in this section, we focus on pension rules in the private sector before and after the 1993 reform.
1.1
Private Sector Pensions before the 1993 Reform
In the private sector, pension benefits depend on (i) the pension rate; (ii) the reference wage (equal to the average of the best ten earning years of an individual); (iii) the career proportion time span an individual worked within the private sector scheme.
Early retirement age (ERA) is set at age 60, and a full-rate pension can be claimed either at age 65, or at an earlier age provided that the wage-earner has contributed at least the required contribution length—set at 37.5 years before the reform (or 150 quarters).7 Individuals benefit from a contributed quarter for each period employed, sick-leave, or short-term unemployment. At the time, there was no actuarial adjustment of pension benefits after reaching the full replacement rate. The full replacement rate was 50%, and a penalty of 10%—higher than actuarial fairness—was applied to each year of early retirement or missing contribution quarter before conditions for a full-rate pension were reached. Hence, the financial incentives, as well as the reference norms, coincided largely with claiming a pension at the full-rate age.
1.2
The 1993 Pension Reform
In 1993, the Balladur government reformed the pension system for private sector employ-ees (see Section A in the Appendix 1 for more details on the 1993 reform). This reform changed three parameters. First, it changed the indexation rules for pension, from wage
7For individuals with severe disability and functional limitations, a disability pension can be claimed
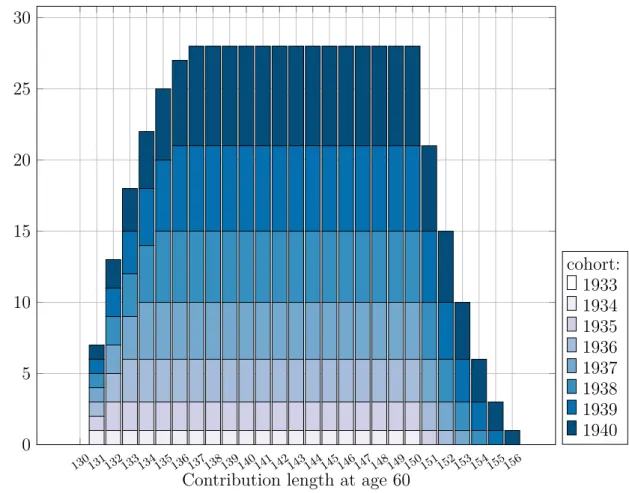
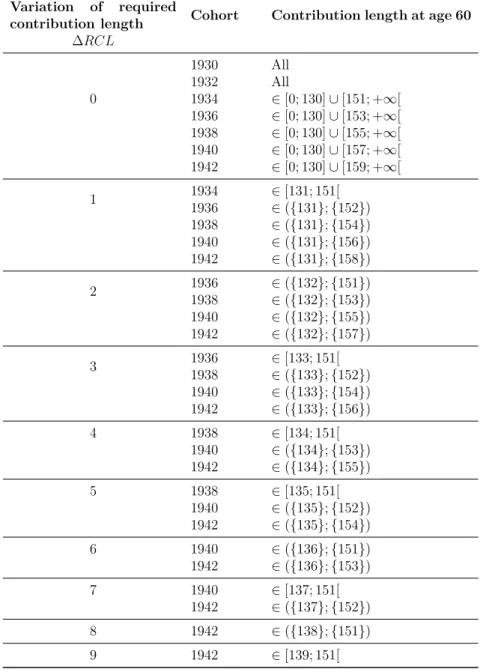
growth to inflation. This affected all the cohorts by reducing pension benefits at retire-ment claiming age, as well as less dynamic pension indexation afterwards. Second, the number of years considered for computing the reference wage increased from the best 10 years to the best 25 years. This change was phased-in progressively, affecting younger cohorts more intensively. Finally, the reform changed the required contribution length for a full-rate pension. It was gradually increased, cohort by cohort, from 37.5 years to 40 years, alternatively from 150 to 160 quarters, starting with the 1934 cohort. Individuals born in 1934 had to contribute 151 quarters for a full pension, cohort 1935 had to con-tribute 152 quarters, and so on (see Appendix A for details). All individuals in the same cohort were not affected in the same way, as shown in Figure 1. Using the change in the required contribution length, we use the variation between and within cohorts to identify the causal effect of later retirement on mortality. Thus, Figure 1 illustrates the progres-sive increase in incentives to delay retirement across cohorts, and how this phasing-in of the 1993 reform impacted wage earners differently, with different career lengths at age 60. Within each cohort, the wage earners who were impacted, were those with a specific contribution length, i.e. between 131 and 160 quarters of contribution at age 60. The younger the cohorts, the more impacted they were.
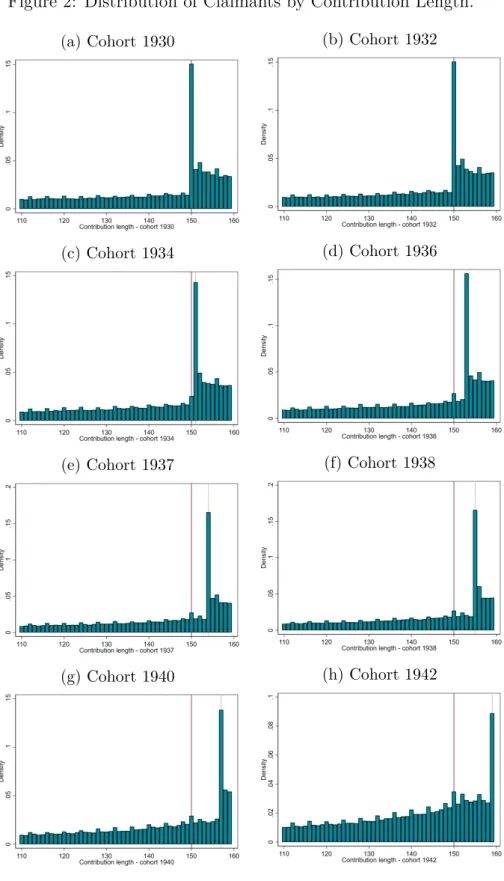
Figure 2 shows that individuals in cohorts unaffected by the reform bunched at 150 quarters, i.e. the requisite for the full rate. From cohort 1934 (the first cohort affected by the reform), bunching at the full rate moves progressively to the right for each cohort affected. It highlights significant behavioural responses to the 1993 reform.
Workers in the same cohort are differently affected by the change in required contri-bution length but are nevertheless affected similarly by the two other parts of the reform. Individuals with very long careers, having exceeded the required contribution length at age 60, were unaffected by the reform, i.e. they would qualify for the full pension rate at age 60 regardless of the reform. Conversely, individuals with short careers, i.e., less than 130 quarters of contribution at age 60, were unaffected by the change in required contribution length as the full-rate pension was acquired at age 65 anyway. Individuals eligible for a disability pension due to their health condition were unaffected by the reform and could still claim a disability pension at age 60.
Figure 1: Impact of the 1993 Reform on Contribution Years Necessary to Get a Full-Rate Pension 130131132133134135136137138139140141142143144145146147148149150151152153154155156 0 5 10 15 20 25 30
Contribution length at age 60
Num b er of added quarters follo wing the reform cohort: 1933 1934 1935 1936 1937 1938 1939 1940
Notes: This figure presents the impact of the 1993 reform on the number of quarters of contribution required to
reach the full-rate by cohort and contribution length at the ERA, i.e., at age 60. Whatever the contribution length at age 60, a wage-earner born in 1933 is not impacted by the reform (zero added quarter required). Cohort born in 1934 who had contributed at age 60 between 130 and 150 quarters need to delay retirement by one quarter in order to qualify for the full-rate. Cohort born in 1935 who had contributed at age 60 between 131 and 150 quarters need to delay retirement by two quarters to reach the full replacement rate. Those from the same cohort who had contributed 151 quarters at age 60 had to delay retirement by one quarter.
Figure 2: Distribution of Claimants by Contribution Length.
(a) Cohort 1930 (b) Cohort 1932
(c) Cohort 1934 (d) Cohort 1936
(e) Cohort 1937 (f) Cohort 1938
(g) Cohort 1940 (h) Cohort 1942
Notes: This is the density by contribution length at retirement by cohort, for individuals
who have contributed between 110 and 160 quarters. The red line shows the 150 quarters contribution (the required contribution before the reform). For cohorts 1930 and 1932 (co-horts not affected by the reform), there is bunching at 150 quarters, which corresponds to the required contribution length to retire with a full replacement rate. For cohorts 1934 and older (affected by the reform), bunching moves to the right, showing individuals seem to respond to the reform’s changed incentives.
2
Data and Empirical Strategy
2.1
Data
In this study we use exhaustive administrative data from the main pension scheme of the private sector, the Caisse Nationale d’Assurance Vieillesse (CNAV).8 The above data includes all the retirees born between 1930 and 1950 who have contributed at least one quarter to the Cnav pension scheme during their careers. We observe all retirees still living, as well as those who died between 2004 and 2017. The sample gathers 500,000 observations per cohort on average. This data contains all the information required for pension benefit computation (reference wages, number of contributed quarters) excluding any socio-economic information, excepting date of birth and gender.
Sample Selection. The 1993 reform affects all individuals from cohort 1934 onwards. We selected individuals born between 1933 and 1943. One cohort (born in 1933) is unaffected by the reform, while cohorts 1934 to 1943 are progressively more impacted by the changes of incentives. Cohort 1943 is the first cohort to be fully impacted by the 1993 reform, and the last cohort not affected by the following French pension reform.9 Thus, our sample is made up of individuals (i) born between 1933 and 1943; (ii) who contributed between 80 and 180 quarters at age 60.10
Given that we observe mortality outcomes between 2004 and 2017 we do not observe mortality outcomes for the same ages for all the cohorts affected. As a result, we split our sample into three panels including individuals alive at the same age. In the first panel (Panel A), we observe the probability to die between ages 72 and 79 for individuals born between 1933 and 1938. In the second panel (Panel B), we observe the probability to die between ages 65 and 72 for those born between 1938 and 1943.11 Lastly, we observe the impact of later retirement on the probability to die between ages 61 and 65 for a sub-sample of individuals born between 1942 and 1943 (Panel C).
8The Cnav is the main pension scheme. It covers all the private sector wage earners. In France, 85%
of the labor force contributed at least once to this pension scheme (source: EIR 2004). 90% of those affected by the 1993 reform had mainly contributed to the Cnav pension scheme.
9The 2004 reform affects cohorts born in 1944 and later.
10As a robustness check, we test variants to this restriction (see Figure 6).
11The choice of age 65 rather than claiming age enables to avoid a selection bias on mortality between
This enables us to have a wide overview of the impact of later retirement on mortality once the entire cohort has retired and was still living at age 61 for Panel C, at age 65 for Panel B and at age 72 for Panel A. Seeing as the above effects on mortality could arise a long time after retirement, observing the health consequences of later retirement a long time after retirement is of interest. Panel C shows the impact just after retirement, at age 61 to age 65, for cohorts born in 1942 and 1943 who are incited to leave the labour force between age 60 and 61. Panel B shows the effect between age 65 and 72 for individuals born between 1938 and 1942, alive at age 65. Panel A shows the effect between age 72 and 79, on the condition of still living at age 72. Due to data constraints, we have no information on the potential effect on mortality between ages 60 and 61, nor after age 79. The limits associated with these data constraints are mentioned in Section 4.
Note that Panel A versus Panels B and C include different cohorts, which are not fully comparable. In particular, we presume that cohorts born during World War II (Panels B and C) could have specific pertaining health conditions.12 As we use variations within cohorts to identify the impact of the pension reform, the above differences should not question the internal validity of the estimation.
Variables of interest. The data used allows for the computation of the number of contributed quarters during an individual’s working life, and the number of contributed quarters at age 60. Moreover, we have information on the exact retirement claiming age, which we define as the age at which an individual claims their pension for the first time. This claiming age can differ from the retirement age, i.e., the age at which an individual leaves the labour market to retire. We have no precise information of when individuals leave the labour market. Bozio (2011) used another source of data, with a smaller sample, including information on past employment history, to assess the impact of the 1993 reform on employment. He finds that individuals included in our survey postpone both their claiming age and retirement age following the 1993 pension reform.
We use a few individual characteristics. We know if individuals benefit from a disability pension, and we have information on the reference wage, i.e., the average of the best earning years.
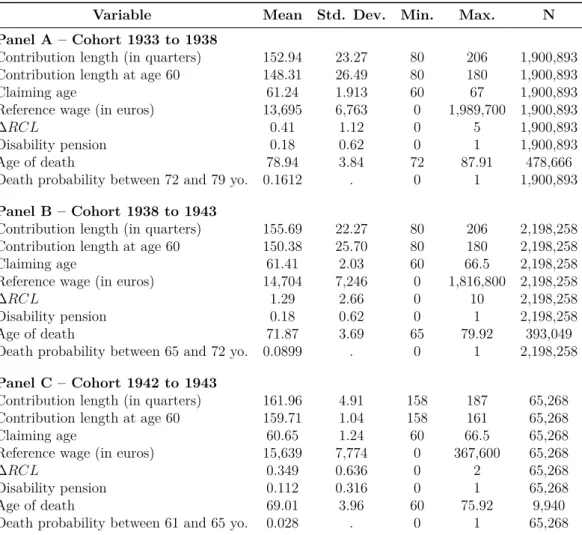
Descriptive Statistics. Table 1 presents descriptive statistics of our main variable of interest for our two samples. The average number of quarters contributed is 153 quarters in Panel A, compared to 156 quarters in Panel B. The difference between the two samples was expected since individuals in Panel B are more intensively affected by the reform, and thus, must contribute more quarters to obtain a full-rate pension. As expected, additional years of contribution required by the reform to obtain a full-rate is lower in Panel A than in Panel B (0.41 versus 1.29). Apart from the fact that the two samples are affected differently by the reform, they do remain very close to national averages. For instance, the mean claiming age in our data is 61.2 for Panel A (resp. 61.4 for Panel B), which is very close to the national mean claiming age for those who benefit from a pension (61.9 in 2004 according to Benallah and Mette (2009)). Reference wages are also similar in our sample and national statistics. The death probability and the average age of death are higher in Panel A since we observe individuals at older ages. In Panel B, individuals are observed between ages 65 to 72; and in Panel A, between ages 72 and 79. The death probability and the average age at death are different in the above two panels. However, there are different populations observed at different age ranges.
Descriptive statistics of Panel C differ from those of Panel A and B. Panel C is a subsample of Panel B: it includes only individuals born in 1942 and 1943, who contributed between 157 and 162 quarters at age 60.
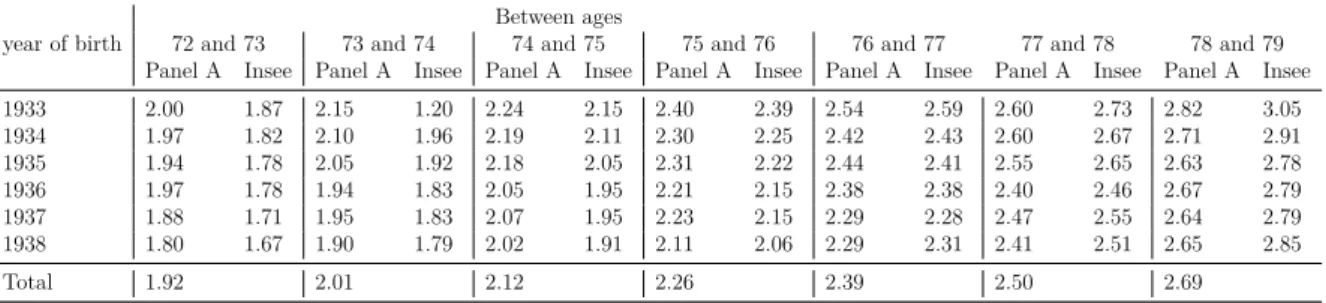
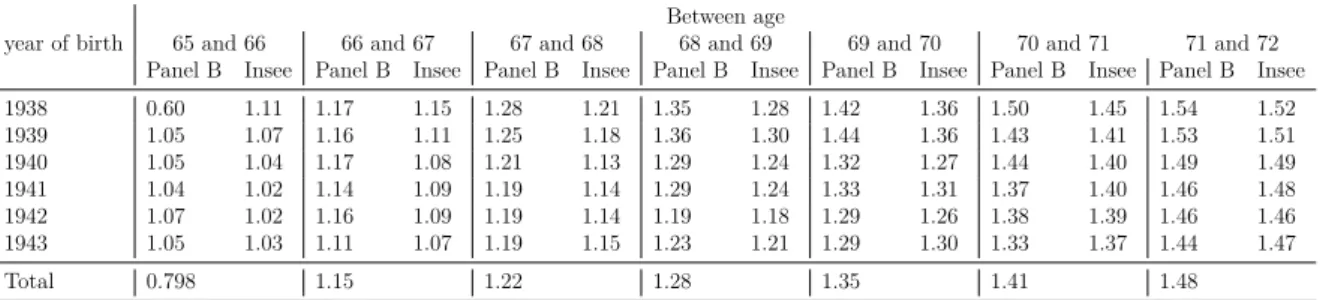
We have also compared our sample characteristics to those of the INSEE (the French Institute of National Statistics), whose detailed results are presented in Appendix B. Numerous differences can be noted, as they reflect the selection of our sample on private sector workers. First, the share of women is slightly lower than those of men (Table B2). Second, the death probability between ages 65 and 79 is close to national statistics for each cohort, with almost systematically slightly higher death rates in our sample compared to national averages for certain ages (see Tables B4 and B3). However, in Panel C, the mortality rates between ages 61 and 65 are slightly lower compared to national averages (Table B5).
Table 1: Descriptive Statistics of the Variable of Interest
Variable Mean Std. Dev. Min. Max. N
Panel A – Cohort 1933 to 1938
Contribution length (in quarters) 152.94 23.27 80 206 1,900,893 Contribution length at age 60 148.31 26.49 80 180 1,900,893
Claiming age 61.24 1.913 60 67 1,900,893
Reference wage (in euros) 13,695 6,763 0 1,989,700 1,900,893
∆RCL 0.41 1.12 0 5 1,900,893
Disability pension 0.18 0.62 0 1 1,900,893
Age of death 78.94 3.84 72 87.91 478,666
Death probability between 72 and 79 yo. 0.1612 . 0 1 1,900,893
Panel B – Cohort 1938 to 1943
Contribution length (in quarters) 155.69 22.27 80 206 2,198,258 Contribution length at age 60 150.38 25.70 80 180 2,198,258
Claiming age 61.41 2.03 60 66.5 2,198,258
Reference wage (in euros) 14,704 7,246 0 1,816,800 2,198,258
∆RCL 1.29 2.66 0 10 2,198,258
Disability pension 0.18 0.62 0 1 2,198,258
Age of death 71.87 3.69 65 79.92 393,049
Death probability between 65 and 72 yo. 0.0899 . 0 1 2,198,258
Panel C – Cohort 1942 to 1943
Contribution length (in quarters) 161.96 4.91 158 187 65,268 Contribution length at age 60 159.71 1.04 158 161 65,268
Claiming age 60.65 1.24 60 66.5 65,268
Reference wage (in euros) 15,639 7,774 0 367,600 65,268
∆RCL 0.349 0.636 0 2 65,268
Disability pension 0.112 0.316 0 1 65,268
Age of death 69.01 3.96 60 75.92 9,940
Death probability between 61 and 65 yo. 0.028 . 0 1 65,268
Notes: This table shows descriptive statistics of our samples. Individuals selected in Panel A and B are those
who contributed at age 60 between 80 and 180 quarters, at least once in the private sector, and retire between ages 59 and 67. Moreover, Panel A selects individuals born between 1933 and 1938, alive at age 72 while Panel B selects individuals born between 1938 and 1943, alive at age 65. Panel C includes individuals who contributed between 157 and 162 quarters, born between 1942 and 1943, alive at age 61.
Source: Cnav data 2003-2017.
2.2
Empirical Strategy
Reverse causality is the main challenge to measure the impact of later retirement on health.13 People in poorer health may be inclined to leave employment at an earlier age, whereas healthier people tend to stay on the labour market, which would create a positive correlation between retirement age and health status. Health has strong effects on work choices. Previous studies show that health issues not only influence retirement plans, but also in general the labour force behaviour of older workers (Bound et al., 1999; Dwyer
13Health and retirement are endogenously related (Kerkhofs et al., 1999; Llena-Nozal Ana et al., 2004;
and Mitchell, 1999; Au et al., 2005; McGarry, 2004; Disney et al., 2006).
To address this endogeneity issue, we exploit the exogenous variation in retirement age created by the 1993 reform, as an instrument to assess the causal impact on mortality. The 1993 reform affected individuals of the same cohort differently, depending on the exact number of contributed quarters at the ERA. For example, the reform implemented an incentive to retire one quarter later for individuals born in 1934 who had contributed 150 quarters at age 60. Individuals of the same cohort having contributed 151 quarters were not affected by the reform. To be a valid instrument, we need to assume that the number of contributed quarters at age 60 is independent from the reform. This assumption is very likely for the first cohorts affected by the reform since they could not have anticipated this reform. For the last cohort affected, the assumption is stronger as individuals could have responded by extending their working life before the ERA. However, this option would only concern a limited number of individuals.14 Within cohorts 1933 and 1934, we could estimate the impact of the reform in a difference-in-differences setting, following equation (1):
Ai = δ0+ δ11(yobi = 1934) × 1(CL60i = 150) + δ21(yobi = 1934) + δ31(CL60i = 150) + εi
(1) with Ai (claiming age, in quarter of years), 1(yobi = 1934) a dummy equal to one if
individual i is born in 1934, 1(CL60i = 150) a dummy variable equal to one if contribution
length of individual i equal to 150 at age 60, εi the error term. The interaction term
1(yobi = 1934) × 1(CL60i = 150) captures the causal impact of the reform on retirement
age within cohort.
With the progressive phasing-in of the reform we can exploit all the different impacts of the reform on different cohorts, in the spirit of a generalised difference-in-differences model (with cohorts and quarters of contributions dummies). We go one step further by exploiting the intensity of the reform, by computing the number of contributed quarters needed to reach the full-rate, i.e. ∆RCL.
We use the 2SLS (Two Stage Least Square) estimation. The first-stage is an OLS (Ordinary Least Square) regression. This represents the impact of the number of added
14Only individuals who were not working before the ERA could have responded with increasing labour
quarters due to the reform on the claiming age, and can be written as follows: Ai = α0+ α1∆RCLi+ X g α2,g1(yobi = g) + X t α3,t1(CL60i = t) + α4Xi+ ζi (2)
with Ai, the claiming age; ∆RCLi, the number of additional quarters required to obtain a
full pension following the reform15; 1(yob
i = g), dummies for cohort; 1(CL60i = t),
dum-mies for the contribution length at age 60; Xi, the pensioners’ individual characteristics
(gender, annual reference wage and a dummy for being disability pension recipient); ζi,
the error term.
The second-stage equation is the causal impact of later retirement due to the reform on mortality between ages 72 and 79 (Panel A), between ages 65 and age 72 (Panel B), and between ages 61 and 65 (Panel C), estimated using OLS and adjusting standard errors taking into account that the ˆAi is a generated regressor (see Wooldridge (2010) p. 97 for
detailed explanation). It can thus be written as follows:
qi = β0+ β1Aˆi+ X g β2,g1(yobi = g) + X t β3,t1(CL60i = t) + β4Xi+ τi (3)
with qi equal to zero if individual i is alive at age 79 (72 or 65), and equal to one if
individual i died between ages 72 and 79 (between ages 65 and 72 or between ages 61 and 65), ˆAi, the variation in claiming age due to the reform, and τi, the error term.
Technically, identification is obtained if α1 6= 0 and if ∆RCL affects mortality exclusively through Ai, i.e. the exclusion restriction. This is confirmed by the first stage estimates
in Section 3.
3
Results
We first present reduced-form results with graphical evidence, before detailing the 2SLS results for each panel.
3.1
Impact of the Reform on Claiming Age and Mortality
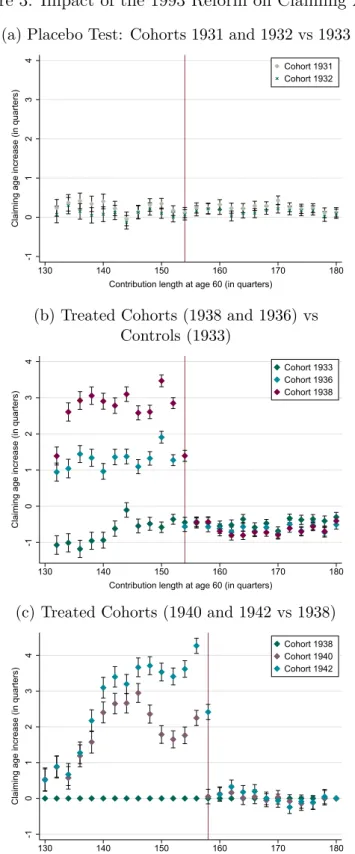
Impact of the Reform on Retirement. Figure 3 presents the impact of the 1993 reform on claiming age for different cohorts and according to the contribution length at age 60. Figure 3b compares two affected cohorts (1936 and 1938) with an unaffected cohort (1933). Cohort 1936 had to postpone retirement by three quarters to get the full rate if contribution length was below 151 quarters, while cohort 1938 had to postpone retirement by five quarters if contribution length was below 155 quarters. We observe strong effects of the reform on claiming age for those individuals affected. The increasing intensity of the reform is also obvious with a stronger impact for the younger cohorts. For contribution length above 155 quarters at age 60 there are no cohorts affected and we do not detect any differences in claiming behaviour. Figure 3c presents similar effects for younger cohorts (1940 and 1942) compared with cohort 1938. Figure 3a presents the results for the three unaffected cohorts (1931 and 1932 versus 1933). No difference in claiming age is detected.
Figure 4 presents the graphical results of the first stage estimate for our baseline specification, allowing for heterogeneous impact of the intensity of the reform.
The impact is strong, and proportional to the treatment intensity. The coefficients values are deferred to Table C1 in Appendix. Thus, the hypothesis we made concerning the linear effect in the first stage of our 2SLS is confirmed here.
The above graphical results are confirmed by the first stage regression (see Table 2, column (3)). It shows a large impact of the increase in the required contribution length on claiming age. An increase in the contribution length by one quarter implies a 0.672 (resp. 0.696 and 1.237) additional quarters in claiming age for men of Panel A (resp. Panel B and C), and 0.425 (resp. 0.588 and 1.092) for women, all significant at 1%. This result confirms that the 1993 reform can be used as an instrumental variable to estimate the causal impact of claiming age on mortality.
Individuals postpone almost the entire additional required contribution to obtain a full pension, meaning that they respond to the incentives to work longer. An increase of the required contribution length by one quarter (three months) induces a deferral of 1.95 months (resp. 1.68 for Panel B and 3.54 for Panel C) in the claiming age. The effect is
Figure 3: Impact of the 1993 Reform on Claiming Age
(a) Placebo Test: Cohorts 1931 and 1932 vs 1933
-1 0 1 2 3 4
Claiming age increase (in quarters)
130 140 150 160 170 180
Contribution length at age 60 (in quarters)
Cohort 1931 Cohort 1932
(b) Treated Cohorts (1938 and 1936) vs Controls (1933) -1 0 1 2 3 4
Claiming age increase (in quarters)
130 140 150 160 170 180
Contribution length at age 60 (in quarters)
Cohort 1933 Cohort 1936 Cohort 1938
(c) Treated Cohorts (1940 and 1942 vs 1938)
-1 0 1 2 3 4
Claiming age increase (in quarters)
130 140 150 160 170 180
Contribution length at age 60 (in quarters)
Cohort 1938 Cohort 1940 Cohort 1942
Note: Average impact of the contribution length at age 60 on the claiming age for 1940 and 1942 cohorts, taking
1938 cohort as reference, for treated cohorts (1938 and 1936), taking 1933 cohort as reference and for untreated cohorts (1931 and 1932), taking cohort 1933 (untreated) as reference. Confidence Intervals at 95%.
Sample: Individuals from Panel A and B. Source: Cnav data 2003-2017.
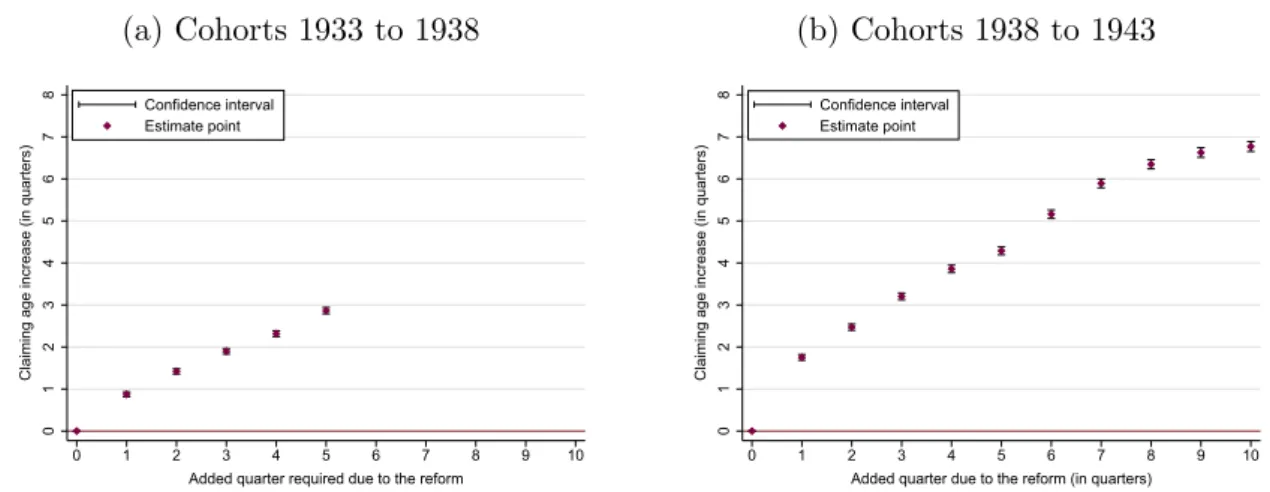
Figure 4: Impact of the Reform on Claiming Age (a) Cohorts 1933 to 1938 0 1 2 3 4 5 6 7 8
Claiming age increase (in quarters)
0 1 2 3 4 5 6 7 8 9 10
Added quarter required due to the reform Confidence interval Estimate point (b) Cohorts 1938 to 1943 0 1 2 3 4 5 6 7 8
Claiming age increase (in quarters)
0 1 2 3 4 5 6 7 8 9 10
Added quarter due to the reform (in quarters) Confidence interval
Estimate point
Note: Average impact of the number of added quarter an individual experience due to the reform on the claiming
for cohorts 1933 to 1938, and for cohorts 1938 to 1943. Confidence Intervals at 95%. The point estimate are those of the equation: Ai= α0+P10r=0α1,r1(∆RCLi,r) +Pgα2,g1(yobi= g) +Ptα3,t1(CL60i= t) + α4Xi+ ζiThis
equation is the same as Equation (3) but allowing for non linear effect of the number of added quarter due to the reform ∆RCL.
Sample: Individuals from Panel A and B. Source: Cnav data 2003-2017.
slightly lower for women.16
Our results are similar to those of Bozio (2011) who estimated the impact of the 1993 reform on claiming age and on probability to stay at work. His estimates concerned a smaller sample of only the first affected cohorts. He also found a very similar effect of the reform on claiming age or labour force participation for men, together with a slightly smaller effect on labour force participation for women.
16There may be an income effect. Individuals who did not respond to the incentives, undergo a pension
cut. Thus, the reform may affect mortality by reducing income. Furthermore, the first stage shows that individuals react massively to the reform by increasing the claiming age, meaning that the effect of postponing retirement prevails on the income effect.
Table 2: Main Estimates of the Impact of Delaying Retirement on Mortality.
(1) (2) (3) (4)
OLS Reduced Form 1st stage 2SLS Obs.
Dependant var. qi qi Ai qi
Explanatory var. Ai ∆RCL ∆RCL Aˆi
Panel A: Cohorts 1933 to 1938, observed between ages 72 and 79
All -0.00064*** 0.00026 0.56020*** 0.00047 1,900,893 (0.00005) (0.00041) (0.00684) (0.00074) 0.00000 0.52294 0.00000 0.52298 Male -0.00125*** -0.00025 0.67153*** -0.00037 1,081,343 (0.00008) (0.00063) (0.00941) (0.00094) 0.00000 0.69650 0.00000 0.69646 Female -0.00056*** 0.00059 0.42517*** 0.00140 819,550 (0.00005) (0.00052) (0.01013) (0.00122) 0.00000 0.25359 0.00000 0.25379
Panel B: Cohorts 1938 to 1943, observed between ages 65 and 72
All -0.00049*** -0.00023 0.64607*** -0.00035 2,198,258 (0.00003) (0.00028) (0.00603) (0.00044) 0.00000 0.42299 0.00000 0.42293 Male -0.00099∗∗∗ 0.00004 0.69616∗∗∗ 0.00006 1,283,687 (0.00005) (0.00042) (0.00788) (0.00060) 0.00000 0.91704 0.00000 0.91703 Female -0.00042∗∗∗ -0.00043 0.58855∗∗∗ -0.00073 914,571 (0.00004) (0.00035) (0.00941) (0.00060) 0.00000 0.22495 0.00000 0.22486
Panel C: Cohorts 1942 to 1943, observed between ages 61 and 65
All -0.00122*** -0.00126 1.18065*** -0.00107 65,268 (0.00007) (0.00266) (0.08152) (0.00225) 0.00000 0.63664 0.00000 0.63636 Male -0.00156*** -0.00185 1.23750*** -0.00149 40,993 (0.00010) (0.00378) (0.10438) (0.00305) 0.00000 0.62554 0.00000 0.62515 Female -0.00059*** -0.00001 1.09254*** -0.00001 24,275 (0.00010) (0.00323) (0.13049) (0.00296) 0.00000 0.99738 0.00000 0.99738
Standard errors in parentheses. P-values in italics.
∗p < 0.10,∗∗p < 0.05,∗∗∗p < 0.01
Note: Ai is the claiming age in quarter of individual i; qia dummy equal 1 if died; ∆RCL the
number of added quarter required due to the reform; ˆAi the claiming age variation due to the
reform, in quarter. Column (1) is the association between claiming age and mortality; column (2) the impact of the reform on mortality; column (3) the impact of the reform on claiming age; column (4) the impact of later retirement on mortality. All regressions include controls for year of birth, dummies for contribution length at age 60, gender, reference wage and disability pension. Details of control variables coefficients in Tables F1 to F9.
Samples: Individuals retired between ages 59 and 67, who contributed at least once in the private
sector. Panel A (resp. B) includes those who contributed at age 60 between 80 and 180 quarters; born between 1933 and 1938 (resp. 1938 and 1943); alive at age 72 (resp. 65). Panel C includes those who contributed between 157 and 162 quarters; born between 1942 and 1943, alive at age 61. The F-statistics of the first stage (for the excluded instrument) is systematically high enough to not worry about weak instrument issue. Thus, it is 6,704.33 (resp. 11,476.84 and 209.73) for the whole Panel A (resp. B and C). The Hausman test robust to heteroskedasticity shows in all Panels that there is an endogeneity issue that justify to prefer 2SLS rather than OLS.
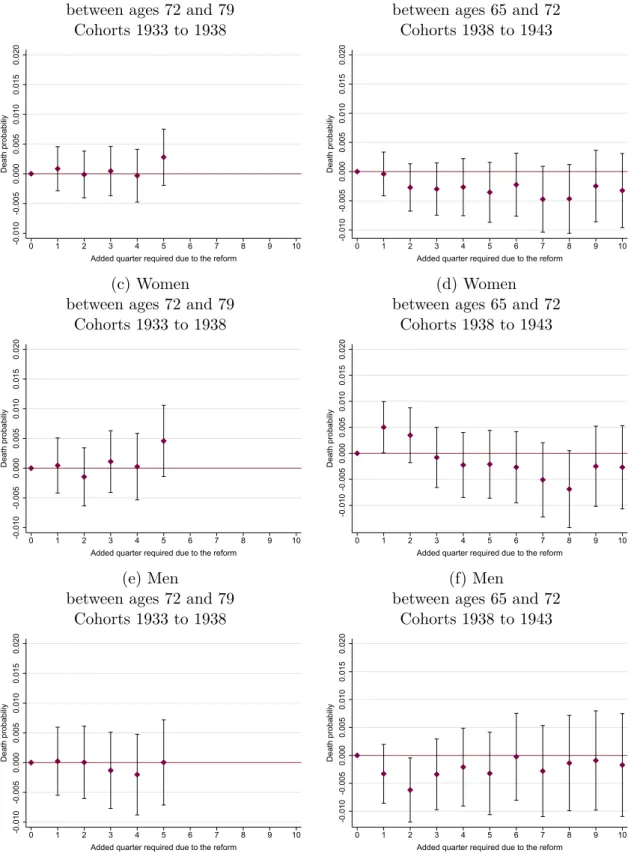
Impact of the Reform on Mortality. Figure 5 shows similar graphical evidence with mortality outcome instead of claiming age. This is akin to the reduced-form estimation on mortality. The effects are never significant, whatever the cohort, the gender, or the treatment intensity.
Table 2 presents the main results of the analysis for the three samples (Panels A, B and C). Column (1) shows the coefficient of an OLS regression of claiming age on mor-tality. The correlation is negative and significant for the all samples: −0.000125 for men born between 1933 and 1938 (resp. −0.00099 for those born between 1938 and 1943, and −0.00156 for those of Panel C born between 1942 and 1943) and −0.00056 (resp. −0.00042 and −0.00059) for women. Thus, a higher claiming age of retirement is associated with a lower probability to die. The correlation could be explained by a selection bias, i.e. workers in good health are likely to be those who retire later (“healthy worker effect”).
Column (2) shows the coefficients of the impact of the pension reform on mortality (the reduced form estimation of equation (3)). The correlation is non-significant in all panels. Column (3) presents the first stage impact (i.e., the impact of the reform on claiming age) which shows strong and significant effects, while column (4) presents the 2SLS estimates.
The results from the IV estimation show that an exogenous increase in claiming age has no significant impact on the probability to die between ages 72 and 79 (Panel A) on the condition of being still living at age 72, or on the probability to die between ages 65 and 72 (Panel B) on the condition of being still living at age 65. This non-significant effect is very close to zero. This result is also not significant for men and women separately. Our data contains little information on socio-economic characteristics, preventing us from a complete heterogeneity analysis. Nonetheless, we do not find any differentiated impact per life-time earnings quartile, which is a good proxy for many socio-economic factors.17 (see Table C7 in Appendix).
Panel C provides the same results for a sub-sample of individuals born between 1942 and 1943, alive at age 61 and who contributed between 157 and 162 quarters. Since this
17We find a significant impact at the 10% level among the third quartile of men and the second quartile
of women in Panel B, and among the 1st quartile of men in Panel A. There is a significant impact at the 10% level among the women of the 2nd quartile in Panel A. The significant impact are positive in Panel A and negative in Panel B and the magnitude is always very small.
sample is very small compared to Panels A and B, the results are less precisely estimated. The results are non-significant for this panel, both for men and women.
Detecting Small Effects with Rare Events Data. In each sub-sample, we investi-gate whether the non-significant result can be interpreted as an absence of link between retirement age and mortality or a lack of power. To this aim, we compute minimum detectable effects. The minimum detectable analysis gives the lowest detectable effect. Thus, a minimum detectable effect of x means that with a non-significant coefficient lower than x, we cannot conclude the absence of association between the dependant variable and the treatment variable, i.e., we accept the null hypothesis with a risk of making a type II error higher than 20%, the usual threshold of statistical power. We compute MDE estimates for each sample, for a two-side hypothesis test, at a 5% significance level, and a statistical power of 20% (see Appendix E for more details on the MDE analysis).
There is not enough power to detect an effect when the MDE is above the confidence interval of the estimated beta. Panel A includes 1,900,893 observations, with a 15.14% share of treated individuals, a 16.12% death probability. The minimum detectable effect is 0.002072 in Panel A, which is higher than our estimated β (0.00121). This means that an impact higher than 0.002 would have been detected if it had occurred. Panel B includes 2,198,258 observations, with a 23.20% share of treated individuals, a 8.99% death probability. The minimum detectable effect is -0.00049, which is higher in absolute value than our estimated β (-0.00035). This means that if there were an effect lower than -0.00049, it would have been detected. Panel C includes 65,268 observations, with a 26,04% share of treated individuals, a 2.80% death probability. The minimum detectable effect is -0.00252 in Panel C, which is higher in absolute value than our estimated β (-0.00107). This means that if there were an effect lower than -0.00107, it would have been detected. To conclude, if there is an effect on mortality, it is lower than 0.002 and lower in absolute value than -0.00107 (see Table E2 in Appendix).
In each sub-sample, the effect is not detectable, meaning that we cannot conclude between absence of effect and lack of statistical power. However, our MDE estimates suggest that, if there is an effect on mortality, it is very small in magnitude. We later discuss the economic significance of such an impact (see Section 4).
Figure 5: Impact on Mortality by Treatment Intensity
(a) Men and women between ages 72 and 79
Cohorts 1933 to 1938 -0.010 -0.005 0.000 0.005 0.010 0.015 0.020 Death probabiliy 0 1 2 3 4 5 6 7 8 9 10 Added quarter required due to the reform
(b) Men and women between ages 65 and 72
Cohorts 1938 to 1943 -0.010 -0.005 0.000 0.005 0.010 0.015 0.020 Death probabiliy 0 1 2 3 4 5 6 7 8 9 10 Added quarter required due to the reform
(c) Women between ages 72 and 79
Cohorts 1933 to 1938 -0.010 -0.005 0.000 0.005 0.010 0.015 0.020 Death probabiliy 0 1 2 3 4 5 6 7 8 9 10 Added quarter required due to the reform
(d) Women between ages 65 and 72
Cohorts 1938 to 1943 -0.010 -0.005 0.000 0.005 0.010 0.015 0.020 Death probabiliy 0 1 2 3 4 5 6 7 8 9 10 Added quarter required due to the reform
(e) Men
between ages 72 and 79 Cohorts 1933 to 1938 -0.010 -0.005 0.000 0.005 0.010 0.015 0.020 Death probabiliy 0 1 2 3 4 5 6 7 8 9 10 Added quarter required due to the reform
(f) Men
between ages 65 and 72 Cohorts 1938 to 1943 -0.010 -0.005 0.000 0.005 0.010 0.015 0.020 Death probabiliy 0 1 2 3 4 5 6 7 8 9 10 Added quarter required due to the reform
Note: Average impact of the number of added quarter an individual experiences due to the reform on the probability
to die, respectively between ages 72 and 79 for cohorts 1933 to 1938, and between ages 65 and 72 for cohorts 1938 to 1943. Confidence Intervals at 95%.
Sample: Individuals from Panel A and B. Source: Cnav data 2003-2017.
3.2
Heterogeneous Analysis
Treatment Intensity. Our main model assumes linear impact of delayed retirement due to the reform on mortality. One may think that the impact of later retirement on mortality could have no impact up to a treatment intensity threshold, or that the added quarter affects mortality in a non-linear way. Table C2 shows there is no significant impact on mortality in the reduced form when we allow for non-linear effects of treatment intensity on mortality.18 Table C3 shows the 2SLS estimates of later retirement on mortality when assuming a non-linear treatment effect. It shows non-significant impact and in a similar range to our main estimates.
Heterogeneous Effects. We investigate whether the nil effect is the result of groups of individuals with opposing effects. Our only socio-economic variables are reference wage and gender. We use the reference wage as a proxy of average lifetime earnings for individual. The reference wage is the average of the best 25 earnings years. Table C7 shows the impact of delaying retirement due to the reform on mortality by quartile of reference wage in each Panel (2SLS estimates). The coefficients are almost never significant (5 coefficients over 36 are significant at 10% and one coefficient significant at 5%). As we have large samples, the significant level at 1% would be more pertinent. Consequently, the effect is likely to be 0 whatever the quartile.
Mortality Measures. Could the estimated zero effect be the average of heterogeneous impacts at different ages? Thus, we measure the impact of later retirement on mortality per age. See results in Appendix, Tables C4, C5 and C6). An exogenous increase of retirement claiming age by one quarter has a non-significant impact at the conventional 5% level for any of the ages observed.19
182 coefficients over 47 are significant at the 5% level and 2 coefficients over 47 are significant at the
10% level.
3.3
Robustness Checks
Sample Selection. To ensure that our sample restriction does not impact our results in Panel A and B, we test several alternative specifications.20 Figure 6 shows the causal effect of later retirement on mortality for panels A and B depending on the sample selection. Our main specification is a selection of individuals who contribute between 80 and 180 quarters at age 60. Figures 6b, 6d and 6f (Panel A) show the estimated causal impact of later retirement on the probability to die between ages 72 and 79. Figures 6a, 6c and 6e (Panel B) show the same results between ages 65 and 72 with various sample selections based on contribution length at age 60. For the whole Panel A (resp. B), this effect is non-significant in 14 (resp. 16) over 18 sample tested (See Figures 6b and 6a) at 5%, and never significant at 1%. When sub-samples are estimated by gender, the results are never significant.
Additional Controls. Our data provides little information concerning individuals’ socio-economic characteristics. The addition of control variables could modify the re-sults. We use Echantillon interrégime des retraités (EIR) data, an administrative dataset of retirees born in early October of every over year (see details in Appendix D). This data is smaller than the CNAV data, but includes individual characteristics such as children, marital status, and socio-professional characteristics. We rerun our model on this data, without control, as in Cnav data, and with control for marital status, profession and chil-dren (see Table D1). Our results are very similar in both cases, showing that additional controls do not change the results.
Alternative Models. We ensure that our results are not sensitive to the econometric model we choose. We estimate the impact of later retirement on mortality, using alterna-tive econometric models. Thus, Table D2 provides the results associated with an IV-Probit (1) and an IV-GMM (2). All these models show non significant results. Moreover, the reduced forms using Probit or Logit models also show non significant results.
20Since Panel C is really restricted due to data constraint, none of the following robustness test apply
Figure 6: Robustness Checks for Sample Selection
(a) Effect on the Probability to Die between 72 and 79 (Panel A)
-.006 -.004 -.002 0 .002 .004 .006 80-16090-160 100-160 110-160 120-160 130-160 80-170 90-170 100-170 110-170 120-170 130-170 80-180 90-180 100-180 110-180 120-180 130-180 Point estimate delayed retirement Confidence Interval at 95% Main specification
(b) Effect on the Probability to Die between 65 and 72 (Panel B)
-.006 -.004 -.002 0 .002 .004 .006 80-160 90-160 100-160 110-160 120-160 130-160 80-170 90-170 100-170 110-170 120-170 130-170 80-180 90-180 100-180 110-180 120-180 130-180 Point estimate delayed retirement Confidence Interval at 95% Main specification
(c) Effect on the Probability to Die between 72 and 79 (Men Panel A)
-.006 -.004 -.002 0 .002 .004 .006 80-16090-160 100-160 110-160 120-160 130-160 80-170 90-170 100-170 110-170 120-170 130-170 80-180 90-180 100-180 110-180 120-180 130-180 Point estimate delayed retirement Confidence Interval at 95% Main specification
(d) Effect on the Probability to Die between 65 and 72 (Men Panel B)
-.006 -.004 -.002 0 .002 .004 .006 80-160 90-160 100-160 110-160 120-160 130-160 80-170 90-170 100-170 110-170 120-170 130-170 80-180 90-180 100-180 110-180 120-180 130-180 Point estimate delayed retirement Confidence Interval at 95% Main specification
(e) Effect on the Probability to Die between 72 and 79 (Women Panel A)
-.006 -.004 -.002 0 .002 .004 .006 80-16090-160 100-160 110-160 120-160 130-160 80-170 90-170 100-170 110-170 120-170 130-170 80-180 90-180 100-180 110-180 120-180 130-180 Point estimate delayed retirement Confidence Interval at 95% Main specification
(f) Effect on the Probability to Die between 65 and 72 (Women Panel B)
-.006 -.004 -.002 0 .002 .004 .006 80-160 90-160 100-160 110-160 120-160 130-160 80-170 90-170 100-170 110-170 120-170 130-170 80-180 90-180 100-180 110-180 120-180 130-180 Point estimate delayed retirement Confidence Interval at 95% Main specification
Note: We test several alternatives to our sample restrictions. Our main specification is a selection of individuals
who contribute between 80 and 180 quarters at age 60.
4
Discussion
We find that an exogenous increase in retirement claiming age in France led to a non-significant impact on mortality over age 61. In order to interpret the implications of such result, there are three issues to discuss: i) are the results consistent with previous studies?; ii) in what respect does the French reform provide information for other reforms, i.e., assessing the external validity of the study? and iii) what is the economic significance of the results?
Previous Literature We carry out a comparison with previously published studies. We compare our results to those obtained in the literature on the effects of later retirement on mortality. When results are non-significant, we also compute the MDE estimates to assess whether each study has the statistical power to estimate the possible impact.
The effect of delaying retirement is not necessarily symmetric with the impact of early retirement, and most of the studies focus on the causal impact of early retirement (Coe and Lindeboom, 2008; Hernaes et al., 2013; Hallberg et al., 2015; Bloemen et al., 2017; Kuhn et al., 2019). The effects may be different According to the sign of the variation. Possibly there will be no impact of later retirement on mortality, however there could be a positive or negative impact of early retirement on health. We therefore split the sample by making separate comparisons between studies using increase or decrease in retirement ages.
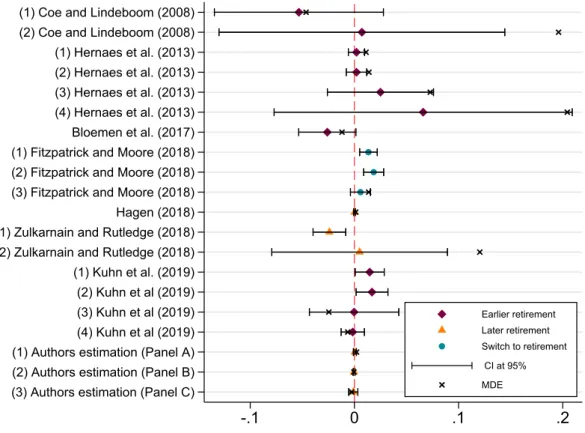
Figure 7 shows our point estimates and confidence intervals at 95%, as well as those obtained in the previous studies. Figure 7 also shows the computation of MDE when results are non-significant. It relies on estimates of papers presented in detail in Table 3.21 Two results stand out from this comparison. First, few studies have enough statistical power to conclusively estimate impact on mortality of retirement age changes. Apart from our study, only Hernaes et al. (2013), Hagen (2018) and Kuhn et al. (2019) have enough precision to draw inference on the likely impact. In the latter three cases, the estimated impacts are very close to zero. Secondly, the average impacts remain very small: for
21The magnitude of the treatment is not the same between the previous studies and ours. We examine
the effect of an additional quarter in claiming age versus one additional quarter, resp. one additional year, spent in early retirement (Hernaes et al. (2013), resp. Kuhn et al. (2019)) or an increase of four to five months of the actual retirement age (Hagen, 2018).
Figure 7: Point estimates and MDE in our study and previous studies
(1) Coe and Lindeboom (2008) (2) Coe and Lindeboom (2008) (1) Hernaes et al. (2013) (2) Hernaes et al. (2013) (3) Hernaes et al. (2013) (4) Hernaes et al. (2013) Bloemen et al. (2017) (1) Fitzpatrick and Moore (2018) (2) Fitzpatrick and Moore (2018) (3) Fitzpatrick and Moore (2018) Hagen (2018) (1) Zulkarnain and Rutledge (2018) (2) Zulkarnain and Rutledge (2018) (1) Kuhn et al. (2019) (2) Kuhn et al (2019) (3) Kuhn et al (2019) (4) Kuhn et al (2019) (1) Authors estimation (Panel A) (2) Authors estimation (Panel B) (3) Authors estimation (Panel C)
-.1 0 .1 .2 Earlier retirement Later retirement Switch to retirement CI at 95% MDE
Note: This Figure presents a meta-analysis of the literature regarding the causal effect of later vs earlier retirement
on mortality. For each row, we show point estimates, confidence intervals at 95%. MDE are only shown for non-significant effects. Coe and Lindeboom (2008) measure the impact of early retirement on the probability to die within four years – see row (1), within six years – see row (2). See Table 3 for details on each point-estimate. The six last lines show our point estimates and confidence intervals at 95% for each panel, for men and women. Rows (1) and (2) show the estimation on the all sample for Panel B and resp. B, rows (3) and (4) for men (resp. Panels A and B), rows (5) and (6) for women, resp. Panels A and B.
all studies together, the average estimate is slightly positive, around 0.0011, for studies focusing on later retirement the impact is slightly negative around -0.0020. We find very similar results when comparing our results with the most precisely estimated effects of reforms delaying retirement: the baseline estimates of Hagen (2018) is a non-significant positive point estimate of 0.00028 compared to our estimates of 0.00121, -0.00035 and -0.00107 respectively in our three samples.
T able 3: Literature Review on the Impact of Retiremen t on Mortalit y A uthors (y ear) Coun try P ension rules or reform Metho d Outcome P oin t P opula tion estimates Co e and Lindeb o om (2008) USA Age sp ecific retiremen t IV Mortalit y HRS, blue-and white-incen tiv es of the (1) within 4 y ears : -0.0533 (0.0414) collar w ork ers, men US So cial Securit y system T able 9 (column 2) (2) within 6 y ears : 0.0072 (0.07) T able 9 (column 4) Hernaes et al. (2013) Norw a y In tro duction of DD and IV Mortalit y register data early retiremen t sc heme (1) b y age 67 0.002 (0.004) T able 4 (column 2) (2) b y age 70 0.002 (0.005) T able 4 (column 4) (3) b y age 74 0.025 (0.026) T able 4 (column 6) (4) b y age 77 0.066 (0.073) T able 4 (column 8) Hallb erg et al. (20 15) Sw eden In tro duction of DD Causes of death Early retiremen t offer Military early retiremen t sc heme ages 56–70 reduces mortalit y Blo emen et al. (2017 ) The Netherlands Early retiremen t IV Mortalit y -0.026 (0.014) civil serv an t, men reform within 5 y ears T able 2 (column 3) Fitzpatric k and Mo ore (2018) USA Early Retiremen t RDD Mon thly mortal it y coun ts National Cen ter Age (62) (1) All 0.0135 (0.0043) for Health Statistics, T able 2 (column 1) p eople b orn bt w (2) Men 0.0185 (0.0049) 1921 and 1948 T able 2 (column 2) (3) W omen 0.0058 (0.0049) T able 2 (column 3) Hagen (2018) Sw eden Reform increasing DD Mortalit y lo cal go v ernmen t incen tiv es to b y age 69 0.000283 (0.000454) w ork ers, w omen retire la te r T able 9 (column 7) Zulkarnain and R utledge (2018) The Netherlands Reform that IV 5-y ear mortalit y rate p eople b orn bt w induced dela y ed (1) for men aged 62-65 -0.024 (0.008) 1943 and 1954 retiremen t T ables 4b and 4c (resp. columns 2 and 1) (2) for w omen aged 62-65 0.005 (0.043) T able 4b (column 5) Kuhn et al. (2019) A ustria Extension of early DD and IV Mortal it y b y age 73 retiremen t sc heme (1) Men 0.0147 (0.0071) T able 3 (column 1, ro w A. IV) (2) Blue-collar men 0.0169 (0.0078) T able 4 (column 2, ro w B. IV ) (3) White-collar men -0. 0003 (0.0219) T able 4 (column 3, ro w B. IV ) (4) W omen -0.0016 (0. 0057) T able 3 (column 4, ro w A. IV) 1 Notes: W e re p ort the p oin t-estimates for studies measuring the causal impact of retiremen t on morta lit y with the exact source in eac h pap er, i.e. T ables and columns. IV: in str um en tal v ariables. RD D: regression disc o n tin ui ty de sign DD: difference-in-differences.
External Validity. All the studies exploiting exogenous changes of retirement age to assess their causal impact on health outcomes, lead to local results, i.e. generalisation to other settings is not possible. Our study faces similar limits. First, the reform does not affect individuals with very long or very short careers, meaning that our results only concern a subset of individuals with average career lengths. Individuals with these careers have specific socio-economic characteristics, which can be endogenous with health status. Especially, the impact of retirement on mortality could affect individuals with very long careers. Second, this reform does not affect individuals eligible for disability pensions. Individuals in poor health affected by the reform were able to retire on disability pensions, and thus without postponing their retirement claiming age.22
Thus, our study shows the impact of increased retirement age for the population affected by the reform, for wage earners with average career length, who represent a large part of the population.
Unobservable impact between ages 60 and 61. In this paper, we find no significant impact of later retirement on mortality from age 61. Thus, there could be an effect between age 60, the earliest age an individual can claim for a pension, and age 61. The only papers in the literature finding an increase in mortality are Kuhn et al. (2019) and Fitzpatrick and Moore (2018). Kuhn et al. (2019) find an increase in mortality between ages 50 and 73, following an earlier retirement. Fitzpatrick and Moore (2018) find an increase in mortality at the legal retirement age in the United States. This effect is not due to later retirement, but to the switch to retirement (see Figure 7 and Table 3). In our main samples, as the individuals are all retired, both the treatment and control groups would have experienced such an effect at retirement. This does not preclude a potential short-term effect in the form of delayed impact of the switch to retirement for the treated group, in the case of this effect existing in France. However, to our knowledge, there is no evidence supporting this effect on French data.
Quantification of the Effect in Relative Terms. We have found impact estimates that are non significant, showing both positive and negative signs and relatively small in
22Bozio (2011) shows a small share of treated individuals demands disability pensions following the
magnitude, even for MDE estimates. It is important to emphasize he economic significance of the results.
The minimum detectable effect is small in magnitude: a one quarter increase in claim-ing age is lower than a probability to die by 0.002 (Panel A). This is equivalent to an increase of the probability to die between ages 72 and 79 by 1.29%. This variation is lower than the variation of the death probability between ages 72 and 79 between cohorts 1933 and 1934 (2.84%) and lower than the variation of the death rate at age 72 between cohorts 1933 and 1938 (2%). It follows that, if an effect on mortality occurs due to the reform affecting the youngest cohorts who benefit from a higher life expectancy, this im-pact is lower than the longevity gains between cohorts. Comparatively, the latter imim-pact could be linked to that of education on mortality. We find a variation which is lower than the 3.6% reduction in ten years mortality thanks to an additional year of education (Lleras-Muney, 2005).
Considering the above comparisons, our estimates suggest that increasing retirement age around the age of 60 has no detrimental impact on mortality over age 65, excluding those individuals with very long or very short careers.
Conclusion
This paper investigates the impact of delaying retirement on mortality among the French population. We identify the causal effect of an increase in claiming age on mortality using the 1993 pension reform in the private sector. We use administrative data which provide detailed information on career characteristics and both birth and death dates. Our results show that an exogenous increase of the retirement claiming age has no significant impact on the probability to die between ages 61 and 79.
This effect is precisely estimated thanks to a large sample size and the strong explana-tory power of the excluded instrument. We use the minimal detectable effect procedure to distinguish between power issues and small effects. this procedure has been largely ignored by previous literature.
Our results show that a pension reform, which has succeeded in delaying retirement age for a subgroup of the population, did so without detrimental effects on mortality over
age 65. This study does not say anything about a mortality effect of delayed retirement that would occur immediately after retirement claiming age (between age 60 and 61), or older (after age 79). Moreover, this result cannot be applied to the full population, as the affected group may be healthier than the population average and exclude individuals with very long or very short careers.
References
Atalay, K. and G. F. Barrett (2014): “The causal effect of retirement on health: New evidence from Australian pension reform,” Economics Letters, 125, 392–395. Au, D. W. H., T. F. Crossley, and M. Schellhorn (2005): “The effect of health
changes and long-term health on the work activity of older Canadians,” Health
Eco-nomics, 14, 999–1018.
Ayyagari, P. (2016): “The Impact of Retirement on Smoking Behavior,” Eastern
Eco-nomic Journal, 42, 270–287.
Behncke, S. (2012): “Does retirement trigger ill health?” Health Economics, 21, 282– 300.
Belloni, M., E. Meschi, and G. Pasini (2016): “The Effect on Mental Health of Retiring During the Economic Crisis: Mental Health and Retiring During the Crisis,”
Health Economics, 25, 126–140.
Benallah, S. and C. Mette (2009): “Âge moyen de départ en retraite : tendances récentes et évolutions attendues,” Retraite et société, 2, 166–183.
Bingley, P. and A. Martinello (2013): “Mental retirement and schooling,” European
Economic Review, 63, 292–298.
Blake and Garrouste (2019): “Collateral Effects of a Pension Reform in France,”
Annals of Economics and Statistics, 57–86.
Bloemen, H., S. Hochguertel, and J. Zweerink (2017): “The causal effect of retirement on mortality: Evidence from targeted incentives to retire early,” Health
Economics, 1–14.
Bloom, H. S. (1995): “Minimum detectable effects: a simple way to report the statistical power of experimental designs,” Evaluation review, 19, 547–556.
Bonsang, E., S. Adam, and S. Perelman (2012): “Does retirement affect cognitive functioning?” Journal of Health Economics, 31, 490–501.
Bound, J., M. Schoenbaum, T. R. Stinebrickner, and T. Waidmann (1999): “The dynamic effects of health on the labor force transitions of older workers,” Labour
Economics, 6, 179–202.
Bound, J. and T. Waidmann (2007): “Estimating the health effects of retirement,”
Michigan Retirement Research Center - Working Paper, 1–36.
Bozio, A. (2011): “La réforme des retraites de 1993 : l’impact de l’augmentation de la durée d’assurance,” Economie et statistique, 441, 39–53.
Bradford, L. P. (1979): “Can You Survive Your Retirement,” in Coping with Life
Crises, ed. by R. H. Moos, Springer US, The Springer Series on Stress and Coping,
211–219.
Calvo, E., N. Sarkisian, and C. R. Tamborini (2013): “Causal Effects of Retire-ment Timing on Subjective Physical and Emotional Health,” The Journals of
Geron-tology Series B: Psychological Sciences and Social Sciences, 68, 73–84.
Carp, F. M. (1967): “Retirement crisis,” Science, 157, 102–103.
Celidoni, M., C. Dal Bianco, and G. Weber (2017): “Retirement and cognitive decline. A longitudinal analysis using SHARE data,” Journal of Health Economics, 56, 113–125.
Celidoni, M. and V. Rebba (2017): “Healthier lifestyles after retirement in Europe? Evidence from SHARE,” The European Journal of Health Economics, 18, 805–830. Charles, K. K. (2004): “Is retirement depressing?: Labor force inactivity and
psycho-logical well-being in later life,” in Accounting for worker well-being, Emerald Group Publishing Limited, 269–299.
Coe, N. B. and M. Lindeboom (2008): “Does retirement kill you? Evidence from early retirement windows,” Tilburg University Discussion Paper.
Coe, N. B. and G. Zamarro (2011): “Retirement effects on health in Europe,” Journal
Coile, C., K. Milligan, and D. Wise (2019): Social Security Programs and
Retire-ment around the World: Working Longer, University of Chicago Press.
Disney, R., C. Emmerson, and M. Wakefield (2006): “Ill health and retirement in Britain: A panel data-based analysis,” Journal of Health Economics, 25, 621–649. Dwyer, D. S. and O. S. Mitchell (1999): “Health problems as determinants of
retirement: Are self-rated measures endogenous?” Journal of Health Economics, 18, 173–193.
Eibich, P. (2015): “Understanding the effect of retirement on health: Mechanisms and heterogeneity,” Journal of Health Economics, 43, 1–12.
Ekerdt, D. J., L. Baden, R. Bosse, and E. Dibbs (1983): “The effect of retirement on physical health.” American Journal of Public Health, 73, 779–783.
Fitzpatrick, M. D. and T. J. Moore (2018): “The mortality effects of retirement: Evidence from Social Security eligibility at age 62,” Journal of Public Economics, 157, 121–137.
Fonseca, R., A. Kapteyn, J. Lee, G. Zamarro, and K. Feeney (2014): “A Lon-gitudinal Study of Well-being of Older Europeans: Does Retirement Matter?” Journal
of Population Ageing, 7, 21–41.
Godard, M. (2016): “Gaining weight through retirement? Results from the SHARE survey,” Journal of Health Economics, 45, 27–46.
Gorry, A., D. Gorry, and S. N. Slavov (2018): “Does retirement improve health and life satisfaction?” Health Economics, 27, 2067–2086.
Hagen, J. (2018): “The effects of increasing the normal retirement age on health care utilization and mortality,” Journal of Population Economics, 31, 193–234.
Hallberg, D., P. Johansson, and M. Josephson (2015): “Is an early retirement offer good for your health? Quasi-experimental evidence from the army,” Journal of