HAL Id: hal-03044975
https://hal.univ-lorraine.fr/hal-03044975
Submitted on 22 Feb 2021
HAL is a multi-disciplinary open access
archive for the deposit and dissemination of
sci-entific research documents, whether they are
pub-lished or not. The documents may come from
teaching and research institutions in France or
abroad, or from public or private research centers.
L’archive ouverte pluridisciplinaire HAL, est
destinée au dépôt et à la diffusion de documents
scientifiques de niveau recherche, publiés ou non,
émanant des établissements d’enseignement et de
recherche français ou étrangers, des laboratoires
publics ou privés.
Sub-boundaries induced by dislocational creep in
uranium dioxide analyzed by advanced diffraction and
channeling electron microscopy
M. Ben Saada, Nathalie Gey, B. Beausir, X. Iltis, H Mansour, N Maloufi
To cite this version:
M. Ben Saada, Nathalie Gey, B. Beausir, X. Iltis, H Mansour, et al..
Sub-boundaries
in-duced by dislocational creep in uranium dioxide analyzed by advanced diffraction and
chan-neling electron microscopy.
Materials Characterization,
Elsevier,
2017,
133,
pp.112-121.
Sub-boundaries induced by dislocational creep in uranium dioxide analyzed
by advanced di
ffraction and channeling electron microscopy
M. Ben Saada
a,b, N. Gey
a,c,⁎, B. Beausir
a,c, X. Iltis
b,⁎⁎, H. Mansour
a, N. Malou
fi
a,caLaboratoire d'Etude des Microstructures et de Mécanique des Matériaux (LEM3), UMR CNRS 7239, Université de Lorraine, 54045 Metz Cedex 1, France bCEA, DEN, DEC, Cadarache, 13108, Saint-Paul-Lez-Durance, France
cLaboratory of Excellence on Design of Alloy Metals for low-mAss Structures (DAMAS), Université de Lorraine, France
A R T I C L E I N F O
Keywords: Uranium dioxide Creep EBSD ECCI Dislocation Porous materialA B S T R A C T
The network of sub-boundaries formed in a sintered UO2pellet after dislocational creep was examined. Very low
angle boundaries, down to 0.1° were reliably detected by Electron BackScattered Diffraction (EBSD). This an-gular resolution was achieved by optimizing EBSD data collection and processing. Moreover, Accurate-Electron Channeling Contrast Imaging (Accurate-ECCI) was able to image the dislocations produced by creep, directly on the bulk sample. The dislocations were mostly organized in sub-boundaries with low energy configurations. Only a limited number of isolated dislocations were observed. Finally, the deformation substructure obtained after 8% creep deformation (at 1500 °C under a 50 MPa uniaxial state) was quantified. The original grains with a mean size of 20μm were in average fragmented in sub-grains of about 5 μm. The geometrically necessary dislocations density (GND) was evaluated from thefiltered EBSD data to 7.9 × 10¹²m− 2. This value was 10 times higher
than that measured on the as-sintered sample. This confirms that the GND density calculation is sensitive to the dislocation increase after 8% deformation by creep.
1. Introduction
Sintered uranium dioxide pellets are commonly used in nuclear pressurized water reactors. In normal operating conditions, their cen-tral temperature reaches values of the order of 1000 °C whereas it in-creases up to 1500 °C, or even more, during power transients. Under these conditions, the pellets undergo significant plastic deformation through creep mechanisms, which influence pellet-cladding interaction processes[1,2]. These mechanisms are partly reproduced by compres-sion creep tests on non-irradiated pellets[3]. The resulting creep da-mage in these deformed UO2pellets is characterized by the
develop-ment of inter-granular cavities at low stresses (25 MPa), and crack opening at high stresses (50 MPa)[3]. Inside the grains, dislocations produced during the deformation arrange in sub-boundaries, as pre-viously evidenced by means of Transmission Electron Microscopy (TEM) examinations[4]. However, no scale transition between the SEM observations on bulk UO2crept samples and those made by TEM on thin
foils, can be found in the literature. In addition, no quantified data about the deformation substructure is available.
Electron BackScattered Diffraction (EBSD) and Electron Channeling Contrast Imaging (ECCI) could contribute to achieve TEM-SEM scale
transitions and quantify the microstructure evolution under creep. Indeed, ECCI is a SEM-based technique that allows imaging defects in the near surface of bulk materials [5–8]. Moreover, in many cases, comprehensive characterization of dislocations is possible using ana-lyses of dislocation contrast with various diffraction conditions[9–17]. Nevertheless, acquiring high quality ECC images requires the chan-neling conditions to be precisely satisfied. Electron Chanchan-neling Pattern (ECP) limited to single crystals or Selected Area Channeling Patterns (SACP) more suitable for polycrystalline materials are used to control the orientation of the region of interest. Unfortunately, the poor spatial resolution of SACP restricts ECCI applications to large grained materials
[9,11,18–25]. A new approach developed recently allows the collection of High Resolution SACPs with a spatial resolution of 500 nm[26]. It opens the way to apply Accurate-ECCI on submicron sized grains[27]. Dislocations in creep deformed UO2can now be observed by A-ECCI as
demonstrated in[28]while in the past they were only analyzed by TEM
[3,4]. Furthermore, continuous progress in EBSD detectors and dif-fraction patterns analysis offer now improved angular resolution to reliably quantify the low angle boundaries and the subsequent network of geometrically necessary dislocations (GND)[29–33].
Thus, this paper performs up to date EBSD analysis and A-ECC
⁎Correspondence to: N. Gey, Laboratoire d'Etude des Microstructures et de Mécanique des Matériaux (LEM3), UMR CNRS 7239, Université de Lorraine, 54045 Metz Cedex 1, France. ⁎⁎Corresponding author.
E-mail addresses:[email protected](N. Gey),[email protected](X. Iltis).
Imaging on UO2 samples to analyze and quantify the deformation
substructure induced by dislocational creep. EBSD data were acquired in improved angular resolution mode and post-processed with a routine optimized for porous materials. As a result, very low angle boundaries disorientated down to 0.1° were detected. These sub-boundaries were further observed by A-ECCI to reveal the dislocation network induced by creep deformation. Finally EBSD-based quantities were calculated over large EBSD maps to quantify the deformation substructure at a given creep state. They include the quantification of linear fraction of sub-boundaries and boundaries depending on their disorientation range, the determination of sub-grain average size and the GND density quantification. These quantities are worth to quantify the sub-struc-tured microstructure induced by creep and compare its evolution for different deformation conditions. They may also be useful in physically-based modeling of the creep behavior.
2. Experimental 2.1. Material
Pellets with a height of 12 mm and a diameter of 8 mm were fab-ricated from a single batch of UO2 powder [34]. The powder was
pressed uniaxially under 400 MPa and sintered at 1900 °C for 4 h under Ar + 5% H2atmosphere (thereby ensuring the material stoichiometry).
Their density measured by an immersion method was 98.6% of the theoretical density of UO2.
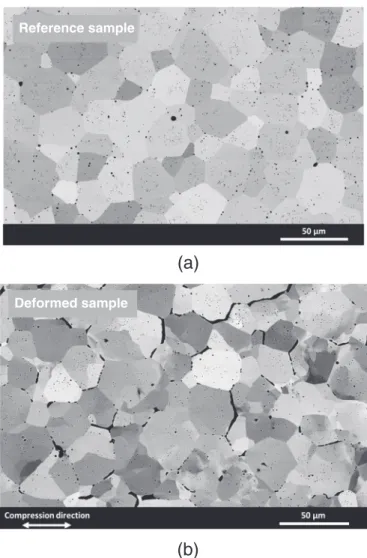
Fig. 1(a) illustrates the microstructure of the as-sintered reference sample. The grains are revealed by orientation contrast in backscattered electron (BSE) imaging mode. The average grain size is of 20μm. Small round fabrication voids are also present: they are located in inter- and intra-granular positions. Intra-granular pores are smaller (mean size of 0.4μm) and more numerous than inter-granular ones.
A compression creep test was conducted in an adapted furnace on a screw-type Instron compression test machine. The pellet was crept in the dislocational regime at 1500 °C under 50 MPa [34]. The steady creep state was reached after 80 min with a mean strain rate of 2.7%/h. The experiment was interrupted after 3 h at a mean deformation of about 8%. The same atmosphere as for sintering was applied to main-tain the material stoichiometry.
Finally, the pellet was sectioned parallel to the compression axis and the most deformed area in the central part of the pellet was identified by SEM examinations.Fig. 1b illustrates the microstructure after creep deformation. Important variations in the BSE signal are observed inside the grains and evidence sub-grains induced by the plastic deformation. Creep damage like large intergranular cavities is also observed. 2.2. Optimized EBSD Data Acquisition and Processing
EBSD maps were acquired using a FEI NovaNano SEM 450, equipped with a Nordlys II Nano camera (maximum CCD resolution: 1344 × 1024 pixels) and the process-driven software AZTEC (from Oxford Instruments). The EBSD data were acquired at an acceleration voltage of 20 kV, a beam current of about 10 nA, and a working dis-tance of 15 mm. The diffraction patterns were indexed with a CaF2type
fluorite structure (space group 225 - Fm3m). Indeed, uranium dioxide crystals form an FCC uranium lattice (a = 5.4705 Å) with oxygen ions located in the tetrahedral interstitial sites.
To improve the angular resolution, EBSD maps were performed at low camera binning of 2 × 2 and the Kikuchi patterns were indexed with the‘refined accuracy’ mode in AZTEC software[35]. This mode improves the Kikuchi Band detection: it considers that the Kikuchi bands are hyperbolic and refines the fit between experimentally de-tected and simulated bands accordingly. The angular resolution of conventional EBSD data is improved without severe impact on the ac-quisition speed.
Two types of maps were acquired. The first type corresponds to
small-scale maps with a reduced step of 0.15μm to reveal the network of intragranular misorientation induced by creep. The second type corresponds to large scale maps performed with an acquisition step of 0.4μm. These maps cover each around 300 grains for statistical analysis of the orientation data. Only one large EBSD map was acquired on the reference sample (named R0) whereas three maps (named D1, D2 and D3) were acquired on the deformed sample. They were measured in the central part of the sample where the most damaged area was located. All these EBSD maps had an indexation rate > 98%.
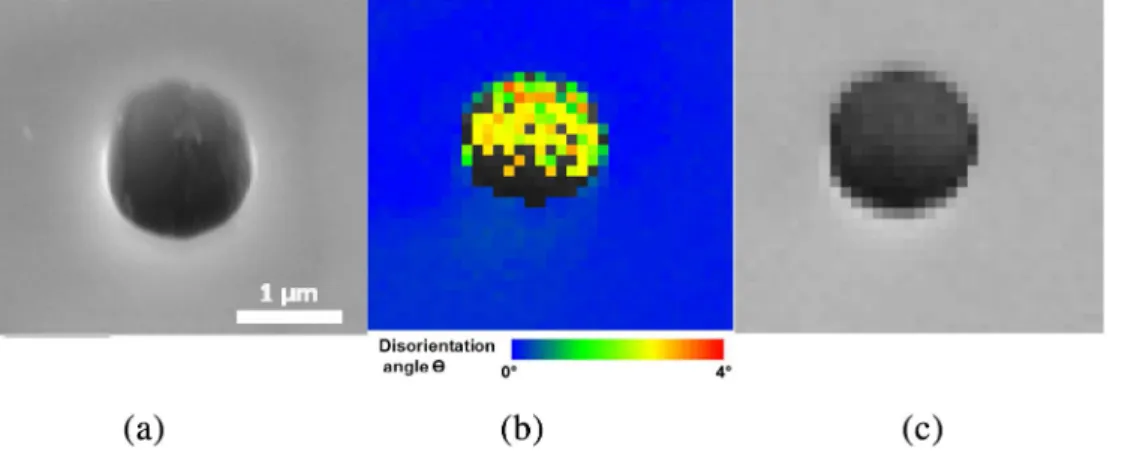
We paid a particular attention to the voids; they were all partially indexed whereas they should not.Fig. 2shows an example of an EBSD map acquired over a void previously imaged at 70° tilt (Fig. 2a). Most of the void surface was indexed as seen in Fig. 2b. Moreover the or-ientations obtained within the void were disoriented by 3° (in yellow/ green) from the orientation of its surrounding (in blue). These dis-orientations are artificial; they are caused by the topography around and within a void. Consequently, the orientations measured over the voids must be removed from the data set for a reliable analysis of dis-orientation induced by the creep process.
Thus a specific procedure was developed to clean EBSD data ac-quired on porous material. Its objective was to assign the status ‘non-indexed’ to points measured over voids. The most efficient EBSD-based index to detect the void location on the EBSD map was found to be the Band Slope (BS). The BS is a measure of the Kikuchi band sharpness. It is based on the diffraction intensity profile between the band edges: the sharper the intensity variation, the higher the BS value. Its average value over the voids was significantly different from that over the UO2
(a)
(b)
Reference sample
Deformed sample
Fig. 1. BackScattered Electron micrographs of UO2(a)“as-sintered” sample and (b) de-formed sample.
matrix, as seen inFig. 2c. Thus it could easily be thresholded to locate the voids. For our operating conditions, the threshold value was set to 150 (BS values range from 0 to 255). Pixels with BS below 150 were assigned to the status ‘nonindexed’. They were mostly associated to voids, but also to some pixels located at prior UO2boundaries.
Additional‘dilate’ and ‘erode’ data processing steps1were applied to reconstruct locally some boundaries wrongly set to ‘nonindexed’ withoutfinal changes of the void's contours.
Finally the angular resolution of the EBSD data was further im-proved by applying a local averagingfilter. It was developed in Atom software[36]by adapting the Kuwaharafilter (well known in image processing) to orientation data [37,38]. One moves a kernel of 5 × 5 pixels over the EBSD map. This kernel is then divided into four regions of 3 × 3 pixels (one from each corner of the 5 × 5 kernel) and the disorientation between the indexed pixels are calculated. The cen-tral pixel of the kernel is then reoriented to the average orientation of the region displaying the smallest standard deviation in disorientation distribution. Thisfilter efficiently reduces the orientation noise while preserving continuous disorientation lines.
2.3. Accurate ECCI to Reveal Dislocation Sub-boundaries
We used A-ECCI to reveal the dislocations induced by creep and their arrangement in sub-boundaries[27,39]. High-resolution selected area channeling patterns (HR-SACPs) were collected in the Zeiss Auriga 40 FEG-SEM equipped with the GEMINI-type electron column. All images were acquired at a working distance of 7 mm, an acceleration voltage of 20 kV and a beam current of 550 pA (with the 30μm center aperture). The rocking beam mode was calibrated to obtained sub-micron resolution SACPs as demonstrated in [26]. This resolution al-lows acquiring HR-SACPs over the UO2sub-grains.
Fig. 3a gives an example of HR-SACP acquired over the UO2sample
at zero tilt. The HR-SACP is indexed manually using the Kikuchi pattern simulated from the approximate orientation deduced by EBSD (Fig. 3b, c). To reach the desired two-beam channeling conditions and image the dislocations in the grain of interest, the sample is then rotated and tilted using the precise information extracted from the HR-SACP. Finally at the expected channeling position, a last HR-SACP is acquired to confirm the sample orientation relative to the incident beam before ECCI ana-lysis.
As seenFig. 3a, the intensity distribution of an experimental SACP of UO2 is extremely complex and the SACP can be indexed only by
comparison with a dynamical simulation. In this contribution, these simulations were obtained with “Esprit DynamicS” software from Bruker (the default setting for UO2phase was used for the input
para-meters)[40].Fig. 3b and c show respectively the dynamic and kine-matic patterns simulated from the approximate orientation deduced by EBSD. While it is difficult to locate unambiguously the HR-SACP on the kinematic simulation, the dynamic one offers a reliable and precise location of the HR-SACP. Of course further optimization of the software input parameters (absorption, excitation lengths) would be required to reproduce exactly the intensity distribution of the experimental SACP.
3. Results and Discussion
3.1. Creep Induced Sub-boundaries Detected on Improved Angular Resolution EBSD Map
Increasing the creep deformation produced a pronounced network of sub-boundaries inside the prior UO2grains. This is easily evidenced
on the BSE micrograph of the UO2deformed sample, by the contrast
variations observed within each prior grain (Figs. 1b,4a). Detection of this network by EBSD requires optimizing data acquisition and pro-cessing to get the best angular resolution of the EBSD map. Our protocol detailed in Section 2.2is able to resolve very low angle boundaries disoriented down to 0.1°.Fig. 4b shows the disorientation map obtained over the region imaged inFig. 4a (step size: 0.15μm). The network of low and very low angle boundaries measured within the prior grains overlaps quite well the sub-boundary network visible on the BSE image (Fig. 4a). Most of the disorientation lines of 0.1° are confirmed to be reliable sub-boundaries, actually observed in the BSE image.
The comparison ofFig. 4b and c illustrates the benefits of the
pro-posed data processing. On the raw EBSD map (Fig. 4c), most of the pores visible on the micrograph (Fig. 4a) have been indexed, leading to artificial disorientations in their neighborhood. On the other hand, on the BS-threshold map (Fig. 4b), most of the voids are identified and not indexed. Moreover, on the raw EBSD map, the sub-boundaries are embedded in the orientation noise whereas on thefiltered map, they are resolved.
Traditionally, Hough-transform based EBSD map offers an angular resolution of about 0.5° to 1.5° depending on the material and the SEM/ EBSD settings [40]. High angular Resolution EBSD (HR-EBSD) was developed to measure relative strain and rotation with an improved angular resolution[41–44]. It uses cross correlation based techniques to measure very small EBSD pattern shifts and provides theoretical pre-cision of about 10− 4rad (0.006°). In practice, disorientations down to 0.1° were detected in a Ni-based superalloy[43]. The ultimate precision is reached only with high quality EBSD patterns acquired with a long exposure time (often 1 s per point). It is thus developped to estimate the strain tensor with a high accuracy but not to index large EBSD datasets (due to the drawback of contamination and drift for large area maps).
Fig. 2. Example of EBSD map over a void (a) SEM image at 70° tilt, (b) Corresponding orientation map (the color code indicates the deviation from the average orientation of the blue grain) and (c) band slope map. (For interpretation of the refer-ences to color in thisfigure legend, the reader is referred to the web version of this article.)
1‘Erode’ and ‘dilate’ are morphological transformations classically applied to binary images.
They are often used to clean EBSD data. Here, the‘dilate’ transformation is first applied to extend indexed regions over neighboring indexed regions (the pores and the non-indexed grain boundaries). Then an addition‘erode’ transformation is applied to extend the non-indexed regions over their indexed neighborhoods. This puts the largest pores back to their original size without any impact on the fully reconstructed grain boundaries. M. Ben Saada et al.
The present indexing strategy is more inspired by the‘3D Hough transform’ approach developed by Maurice and Fortunier and for which a theoretical resolution of 5.10− 5rad (0.003°) is expected[41]. On UO2
samples, with an acquisition speed of 20 points/s (20 times higher than the conventional one used for HR-EBSD), an angular resolution of 0.1° was obtained. So, the proposed approach provides a real alternative to quantify precisely low angle sub-boundaries, down to 0.1°, with an interesting compromise between step size and exposure time. 3.2. Creep Induced Dislocation Network Observed by A-ECCI
Different sub-grained regions, black boxed inFig. 4b, were further analyzed by A-ECCI. Several channeling conditions have been applied to image dislocations configurations consisting of several Burgers vec-tors. Figs. 5 to 7give typical images of these sub-boundaries for one single channeling condition. They visualize different arrangements of dislocations induced by creep deformation in low and very low angle boundaries as well as isolated dislocations.
First, these ECC-images clearly confirm that the very low angle boundaries detected by EBSD trace the pile-up of dislocations.Fig. 5a gives a typical example of ECC-image acquired over a region containing a 0.1° disoriented line measured by EBSD (Fig. 5b). The low-dis-orientation lines in the EBSD map perfectly overlap the dislocation arrangement revealed by ECCI. Such dislocations are usually referenced as“Geometrically Necessary Dislocations” (GND): they induce a lattice curvature in order to accommodate local deformation gradients in-duced by creep and rearrange in low angle boundaries by further an-nealing.
According to our experience, for UO2grain boundary dislocations
can be distinguished individually by ECCI for sub-boundaries dis-oriented up to 0.8°, for UO2 samples. Fig. 6 illustrates by ECCI the
transition between sub-boundaries with regularly spaced dislocations countable or not respectively. The different sub-grains imaged inFig. 6a have either disorientations (Fig. 6b) belonging to very low (< 1°, in yellow) or low angle boundaries (> 1° and < 5°, in green).
The disorientation of a boundary is related to the spacing between Geometrically Necessary Dislocations, the higher the disorientation the smaller the spacing. For a model boundary made up of edge dislocations (tilt boundary), the low angle boundary disorientation (θ) and the dislocation's spacing (D) are related by[45]:
=│ │
θ b
D (1)
where b is the Burgers vector (│b│ = a/2〈110〉 = 0.387 nm for UO2).
The yellow line between sub-grains 1 and 2 has a disorientation angle of 0.36° ± 0.05°. On the corresponding ECC image (Fig. 6a), the average dislocation's spacing is 57 ± 5 nm. Those values are consistent with that expected for a theoretical tilt boundary. However, further
analysis is of course required for a complete description of this sub-boundary. On the contrary, the green sub-boundary between sub-grains 2 and 3 disoriented by 1.6° has no individual dislocations visible (a spacing of 14 nm would be required for a tilt boundary model) (Fig. 6b).
Further ECC-images indicate that most of the dislocations induced by the deformation were organized in sub-boundaries; only a limited number of isolated dislocations were observed within the sub-grains (some are seen inFig. 6). Moreover, they were mostly organized in low energy configurations. Fig. 7a and b show a faceted sub-boundary (disoriented from 0.33° to 0.74°).Fig. 7c shows a sub-boundary made of a regular network of dislocations (disoriented by 0.1°). Such networks are typical of boundaries incorporating different sets of screw disloca-tions. If the Burgers vectors are orthogonal then the dislocations do not strongly interact and the dislocation lines form a square network in the grain boundary plane. If the two Burgers vector can interact and form a third small Burgers vector then the dislocations produce a honey-combed network[46]. These different configurations have already been
observed in crept UO2by TEM[3,4]. The honeycombed network was
interpreted as initial 〈110〉 screw dislocations gliding in {001} planes2and interacting to form a third family by cross slip in the {111}
plane. More generally such organized grain boundary structures are assumed to be obtained with dislocation climbing out of their glide plane [46]. This mechanism is consistent with the high creep tem-perature (1500 °C) at which fast diffusion is operating.
4. EBSD-based Parameters to Quantify the Substructure Induced by Creep
In this section, we introduce different EBSD-based parameters to analyze quantitatively the grain substructure that develops during creep. These parameters are calculated on large scale EBSD maps, to be statistically relevant (seeSection 2.2). They are worth for coming re-search, to compare the microstructure evolution for different creep deformation conditions. They may also be useful in the development of physically-based modeling of the creep behavior[49].
4.1. Sub-boundary Quantification at Large Scales
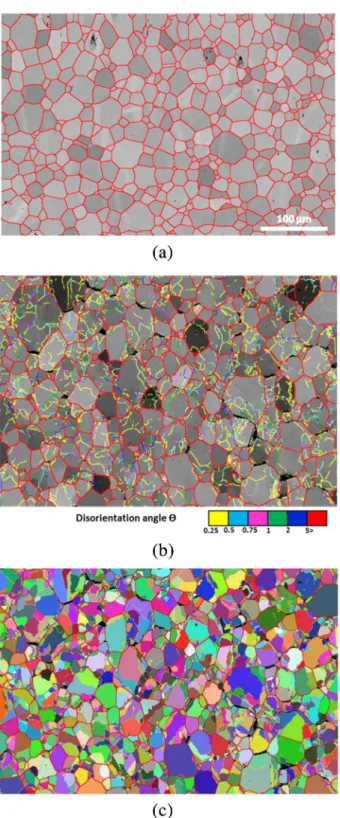
A dense network of sub-boundaries was created during creep. Most of them were disoriented by < 1°. However some limited sub-bound-aries reached a disorientation up to 5°. This is seen onFig. 8a and b with the disorientation-maps obtained on the reference sample and on the
Fig. 3. (a) HR-SACP collected from UO2, (b) the corresponding pattern simulated dynamically and (c) kinematically. The green cross in the HR-SACP indicates the microscope optic axis. (For interpretation of the references to color in this figure legend, the reader is referred to the web version of this article.)
2Dislocations in UO2are characterized by the Burgers vector b = a/2〈110〉. Due to the electrostatic interactions of ions within dislocation cores, the glide systems are not those classically observed in FCC structure. Indeed, {100}〈110〉 is the easiest system in UO2. With increasing temperature and deformation, {110} glide planes are also activated, as well as {111} planes by cross slip[47,48].
crept sample (filtered data). The same color code as inFig. 3is applied, except that the smallest disorientation class, with angles below 0.25°, is not considered.
This network was further quantified by calculating the linear frac-tions of boundaries and sub-boundaries associated to different dis-orientation classes. Fig. 9 considers all disorientations > 0.25° and classifies them in four groups. In the reference sample (R0 map), most of these disorientations were higher than 15° (96%). They characterize the disorientations between the UO2grains prior to deformation. Only
1.3% of the considered disorientations were lower than 5°. Conversely, in the UO2deformed sample (maps D1, D2 and D3), the fraction of
sub-boundaries with disorientations lower than 5° reached 68% (among which 52% are disoriented by < 1°). This increase from 1.3 to 68% quantifies the network of sub-boundaries induced by the deformation. It is interesting to notice that the three areas mapped by EBSD in this sample lead to very similar results. This allows concluding that each EBSD map is large enough to characterize the substructure induced by deformation. Of course, this holds only for EBSD maps acquired in the central part of the pellet, knowing that the deformation is not homo-geneous at the whole pellet scale.
On the large EBSD maps, the disorientation class, with angles below 0.25° were not quantified because these disorientations were not only associated to sub-boundaries induced by creep, but also to disorienta-tion lines, induced by scratches coming from mechanical polishing of the sample. In addition, on these EBSD maps acquired with a larger step size (0.4μm), the pores are less resolved and consequently the dis-orientation noise around them cannot be completely eliminated.
The disorientations belonging to the noise were further quantified and the result confirms that local disorientations below 0.25° were mostly embedded in the noise on the large-scale maps. This result was obtained by processing the EBSD data of the reference sample as fol-lows. The orientation spread was calculated within the largest grains (with equivalent diameter > 5μm). For each detected grain, one cal-culates from all orientations measured within this grain: the grain average orientation, the average grain orientation spread A-GOS (average disorientation from all measurements to the average orienta-tion), the maximum grain orientation spread M-GOS (maximum dis-orientation from all measurements to the average dis-orientation).Table 1
gives the statistic obtained over 200 recrystallized grains for thefiltered and unfiltered data. Considering the upper bond of the 3σ confidence interval, one obtains respectively for the unfiltered/filtered data an A-GOS value of 0.1°/0.05° and a maximum A-GOS value of 0.32°/0.25°. This indicates that the orientation noise is in average equal to 0.1°/0.05° on the large EBSD maps but locally it can reach up to 0.32°/0.25° (un-filtered/filtered data).
4.2. Quantification of the Sub-grain Sizes
The polygonization of the UO2 deformed grains can be further
quantified by identifying the sub-grains on the EBSD map and evalu-ating their average size. The classical EBSD grain recognition procedure clusters pixels disoriented from their neighbor by less than a threshold angleω0. However, a reliable detection of continuous sub-boundaries
with disorientations close to the angular resolution of the map requires specific attention. Indeed, the classical procedure would require to set ω0close to the orientation noise but would identify noisy pixels as
sub-grains. Conversely, increasingω0value would produce artificial open
sub-boundary lines and consequently two sub-grains would be clustered in a single one. To overcome this problem, an optimized grain detection procedure has been proposed for sub-boundary identification[50,51]. It proceeds in two steps and defines an upper and lower bound for the threshold angleω. The upper value is set higher than the orientation noise and is used to identify afirst network of well-identified boundary and sub-boundary lines. However those lines can be discontinuous, due to the‘high’ value of ω. The second step aims to close the open lines by tracking a path between neighboring pixels considering disorientation
(a)
(b)
(c)
Fig. 4. Deformed sample: (a) BSE micrograph, Disorientation angle map of the (b)filtered and (c) raw data (the background gray level is given by the Kikuchi Pattern Quality index, non-indexed points are black).
angles down to the lower bound.
This optimized sub-grain detection procedure was applied on the crept sample with the critical angleω set to 0.25°, for the upper value and 0°, for the lower one. The initially 20μm large grains were found to be fragmented into sub-grains with an average size of about 5μm.
Fig. 8c highlights in random colors sub-grains identified within the
prior UO2grains contoured in red. They rarely form a homogeneous
network within the prior grains but tend to concentrate at their boundaries. This probably results from heterogeneous creep deforma-tion with higher strain incompatibilities at those prior boundaries. Testing conditions (in particular, the mean strain rate) and the original microstructure (grain size, pores distribution…) probably also affect this sub-structuration process.
4.3. Geometrically Necessary Dislocations Analysis
In this section, the increase in GND density with creep deformation was quantified from the large scale EBSD maps (unfiltered/filtered data). In fact, among the dislocations induced by plastic deformation and previously observed by ECCI, one distinguish the SSD (statistically stored dislocations) et GND. A part of the density of the GND can be obtained from orientation maps[52]through the Nye tensorα[53]:
= + −
α curl ε( )e tr κ I( ) t κ (2)
The term curl(εe) will be here overlooked as the elastic deformation
εecannot be extracted from orientation maps.κ is the elastic curvature
tensor, calculated from the EBDS map:
Fig. 5. (a) A-ECC-image over a very low angle boundary detected on the EBSD map inFig. 4and zoomed in (b).
Fig. 6. (a) A-ECC image of a very low (left side) and a low angle boundary (right side) with respectively countable and uncountable dislocations and (b) corresponding EBSD map (zoom fromFig. 4), the sub-boundaries are presented with similar color code as inFig. 4. (For interpretation of the references to color in thisfigure, the reader is referred to the web version of this article.)
Fig. 7. A-ECC image at high resolution showing different types of dislocation arrangements (a–b) faceted sub-boundaries disoriented of 0.33°–0.74°, (c) a dislocation network with disorientations down to 0.1°.
≈ ∀ ∈ ∀ ∈
κ Δθ
Δx; i (1, 2, 3), j (1, 2)
ij i
j (3)
Δθi being the components of the disorientation vector between
neighboring points separated byΔxj.
Different methods are then used to evaluate the dislocation density
[54–58].
In this contribution, the calculation was performed with ATOM software[36]. The elastic curvature tensor (Eq.(3)) was calculated with
the two pointfinite difference approximation (considering the current pixel with its right- and bottom-neighbor). A cut-off angle of 5° was applied for translating a disorientation boundary into GND. The dis-location density is expressed by the entrywise 1-norm of the Nye tensor:
= ρ b α α 1 ij ij GND (4)
However, from 2D maps, only six components of the elastic curva-ture tensor can be capcurva-tured, as differences along the third direction are not available. Note also that the norm is divided by the Burger's vector length to present density values in m− 2unit.
Fig. 10maps the GND density in terms of entrywise norm of the Nye tensor for the deformed sample (filtered D3 map). Dislocation densities higher than 12.9 × 10¹³m− 2 are all colored in red. These highest densities (with a maximum reaching 89 × 1013m− 2) arise from the most disoriented sub-boundaries (those disoriented by > 2°, colored in blue and red inFig. 8b).Table 2gives the average dislocation densities ⟨ρGND⟩ calculated from the EBSD maps of the reference and the
de-formed sample (unfiltered and filtered data set). In average, the dis-location density of the deformed samples is of 17 × 1012m− 2.
Inter-estingly, the calculated values over the three deformed maps are very close (Table 2). This confirms again that each map is large enough to be representative of the deformed state at the central part of the pellet.
However, the absolute level of GND must be considered with cau-tion as it changes significantly according to various parameters
[54,57,59,60]. It is worth to mention that the GND calculation is step size dependent (see Eq.(3)). It is also sensitive to the precision of the orientations measured by EBSD. The use of the Kuwaharafilter reduces the orientation noise in the EBSD data. Consequently the GND values calculated from the unfiltered and filtered EBSD data show large dif-ferences (up to a decade as seen inTable 2). The effect of different
filters on the GND values has been discussed in[60]. The authors apply the calculation to orientation data obtained from as-acquired patterns and from as-acquired patterns plus an additional noise. All testedfilters brought the overall calculated GND distribution closer to that calcu-lated without additional noise. This result clearly shows that the ap-plication of afilter mitigates for averaged GND densities the effect of orientation precision. However suchfilter modifies locally the EBSD data by considering the local neighborhood. But for the dislocation densityfield, this is clearly not true. Thus for a discrete, and local GND analysis of the structure of the sub-grain boundary, it is recommended to consider the unfiltered EBSD data. However to be reliable, such local GND analysis requires orientation data with a high precision; HREBSD would be recommended.
Whatever, this orientation noise is translated in a certain level of dislocation density noise, often called spurious density[54]. As a con-sequence, the analysis of GND density values makes sense only if the level of spurious densitiesρspis also quantified. In this study, we suggest
to evaluate the spurious densities ρspfrom the noisy disorientations
obtained on a non-deformed sample (that contains no dislocations in-duced by the applied deformation). Of course the data must be acquired with similar acquisition parameters as for the deformed sample. The upper bound of the disorientation noise - 0.25°- (Table 1,Section 4.1) gives the range to translate a disorientation to noisy dislocation den-sities. This approach was applied to the large scale EBSD map of the reference sample. Disorientations below 0.25° were translated in the noise level of the dislocation density.
Applied to the reference map, the average spurious density of dis-locations was evaluated for our EBSD data to 11.5 × 10¹²m− 2
(un-filtered data inTable 2). The calculated average GNDs density of the reference sample was of 11 × 1012m− 2, what is clearly of the level of
the noise. This is consistent for this undeformed sample that contains no GNDs induced by creep.
For the deformed sample, the average GND density of 16.6 × 10¹²m− 2is higher than the noise. This was further quantified
with the average Signal to Noise Ratio (SNR) expressed as (ρGNDs/ρsp)2.
Fig. 8. Disorientation map overlapped to the Kikuchi pattern quality map (filtered data) for (a) the reference sample, (b) the deformed sample and (c) random coloring of sub-grains identified with an optimized routine - deformed sample. (For interpretation of the references to color in thisfigure, the reader is referred to the web version of this article.) M. Ben Saada et al.
One obtains a SNR of 2.1. This confirms that the GND density calcu-lation is sensitive to the dislocation increase after 8% deformation by creep.
Table 2also shows thatfiltering the data offers the opportunity to improve the SNR and makes the GND density calculation even more sensitive to low variations observed for different levels of creep de-formation. Indeed, the average of spurious densityρspon thefiltered
dataset was almost 20 times lower than the one obtained on the un-filtered dataset (seeTable 2, ρsp= 0.67 × 10¹²m− 2). Of course, the
average GND density value dropped also to 7.9 × 10¹²m− 2. But the
SNR increased to 140. This drop by a factor of almost 20 for the spurious dislocation density between unfiltered and filtered data is
surprisingly high (the corresponding average noise inTable 1decreased only a half). Actually the local orientation averaging performed by the Kuwaharafilter leads to neighboring pixels with zero-disorientations. They are translated in‘zero’ dislocation density values (whereas a local spurious density ofρsp≈ 1012m− 2is obtained from the local
orienta-tion noise). This explains the impressive drop in spurious dislocaorienta-tion density for thefiltered data.
Our approach may also give new insight in the evaluation of the lower bound of the detectable dislocation density (i.e. level of spurious density). In the literature, this lower bound is often deduced from the estimated orientation noise by[54,55]:
= │ │ ρ b a θn sp (5) whereθnis the noisy disorientation angle, a the step size and b the
Burger's vector. How the disorientation noise has been evaluated is rarely explained. Some authors consider forθna minimum angle of 1°
[55]. This value would result here in a dislocation density noise of 1.1 × 10¹⁴m− 2. In a 3D experiment, Konijnenberg [54]assumes a
much smallerθnof 0.2° that would here give a dislocation density noise
of 2.25 × 10¹³m− 2. Often the authors compare spurious densities
deduced from local disorientation noise with averaged dislocation densities.
For the present study, the average spurious density ρsp of
11.5 × 10¹²m− 2(Table 2, unfiltered data) gives θ
n= 0.1° according
to Eq.(5). This value is clearly close to the average disorientation noise calculated inTable 1. The local disorientation noise of 0.25° gives a local spurious density of 2.8 × 10¹³m− 2. However this value is not an
average value and cannot be compared to average GND density values (by the way, significantly below). Finally applying Eq.(5)to thefiltered data (ρspof 0.67 × 10¹²m− 2) gives an average disorientation noise of
0.006° (6 times lower than the calculated value on thefiltered data in
Table 1). So, onfiltered data, the θnvalue deduced from Eq.(5)
defi-nitely underestimates the average disorientation noise. 5. Conclusion
This contribution brings new insights to analyze and quantify the deformation substructure induced by dislocational creep, on the basis of advanced EBSD and A-ECCI experiments. It is applied to a porous UO2
Fig. 9. Linear fractions of grain and sub-grain boundaries (GB and S-GB), measured by EBSD (filtered data) on the reference sample (R) and on three areas of the deformed sample (D1, D2, D3) (considering all disorientation lines with angles > 0.25°).
Table 1
Grain orientation spread evaluated from the EBSD map of the reference sample to esti-mate the disorientation range belonging to the noise.
Unfiltered data Filtered data
N = 200 grains
(average diameter > 5μm)
A-GOS M-GOS A-GOS M-GOS
Average disorientation 0.05° 0.17° 0.016° 0.12° Standard deviation 0.015° 0.05° 0.01° 0.04° Average disorientation +3σ 0.1° 0.32° 0.05° 0.25°
2.6
5.2
7.8
10.3
>12.9
(max 89)
0
ρx10
13Fig. 10. Distribution of GND density (in terms of the entrywise1-norm) for the deformed sample, calculated from thefiltered EBSD data considering a cut-off angle of 5° (boundaries with larger dis-orientations than 5° are drawn in white - a linear color scale is used for the variation of dislocation densities).
pellet compression crept under 50 MPa at 1500 °C.
First, an optimized protocol for EBSD data acquisition and proces-sing is proposed to efficiently quantify sub-boundaries in porous ma-terial. The application to UO2pellets demonstrates that very low angle
boundaries, disoriented down to 0.1° can be reliably detected. This result corresponds to a real improvement to quantify sub-boundaries, in comparison to standard EBSD, less precise, or HR-EBSD, more time consuming. EBSD-based quantities calculated from large EBSD maps are further introduced to quantify the deformation substructure at a given creep state.
Moreover, evidence is made that A-ECCI is a powerful method to image the dislocations produced by creep and to analyze their ar-rangement in low angle boundaries. TEM quality images of dislocation networks are obtained on crept UO2, directly on the bulk material
analyzed by EBSD.
So, both techniques, EBSD and A-ECCI complement each other to obtain a comprehensive analysis of the deformation substructure from the dislocation level to the polycrystalline one.
Finally, the UO2deformation substructure after a given crept state
(8% mean deformation, at 1500 °C under 50 MPa) is analyzed taking advantage of the scale transition offered by EBSD and A-ECCI. A dense network of sub-boundaries was induced by creep. After deformation, the sub-boundaries disoriented by < 5° reached 67% of the total boundary length. Very low angle boundaries were also evidenced. They were formed by different arrangements of dislocations in low energy configurations. The prior UO2grains, with an average size of 20μm,
were in average fragmented in sub-grains of about 5μm. However, these sub-grains rarely formed a homogeneous network within the prior grains but had the tendency to concentrate at their boundaries. This network of sub-boundaries was further translated in GNDs. For the studied deformation state, the lower bound of the GND densities was estimated to 7.9 × 10¹²m− 2in average on thefiltered EBSD data (for
an average spurious density estimated to 0.67 × 10¹²m− 2). This value was 10 times higher than that measured on an‘as sintered’ reference sample.
Such analysis gives key results to quantify the deformation sub-structure and understand the material behavior. It can thus be very useful to compare the microstructure evolution, for different creep conditions. In case of sintered uranium dioxide fuel, it may help opti-mizing the microstructure to improve the viscoplastic behavior of the pellets during power transients.
References
[1] S. Aas, Mechanical interaction between fuel and cladding, Nucl. Eng. Des. 21 (1972) 237–253.
[2] B. Michel, J. Sercombe, C. Nonon, O. Fandeur, Modeling of pellet-cladding inter-action, Compr. Nucl. Mater. 3 (2012) 677–712.
[3] F. Dherbey, F. Louchet, A. Mocellin, S. Leclercq, Elevated temperature creep of polycrystalline uranium dioxide: from microscopic mechanisms to macroscopic
behaviour, Acta Mater. 50 (2002) 1495–1505.
[4] A. Alamo, J.M. Lefebvre, J. Soullard, Déformation plastique du bioxyde d'uranium: observation des sous-structures de dislocations, J. Nucl. Mater. 75 (1978) 145–153. [5] D.R. Clarke, Observation of crystal defects using scanning electron microscope,
Philos. Mag. 24 (1971) 973–979.
[6] R.M. Stern, T. Ichinokawa, S. Takashima, H. Hashimoto, S. Kimoto, Dislocation images in high-resolution scanning electron-microscope, Philos. Mag. 26 (1972) 1495–1499.
[7] D.C. Joy, Direct defect imaging in the high resolution SEM, Mater. Res. Soc. Symp. Proc. 183 (1990) 199–210.
[8] B.A. Simkin, M.A. Crimp, An experimentally convenient configuration for electron channeling contrast imaging, Ultramicroscopy 77 (1999) 65–75.
[9] B.C. Ng, B.A. Simkin, M.A. Crimp, Application of the electron channeling contrast imaging technique to the study of dislocations associated with cracks in bulk spe-cimens, Ultramicroscopy 75 (1998) 137–145.
[10] M. Pitaval, P. Morin, J. Baudry, G. Fontaine, Energyfiltering of backscattered electrons in scanning electron microscopy, Microsc. Spect. Elec. 2 (1977) 185–196. [11] P. Morin, M. Pitaval, D. Besnard, G. Fontaine, Electron-channeling imaging in
scanning electron-microscopy, Philos. Mag. A 40 (1979) 511–524.
[12] D.C. Joy, D.E. Newbury, D.L. Davidson, Electron channeling patterns in the scan-ning electron microscope, J. Appl. Phys. 53 (1982) 81–122.
[13] J.T. Czernuszka, N.J. Long, P.B. Hirsch, Electron channelling contrast imaging of dislocations, Proceedings of the 12th International Congress for Electron Microscopy, 410 San Francisco Press, 1990.
[14] B.A. Simkin, B.C. Ng, T.R. Bieler, M.A. Crimp, D.E. Mason, Orientation determi-nation and defect analysis in the near-cubic intermetallicγ-TiAl using SACP, ECCI, and EBSD, Intermetallics 11 (2003) 215–223.
[15] H. Kriaa, A. Guitton, N. Maloufi, Fundamental and experimental aspects of dif-fraction for characterizing dislocations by electron channeling contrast imaging in scanning electron microscope, Sci Rep 7 (2017) 9742.
[16] Y.N. Picard, M. Liu, J. Lammatao, R. Kamaladasa, M. De Graef, Theory of dynamical electron channeling contrast images of near-surface crystal defects,
Ultramicroscopy 146 (2014) 71.
[17] A.J. Wilkinson, P.B. Hirsch, The effects of surface stress relaxation on electron channelling contrast images of dislocations, Philos. Mag. E 72 (1995) 81–103. [18] N. Ferralis, J. Kawasaki, R. Maboudian, C. Carraro, Evolution in surface
mor-phology of epitaxial graphene layers on SiC induced by controlled structural strain, Appl. Phys. Lett. 93 (2008) 191916.
[19] A. Barnoush, Correlation between dislocation density and nanomechanical response during nanoindentation, Acta Mater. 60 (2012) 1268–1277.
[20] J. Ahmed, S.G. Roberts, A.J. Wilkinson, Characterizing dislocation structure evo-lution during cyclic deformation using electron channelling contrast imaging, Philos. Mag. 86 (2006) 4965–4981.
[21] M. Marx, W. Schaef, M.T. Welsch, The microstructure as crack initiation point and barrier against fatigue damaging, Int. J. Fatigue 41 (2012) 57–63.
[22] J. Ahmed, A.J. Wilkinson, S.G. Roberts, Study of dislocation structures near fatigue cracks using electron channelling contrast imaging technique (ECCI), J. Microsc. 195 (1999) 197–203.
[23] Y.N. Picard, R. Kamaladasa, M. De Graef, N.T. Nuhfer, W.J. Mershon, T. Owens, L. Sedlacek, F. Lopour, Future prospects for defect and strain analysis in the SEM via electron channeling, Microsc. Today 20 (2012) 12–16.
[24] G. Naresh-Kumar, B. Hourahine, P.R. Edwards, A.P. Day, A. Winkelmann, A.J. Wilkinson, P.J. Parbrook, G. England, C. Trager-Cowan, Rapid nondestructive analysis of threading dislocations in Wurtzite materials using the scanning electron microscope, Phys. Rev. Lett. 108 (2012) 135503.
[25] S. Zaefferer, N.N. Elhami, Theory and application of electron channelling contrast
imaging under controlled diffraction conditions, Acta Mater. 75 (2014) 20–50. [26] J. Guyon, H. Mansour, N. Gey, M.A. Crimp, S. Chalal, N. Maloufi, Sub-micron
re-solution selected area electron channeling patterns, Ultramicroscopy 149 (2015) 34–44.
[27] H. Mansour, J. Guyon, M.A. Crimp, N. Gey, B. Beausir, N. Maloufi, Accurate elec-tron contrast analysis of dislocations infine grained bulk materials, Scr. Mater. 84-85 (2014) 11–14.
[28] X. Iltis, M. Ben Saada, H. Mansour, N. Gey, A. Hazotte, N. Maloufi, A new char-acterization approach for studying relationships between microstructure and creep damage mechanisms of uranium dioxide, J. Nucl. Mater. 474 (2016) 1–7. [29] D.J. Dingley, Progressive steps in the development of electron backscatter
diffrac-tion and orientadiffrac-tion imaging microscopy, J. Microsc. (Oxford) 213 (2004) 214–224. [30] F.J. Humphreys, Review - Grain and subgrain characterisation by electron
back-scatter diffraction, J. Mater. Sci. 36 (2001) 3833–3854.
[31] M. Ben Haj Slama, N. Gey, L. Germain, J.C. Hell, K. Zhu, S. Allain, Fast granular-ization of lath−like bainite in FeNiC alloys during isothermal holding at Ms + 20 °C, Metall. Mater. Trans. A 47 (2016) 15–18.
[32] W. Pantleon, Resolving the geometrically necessary dislocation content by con-ventional electron backscattering diffraction, Scr. Mater. 58 (2008) 994–997. [33] B. Beausir, C. Fressengeas, Disclination densities from EBSD orientation mapping,
Int. J. Solids Struct. 50 (2013) 137–146.
[34] A. Ndiaye, Microstructures d’UO2à propriétés pilotées : compréhension des mécanismes d’élaboration et du comportement mécanique en température, PhD Thesis University of Grenoble, France, 2012.
[35] K. Thomsen, N.H. Schmidt, Improving the Accuracy of Orientation Measurements Using EBSD, Microsc. Microanal. 19 (Suppl 2) (2013).
[36] B. Beausir, J.-J. Fundenberger, Université de Lorraine - Metz, ATOM - analysis tools for orientation maps,http://atom-software.eu/, (2015).
[37] M. Kuwahara, K. Hachimura, S. Eiho, M. Kinoshita, Processing of RI-angiocardio-graphic images, in: K. Preston, Jr.M. Onoe (Eds.), Digital Processing of Biomedical
Table 2
Average dislocation densities⟨ρGND⟩ calculated from the EBSD maps of the reference and the deformed sample.
Unfiltered dataset Filtered dataset Norm average
(× 1012m− 2)
Norm average (× 1012m− 2) Reference sample 11 0.68 Estimation of the spurious density
ρsp: (reference sample for disorientations (0–0.25°))
11.5 0.67
Deformed map D1 16.6 8 Deformed map D2 16.1 8 Deformed map D3 17 7.8 Deformed sample - average value 16.6 7.9 Signal to noise ratio: (ρGNDs/ρsp)2 2.1 140 M. Ben Saada et al.
Images, Plenum, New York, 1976, pp. 187–202.
[38] F.J. Humphreys, P.S. Bate, P.J. Hurley, Orientation averaging of electron back-scattered diffraction data, J. Microsc. 201 (2001) 50–58.
[39] H. Mansour, M.A. Crimp, N. Gey, N. Maloufi, Accurate electron channeling contrast analysis of a low angle sub-grain boundary, Scr. Mater. 109 (2015) 76–79. [40] A. Winkelmann, C. Trager-Cowan, F. Sweeney, A.P. Day, P. Parbrook, Many-beam
dynamical simulation of electron backscatter diffraction patterns, Ultramicroscopy 107 (2007) 414–421.
[41] C. Maurice, R. Fortunier, A 3D Hough transform for indexing EBSD and Kossel patterns, J. Microsc. 230 (2008) 520–529.
[42] A.J. Wilkinson, G. Meaden, D.J. Dingley, High-resolution elastic strain measure-ment from electron backscatter diffraction patterns: new levels of sensitivity, Ultramicroscopy 106 (2006) 307–313.
[43] C. Maurice, R. Quey, R. Fortunier, J.H. Driver, High angular resolution EBSD and its materials applications, in: Dmitri A. Molodov (Ed.), Microstructural Design of Advanced Engineering Materials, 2013, pp. 339–365.
[44] T.B. Britton, C. Maurice, R. Fortunier, J.H. Driver, A.P. Day, G. Meaden, D.J. Dingley, K. Mingard, A.J. Wilkinson, Factors affecting the accuracy of high resolution electron backscatter diffraction when using simulated patterns, Ultramicroscopy 110 (2010) 1443–1453.
[45] L. Priester, Grain boundaries: from theory to engineering, Mechanical Stress Order of Grain Boundaries, 172 Springer, 2012, pp. 29–47.
[46] J. Friedel, Dislocations, Pergamon Press, Oxford_New York, 1964.
[47] E.J. Rapperport, A.M. Huntress, Deformation modes of single crystal uranium di-oxide from 700 °C to 1900 °C, Nuclear Metals (USA) Report NMI-1242, 1960, pp. 1–29.
[48] P.T. Sawbridge, E.C. Sykes, Electrostatic charges on dislocations in uranium di-oxide, J. Nucl. Mater. 35 (1970) 122–125.
[49] J. Soulacroix, B. Michel, J.M. Gatt, R. Kubler, L. Barrallier, Micromechanical
Behavior of UO2: Crystalline Anisotropy and Associated Internal Stresses in Polycrystals, 21ème Congrès Français de Mécanique, Bordeaux, 2013.
[50] L. Germain, D. Kratsch, M. Salib, N. Gey, Identification of sub-grains and low angle boundaries beyond the angular resolution of EBSD maps, Mater. Charact. 98 (2014) 66–72.
[51] Disclosed anonymously, grain boundary completion, Res. Discl. (2013),www. researchdisclosure.com.
[52] W. Pantleon, Resolving the geometrically necessary dislocation content by con-ventional electron backscattering diffraction, Scr. Mater. 58 (2008) 994–997. [53] J. Nye, Some geometrical relations in dislocated crystals, Acta Metall. 1 (1953)
153–162.
[54] P.J. Konijnenberg, S. Zaefferer, D. Raabe, Assessment of geometrically necessary dislocation levels derived by 3D EBSD, Acta Mater. 99 (2015) 402–414. [55] W. He, W. Ma, W. Pantleon, Microstructure of individual grains in cold-rolled
aluminium from orientation inhomogeneities resolved by electron backscattering diffraction, Mater. Sci. Eng. A 494 (2008) 21–27.
[56] D.P. Field, P.B. Trivedi, S.I. Wright, M. Kumar, Analysis of local orientation gra-dients in deformed single crystals, Ultramicroscopy 103 (2005) 33–39. [57] J. Jiang, T.B. Britton, A.J. Wilkinson, Measurement of geometrically necessary
dislocation density with high resolution electron backscatter diffraction: effects of detector binning and step size, Ultramicroscopy 125 (2013) 1–9.
[58] J.W. Kysar, Y. Saito, M.S. Oztop, D. Lee, W.T. Huh, Experimental lower bounds on geometrically necessary dislocation density, Int. J. Plast. 26 (2010) 1097–1123. [59] T.J. Ruggles, T.M. Rampton, A. Khosravani, D.T. Fullwood, The effect of length scale on the determination of geometrically necessary dislocations via EBSD con-tinuum dislocation microscopy, Ultramicroscopy 164 (2016) 1–10.
[60] S.I. Wright, D.P. Field, M.M. Nowell, Post processing effects on GND calculations from EBSD-based orientation measurements, Mater. Sci. Eng. 89 (2015) 012049.