HAL Id: hal-00828705
https://hal.archives-ouvertes.fr/hal-00828705
Submitted on 31 May 2013
HAL is a multi-disciplinary open access
archive for the deposit and dissemination of
sci-entific research documents, whether they are
pub-lished or not. The documents may come from
teaching and research institutions in France or
abroad, or from public or private research centers.
L’archive ouverte pluridisciplinaire HAL, est
destinée au dépôt et à la diffusion de documents
scientifiques de niveau recherche, publiés ou non,
émanant des établissements d’enseignement et de
recherche français ou étrangers, des laboratoires
publics ou privés.
Towards A Redefinition of Time in Information
Networks?
Sébastien Heymann, Bénédicte Le Grand
To cite this version:
Sébastien Heymann, Bénédicte Le Grand. Towards A Redefinition of Time in Information Networks?.
WebSci 2013 - 5th Annual ACM Web Science Conference, May 2013, Paris, France. pp.158-161,
�10.1145/2464464.2464498�. �hal-00828705�
Towards A Redefinition of Time in Information Networks?
S´ebastien Heymann
LIP6
-
CNRS- Universit´e Pierre et Marie Curie
4 place Jussieu, 75252 Paris, France
[email protected]
B´en´edicte Le Grand
CRI
- Universit´e Paris 1 Panth´eon – Sorbonne
90 rue de Tolbiac, 75013 Paris, France
[email protected]
ABSTRACT
How should we characterize the dynamics of the Web? Whereas network maps have contributed to a redefinition of distances and space in information networks, current studies still use a traditional time unit -the second- to understand the temporality of the Web. This unit leads to the observation of exogenous phenomena like day-night patterns. In order to capture the intrinsic dynamics of the network, we introduce an innovative -yet simple- concept of time which relies on the measure of changes in the network space. We demonstrate its practical interest on the evolution of the Github social net-work.
Author Keywords
Time; dynamics; measurement; complex networks; social network; sliding window.
ACM Classification Keywords
H.4.m Information Systems Applications: Miscellaneous
General Terms
Measurement.
INTRODUCTION
The Web and information networks in general connect people whatever their geographical distances. This property has led to the emergence of a novel concept of space: in networks, distances are defined by the number of links between ele-ments. Since the publication of the Atlas of Cyberspace [4], network maps have been used to study spatial phenomena through the metaphor of digital territory [3], like the blogo-sphereeffect on the Web. However the dynamics of the Web and of information networks remains unknown. Most of cur-rent studies indeed capture exogenous factors like day-night patterns caused by human activity, but they fail at capturing the intrinsic dynamics of the network. These results call for a redefinition of the concept of time in order to study the en-dogenous effects of network dynamics.
We propose in this paper an innovative concept of time based on the changes observed in the network space. Using a novel time unit, we observe a new kind of dynamics which is not captured when using a traditional time unit. We apply our
Permission to make digital or hard copies of all or part of this work for personal or classroom use is granted without fee provided that copies are not made or distributed for profit or commercial advantage and that copies bear this notice and the full citation on the first page. To copy otherwise, or republish, to post on servers or to redistribute to lists, requires prior specific permission and/or a fee.
WebSci’13, May 1 – May 5, 2013, Paris, France. Copyright 2013 ACM 978-1-4503-1889-1 $ 10.00.
method to the evolution of the Github social platform de-scribed below.
DATASET
Github.com is an online platform created in 2008 to help de-velopers share open source code and collaborate. Built on the Git decentralized versioning system, it facilitates contri-butions and discussions by providing a Web interface. Github reached 3 million users on January 16, 2013, who collaborate on 5 million source code repositories. Our dataset describes the complete activity between users and repositories on the platform from March 11, 2012 to July 18, 2012. We extracted the data from the Github Archive1, which is a record of
ev-ery public event on Github. Then we built the graph of ”who contributes to which repository”, where nodes represent users and repositories, and where links represent any kind of activ-ity users have on repositories. The graph is a pair G = (V, E) where V is the set of nodes and E ⊆ V × V is the set of links. The considered activities are the following: commit and push source code, open and close issues for bug reports, comment on issues, commits or pull request (i.e. asking for a patch to be merged), create or delete branches and tags, and edit the repository wiki. We ignore the other activities: fork (i.e. repository duplication), mark repositories as favorite, and fol-low of the timeline of another user or repository. There are a bit more than 336 000 nodes and 2.2 million links in the graph.
USE OF A SLIDING WINDOW
We collected all data necessary to monitor the evolution of the graph, as we stored all nodes and links over time. Each link is associated with a timestamp indicating the moment when it has been observed. The data is thus a stream of observed links, ordered by their timestamp. A node is considered to appear in the graph when it is attached to an observed link for the first time. However there is no information in data about the duration of nodes and links existence. A node may indeed be observed only once even if it exists during a long period. It means that we do not observe the nodes which appeared be-fore the beginning of the measurement and for which no link is observed during the measurement, i.e. who do not con-tribute or for which there is no activity during the studied pe-riod. We thus miss the registered users who do are not active in the social network during the measurement, and we also miss the existing repositories on which there is no activity. Three classical approaches exist for the study of network dy-namics. The first one consists in studying the growth of the graph over time, displayed in a cumulative way. For in-stance the cumulative number of nodes is shown in Figure 3,
time (s)
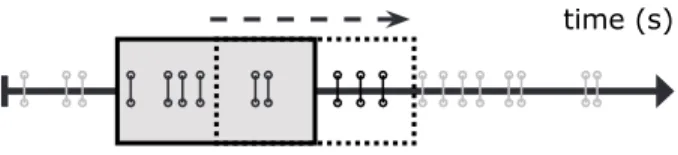
Figure 1. Stream of appearing links split in contiguous time win-dows.
time (s)
Figure 2. Example of a sliding time window over a stream of appear-ing links. Date Nb nodes 100000 200000 300000 ●●●●●●●●●●●●●●●●●●●●●●●●●●●●●●●●●●●●●●●●●●●●●●●●●●●●●●●●●●●●●●●●●●●●●●●●●●●●●●●●●●●●●●●●●●●●●●●●●●●●●●●●●●●●●●●●●●●●●●●●●● ●●●●●●●
12 Mar 14 May 18 Jul
Figure 3. Number of distinct nodes as a function of the total number of observed links. Time (nb links) Nb nodes2000 4000 6000 8000 ● ●● ●●●●●●●●●● ●●● ●●●● ●●●●●● ● ● ●● ● ●● ● ● ● ● ● ●●● ● ●●● ● ● ●●●●● ●●●●●●●●● ●● ● ●●●●● ●●● ● ●●●● ● ● ● ● ● ● ●●●●●●●●● ● ●●● ● ● ●●●●●●●● ●●●●●●● ● ●●● ● ● ● ● ●● ●●● ● ● ●● ●● ●●●●●●●● ● ● ● ● ●●● ● ●●●● ●●●●●●●●●●●●●●●●●● ● ●● ● ●●●●● ● ●●●● ● ● ● ● ● ● ●●●●● ● ●● ●● ●● ●● ● ●●● ● ● ● ● ●● ●● ● ● ● ● ● ● ●●●●● 500000 1000000 1500000 2000000
Figure 4. Number of distinct nodes in the union of 10,000 consecutive links for every 10,000 links, as a function of the number of observed links.
where the number of nodes is plotted as a function of the to-tal number of links observed since the beginning of the cap-ture. This plot displays a regular growth with a regime change at the end, but we obtain little information on the underly-ing dynamics. The second approach consists in splittunderly-ing the stream using contiguous time windows to build a series of sub-graphs, as illustrated in Figure . We then compute the selected statistical property on each sub-graph. For instance, the number of nodes of each sub-graph captured over time is shown in Figure 4. This plot displays a regular trend and a few spikes, however we may miss more subtle events and the precise moment of their appearance. So we use the general-ized version of this approach. This third approach, which we adopted, consists in extracting consecutive sub-graphs from a sliding time window, as illustrated in Figure .
Our approach is as follows: given a stream of links, we mea-sure a given statistical property of the graph observed inside a sliding time window. Let {e0, e1, ..., en} be a stream of links.
Let a sliding window of width w. If w is a function of time, e.g. a value in seconds, the sliding window is the multiset which contain all links observed during w seconds.
As far as we know, all studies on evolving networks which make use of a sliding window define its width in seconds. The apparent simplicity of this approach brings little attention
be-cause it is easy to set up and makes use of a common time unit. However it raises non-trivial questions (detailed in sec-tion 4) which are not addressed in most studies. On the other hand, the width w of the sliding window may correspond to a number of links (independently of the time intervals between those links); in this case, the sliding window is defined as follows:
Let {e0, e1, ..., en} be a stream of links. Let a sliding
win-dow of width w links: Ei = {ei−w+1, ..., ei}. Any link ei
of the series belongs to Ei, Ei+1, ..., Ei+w−1. We computed
the value of the studied property over the series of graphs, where each graph is made from the set of links in the time window: Let the graph Gi = (Vi, Ei) where Vi is the set
of nodes attached to the links in Ei. Let a series of graphs
Gw, Gw+1, ..., G|E|where |E| is the total number of links.
This sliding window, whatever the width unit used, allows us to build a time series corresponding to the evolution of the studied graph property over time.
The use of a sliding window for the analysis of graph dynam-ics raises the following question: which of these time units (traditional time-based or link-based) should we use to char-acterize the network evolution? In the following section we empirically study the impact of these different concepts of time on a trivial statistical property: the number of nodes ob-served in the network over time. We aim at determining the consequences of such choices on our ability to characterize network dynamics. We have found that the time unit has an important impact on the observed results.
WHICH TIME UNIT? Concept
Time is a controversial concept that one can see as a dimen-sion in which changes occur in sequence. In this perspective, time is considered as absolute, i.e. changes happen indepen-dently from the flow of time [7, 5]. But if we consider time as a relative concept, time then depends on space. This de-bate remains open, however in practice time is experienced as relative because we can only measure it through the rela-tive movements of bodies (in space). Many techniques exist to measure it. The unit adopted by the International System of Units is the second, which is defined as the transition between two states of the caesium 133 atom [2]. This unit is therefore related to movements measured in the physical space. However information networks make the physical space transparent by connecting elements whatever their geograph-ical distances. In graph theory, the distance between two nodes (also called geodesic distance) is indeed defined as the
Date
Nb nodes
500 1000 1500
11 March 13 April 31 May 18 July
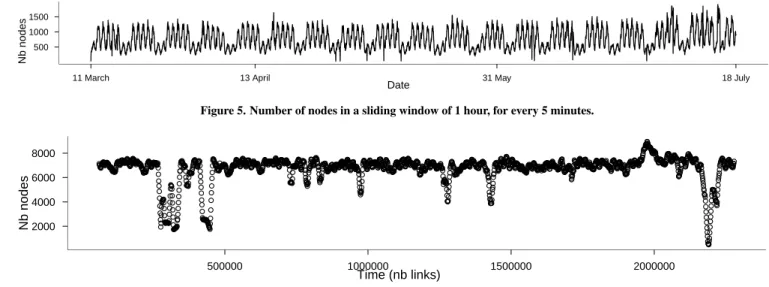
Figure 5. Number of nodes in a sliding window of 1 hour, for every 5 minutes.
Time (nb links) Nb nodes2000 4000 6000 8000 ● ● ●●●●●●●●●●●●●●●●●●●●●●●●●●●●●●●●●●●●●●●●●●●●●●●●●●●●●●●●●●●●● ● ● ●●●●●●●●●●●●●●●●●●●●●●●●●●●●●●●●●●●●●●●●●●●●●●●●●●●●●●●●●●●●●●●●●●●●●●●●●●●●●●●●●●●●●●●●●●●●●●●●●●●●●●●●●●●●●●●●●●●●●●●●●●●●●●●●●●●●●●●●●●●●● ● ● ● ● ● ● ● ● ● ●● ● ●●●● ●●●● ● ● ● ●●●●●●●●●●●●●●●●● ●● ● ● ●●●●● ● ● ● ● ● ●●●●●●●●●●●●●● ●● ● ● ● ● ● ●●● ● ●●●●●●●●●●●●●●●●● ● ● ● ● ●●●●●●●● ● ● ●●●●●●●●●●●● ● ● ●●●●●●●●●●●●●●●●●●●●●● ● ● ● ● ● ● ● ● ● ● ●●●●●●●●●●●●●●●●●●●●●●●●●●● ● ● ● ● ● ● ● ● ●●●●●●●●●●●●●● ● ● ● ●●●●●●● ●● ● ●●●●●●●●●●●●●●●●●●●●●●●●●●●●●●●●●●●●●●●●●●●●●●●●●●●●●●●●●●●●●●●●●●●●●●●●●●●●●●●●●●●●●●●●●●●●●●●●●●●●●●●●●●●●●●●●●●●●●●●●●●●●●●●●●●●●●●●●●●●●●●●●●●●●●●●●●●●●●●●●●●●●●●●●●●●●●●●●●●●●●●●●●●●●●●●●●●●●●●●●●●●●●●●●●●●●●●●●●●●●●●●●●●●●●●●●●●●●●●●●● ● ● ● ● ●●●●●●● ●● ● ●●●●●●●●●●●●●●●●●●●●●● ● ● ● ●●●●●●●●●●●●●●● ● ● ●● ● ● ●●●●●●● ●●●●● ● ● ●●●●●●●●●●●●●●●●●●●●●●●●●●● ● ● ● ● ●●●●●●●●● ● ● ●●●●●●●●●●●●●●●●●●●●●●●●●●●●●●●●●●●●●●●●●●●●●●●●●●●●●●●●●●●●●●●●●●●●●●●●●●●●●●●●●●●●●●●●●●●●●●●●●●●●●●●● ●●●●● ● ● ●●●●●●●●●●●●●●●● ● ● ● ● ● ●●●●● ● ● ●● ● ● ●●●●●●●●●●●●●●●● ● ●●●●●●● ●●●●●●●●●●●●●●●●●●●●●●●●●●●●●●●●●●● ●●●●●●●●●●●●●●●●●●●●●●●●●● ● ● ●●●●●●●●●●●●●●●●●●●●●●● ● ●●●●●●●●●●●●●●●●●●●●●●●●●●●● ●●● ● ●●●●●●●●●●●●●●●●●●●●●●●●●●●●●●●●●●●●●●●●●●●●●●●●●●● ● ●●●●●●●●●●●●●●●●●●●●●●●●●●●●●●●●●●●●●●●●●●●●●●●●●●●●●●●●●●●●●●●●●●●●●●●●●●●●●●●●●● ● ● ●●●●●●●●●●● ● ● ● ●●●● ● ● ● ●● ● ●●●●●●●●●●●●●● ●●●●●●●●●●●●●●●●●●●●●●●● ● ●●●●●●●●●●●●●●●●●●●●●●●●●●●●●●●●●●●●●●●●●●●●●●●●●●●●●●●●●●●●●●●●●●●●●●● ● ● ●●●●●●●●●●●●●●●●●●● ● ● ●● ● ● ●● ● ●●●●●● ● ●●● ● ●●● ●●●●●●●●●●●●●●●●●●●●●●●●●●●●●●●●●●●●●● ●●●●●●●●●●●●●●● ● ● ● ●●●●●●●●●●●●●●●●●●●●●●●●●●●●●●●●●●●●●●●●●●●●●●●●●●●●●●●●●●●●●●●●●●●●●●●●●●●●●●●●●●●●●●●●●●●●●●●●●●●●●●●●●●●●●●●●●●●●●●●●●●●●●●●●●●●●●●●●●●●●●●●●●●●●●●●●●●●●●●●●●●●●●●●●●●●●●●●●●●●● ● ●●●●●●●●●●●●●●●●●●●●●●●●●●●●●●● ● ●●●●●●●●● ● ●●●●●●●●●●●●●●●●●●●●●●●●●●●●●●●●●●●●●●●●●●●●●●●●●●●●●●●●●●●●●●●●●●●●●●●●●● ●●●●●●●●●●●●●●●●●●●●●●●●●●●●●●●●●●●●●●●●●●●●●●●●●●●●●●●●●●● ●●●●●●●●●●●●●●●●●●●●●●●●●●●●●●●●●●●●●●●●●●● ● ● ●●●●●●●●●●●●●●●●● ● ●●●●●●●●●●●●●●●●●●●●●●●●●●●●●●●●●●●●●●●●●●●●●●●●●●●● ●●●●●●●●●●●●●●●●●●●●●●●●●●●●●●●●●●●●●●●●●●●●●●●●●●●●●●●●●●●●●●●●●●●●●●●●●●●●●●●●●●●●●●●●●●●●●●●●●●●●●●●●●●●●●●●●●●●● ● ● ● ●●●●●●● ●●●●●●●●●●●●●●●●●●●●●●● ● ●●●●●●●●●●●●●●●●●●●●●●●●●●●●●● ● ● ●●●●●●●●●●●●●●● ● ● ●● ● ● ●● ● ●●●● ● ● ● ● ● ● ● ● ● ● ●●●●● ● ● ●● ● ● ●● ● ●●●●●●●● ● ● ●●●●●●●● ●● ● ●●●●● ● ● ●●●●●●●●●●●●●●●●●●●●●●●●●●●●●●●●●●●●●●●●●●●●●●●●● 500000 1000000 1500000 2000000
Figure 6. Number of nodes in a sliding window of 10,000 links, for each set of 1000 links.
number of links in a shortest path connecting them. Under the hypothesis that network distances are independent from geographical distances, we consider the physical space as ab-solute in a network point of view. Conversely if we reject this hypothesis and correlate network distances to physical dis-tances, the observation of such effects may hide the effects which are not related to the physical space. In the first case, measuring distances with physical units is not relevant. In the latter case, it brings little information on the network it-self. This question is difficult because effects have been found even for social networks and the Web, which are designed to abolish the physical distances between people. For instance, there is a higher probability on Facebook to be friend with someone from the same country [10]. On Github, open source developers based in North America receive a disproportionate amount of attention [9]. These studies shed light on the way the geographical location of users influences the network, but they do not address the reciprocal question of how the net-work allows users to be connected to one another despite ge-ographic boundaries. Therefore existing works do not study the endogenous effects at stake in the network (i.e. which come from inside).
Notwithstanding the high potential impact of a time unit de-rived from the physical space, most studies use the absolute time in evolving networks: statistical properties are measured as a function of the second and its derivative units (e.g. days and years). As a consequence, they detect exogenous activi-ties on these networks (i.e. which come from outside) [1, 8, 11]. For instance, click-stream data of Web traffic naturally reveal a day-night pattern in the network because of usual human activity [6]. While this finding may be of interest, it provides more information on the users activity than on the network itself. Such trends may hide the patterns which are only related to the network, preventing us to characterize the endogenous dynamics of the network.
We thus introduce a concept of relative time in a network point of view, called intrinsic time of the network, as opposed to the extrinsic time, which is a concept of absolute time. Let
the extrinsic time of the network be the time measured using the second. We call it extrinsic because its flow is indepen-dent from the changes that occur in the network. Let the in-trinsic timeof the network be the time measured by the tran-sition between two states of the network. The unit is thus the (spatial) change of the network, i.e. the addition or removal of one node or one link. This unit is minimal because nothing can happen in the network between two consecutive changes. We call it intrinsic because time depends on the changes that occur in the network, and changes depend on such time to happen. The relation between time and space in networks is however out of scope of this paper.
Whereas the extrinsic time is broadly used without notice, we find out in the following section that using it has a high impact on the measurement of statistical properties of evolving net-works. We will see that using the intrinsic time avoids biases and allows us to reveal network dynamics. In the remainder of the paper, the unit of intrinsic time is the appearance of a link, because our dataset consists in streams of observed links.
Empirical Impact
We conducted our experiment on the dataset described in Sec-tion 2 for various network metrics. We report the results re-lated to the evolution of the number of nodes, because they are representative of the impact of both time concepts. We indeed obtain similar results for the following metrics, which are classical properties of networks: the evolution of the num-ber of distinct links2, the number of connected components3,
2
The number of links is the window width, thus it is constant.
3
Let C(G) be a connected component of G(V, E) (where V is the set of nodes and E is the set of links): it is a connected sub-graph of G, i.e. for each pair of nodes (u, v) ∈ C(G), a path exists between u and v. The number of connected components is therefore |{C ∈ C(G)}|.
the average degree4and the maximum degree5.
In the Github dataset, the total number of nodes is the sum of the number of users and the number of repositories. The temporal evolution of this statistical property when consider-ing extrinsic time reveals a daily and weekly pattern. On the contrary, the overall number of nodes is very stable when in-trinsic timeis considered, which confirms that different types of dynamics are observed according to the time unit. The events corresponding to peaks may clearly be extracted from the overall trend: this shows that the graph has normal dy-namics in the statistical sense (i.e. the mean value is a rele-vant indicator for the description of the distribution of values) and that statistical anomalies (i.e. values which deviate sig-nificantly from the mean) may be identified. Although some events also seem to appear in the curve obtained with extrinsic time, their characterizations are in practice much more diffi-cult. Intrinsic time therefore seems to be more relevant to perform dynamic measures.
Figure 5 represents the evolution of the number of nodes over time, where the size of the sliding window is ten minutes on the Github dataset. The plot displays a daily fluctuation of the number of nodes. We thus observe more nodes during the day than during the night. The plot also displays a weekly fluc-tuation. We thus observe more nodes during the week than during the weekend. Figure 6 represents the same property, but the width of the sliding window is 10,000 appearing links, on the Github dataset. This plot does not display such fluctu-ations. On the contrary, we observe that the number of nodes is globally stable with some variations and spikes.
We obtain similar results using various widths, which we do not present here due to space constraints. Thus while we study the same property, the choice of the concept of time has a high impact on the resulting curves. We therefore show that so-called observed results are bound to an underlying con-cept of time. Using the intrinsic time of the network instead of the traditional extrinsic time, we reveal a totally different dynamics of the total number of nodes, which is a trivial erty. We also observed different dynamics for the other prop-erties that we have studied. This study is hence of primary importance in metrology. Our results support the hypothesis that the intrinsic dynamics of the network is not captured by measures which use an extrinsic time unit. An extrinsic time unit seems indeed more likely to capture the dynamics of ex-ogenous activities on the network (i.e. which come from the outside), like the day-night and weekly patterns.
Discussion
The number of nodes in the Github network is very stable in the case of intrinsic time, which is also the case for other properties like the number of distinct links, the number of connected components, the average degree and the maximum degree. But in the case of extrinsic time, the day-night and weekly patterns reveal the dynamics of users activities on the
4
Let d(u) be the degree of the node u, i.e. its number of neighbors. The average degree of the graph G(V, E) is 2 × |E|/|V |.
5Let d(u) be the degree of the node u. The maximum degree of the
graph G(V, E) is the maximum number of neighbors of nodes in the graph, i.e. max(D), D = {d(u), ∀u ∈ V }.
network. Hence one can see the network as an artifact which is able to capture and reveal phenomena that happen outside of it.
Based on these observations, our intuition is as follows: one should use an intrinsic time unit to capture an endogenous phenomenon of the network (i.e. which come from inside); one should use an extrinsic time unit to capture an exogenous phenomenon of the network (i.e. which come from outside). Further studies with other datasets are however necessary to draw a firm conclusion.
CONCLUSION
We proposed an innovative concept of time in networks, based on the changes observed in the network space. Using a novel time unit, we observed a new kind of dynamics which is not captured by traditional time units. We demonstrated the practical interest of our approach with the study of the dynamics of the Github social platform. This concept may be the missing step towards the characterization of intrinsic Web dynamics, and calls for the design of novel methodologies of measurement and analysis.
REFERENCES
1. Aynaud, T., and Guillaume, J.-L. Multi-step community detection and hierarchical time segmentation in evolving networks.
2. de la Convention du M`etre, O. I. The international system of units (SI). Tech. Rep. 8, Bureau International des Poids et Mesures, 2006.
3. Diminescu, D., Matthieu, R., Mehdi, B., and Jacomy, M. Digital diasporas atlas exploration and cartography of diasporas in digital networks (2011).
4. Dodge, M., and Kitchin, R. The Atlas of Cyberspace. Addison-Wesley, 2001.
5. Kant, I. Kritik der reinen Vernunft. 1781.
6. Meiss, M. R., Menczer, F., Fortunato, S., Flammin, A., and Vespignan, A. Ranking web sites with real user traffic. In Proc. ACM International Conference on Advances in Social Networks Analysis and Mining (WSDM’08), ACM (2008).
7. Newton, I. PhilosophiæNaturalis Principia Mathematica. 1687.
8. Panisson, A., Barrat, A., Cattuto, C., den Broeck, W. V., Ruffo, G., and Schifanella, R. On the dynamics of human proximity for data diffusion in ad-hoc networks. Ad Hoc Networks(2011).
9. Takhteyev, Y., and Hilts, A. Investigating the geography of open source software through github, 2010.
10. Ugander, J., Karrer, B., Backstrom, L., and Marlow, C. The anatomy of the facebook social graph, Nov. 2011. 11. Whitbeck, J., de Amorim, M. D., Conan, V., and