Research Article
Effects of size and origin of natural dissolved organic
matter compounds on the redox cycling of iron in sunlit
surface waters
Laurence Meunier, Hansulrich Laubscher, Stephan J. Hug and Barbara Sulzberger*
Swiss Federal Institute of Aquatic Science and Technology (Eawag), Ueberlandstrasse 133, CH-8600 Duebendorf, Switzerland
Received: 7 December 2004; revised manuscript accepted: 18 April 2005
Abstract. The effects of size and origin of natural
dis-solved organic matter compounds (DOM) on the redox cycling of iron were investigated in water samples from a marine system (Strait of Gibraltar), from a freshwater sys-tem (Lake of Murten, i.e., Murtensee, Switzerland), and from a “river-to-ocean” system (Rivers Scheldt and Rhine and corresponding estuaries). In the irradiated seawater samples, Fe(II) steady-state concentrations ([Fe(II)]ss), both as percentage of total dissolved iron and normalized to 1 mg C L–1, were higher in the low-molecular-weight (LMW) than in the high-molecular-weight (HMW) DOM fractions, despite higher net rates of H2O2 formation in the HMW DOM fractions. Also in the samples from Murtensee, [Fe(II)]ss, both as percentage of total dissolved iron and normalized to the decadic absorption coefficient at 350 nm (a350, unit m–1), were higher in the LMW than in the HMW DOM fractions. Unlike in the seawater
sam-ples, however, net rates of H2O2production, normalized to a350, were higher in the LMW DOM fractions, as com-pared to the HMW DOM fractions, indicating a higher efficiency of O2• –formation with these LMW compounds from Murtensee. Based on the simulation of experimen-tal data with mathematical kinetic modeling, we hypoth-esize that Fe(II) is formed through photolysis of Fe(III) complexes in the LMW DOM fractions from the Strait of Gibraltar and from Murtensee and that Fe(II) is stabi-lized by a ligand in the water samples from Murtensee. In the irradiated HMW DOM fractions from the “river-to-ocean” system, [Fe(II)]ss, normalized to a350, were gener-ally higher in the water samples from the Rivers Scheldt and Rhine than in the water samples from their estuaries, suggesting that terrestrially derived DOM has a higher photochemical reactivity towards Fe(II) formation than autochthonous DOM.
Key words. Iron photochemistry; DOM photochemistry; iron(III) reduction; iron(II) stabilization; iron(II) oxidation;
kinetic modeling.
Introduction
Iron is an essential micronutrient for almost all organ-isms. In cells iron can exist in more than one oxidation state, and catalysis of redox reactions and electron trans-port are two major functions of iron containing enzymes.
Iron is present in the active centers of cytochromes and iron-sulfur proteins, e.g., ferrodoxin, which are important components of the photosynthetic and respiratory elec-tron transport chain (e.g., Butler, 1998; Falkowski, 1997; Sunda, 1991). Iron has been proposed to co-limit phyto-plankton growth in several marine environments (e.g., Mills et al., 2004; Morel and Price, 2003; Schulz et al., 2004).
The biological availability of iron depends on its spe-ciation and on the uptake mechanism by organisms.
An-*Corresponding author phone: +41 1 823 5459; fax: +41 1 823 5028; e-mail: [email protected] Published Online First: August 29, 2005 DOI 10.1007/s00027-005-0779-0 © Eawag, Dübendorf, 2005
derson and Morel (1982) have proposed a carrier-medi-ated transport model of iron uptake by eukariotic marine algae. According to this model, the concentration of inor-ganic, dissolved Fe(III) species (including the hydrated and hydrolyzed ions) determines the upper limit of bio-available iron. Most (>99 %) of the dissolved ferric iron is present as organic iron complexes in marine surface waters (e.g., Powell and Donat, 2001; Rue and Bruland, 1995; Rue and Bruland, 1997; van den Berg, 1995; Wu and Luther, 1995) and probably also in rivers and lakes. In sunlit surface waters, inorganic Fe(III) species are formed through light-induced redox cycling of iron (e.g., Powell and Wilson-Finelli, 2003).
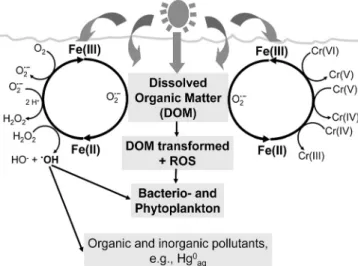
Iron(II) is a key intermediate species, regarding both iron bioavailability and the roles of Fe(II) as reducing agent. For example, Fe(II) has been shown to act as the electron donor in Cr(VI) reduction (Gaberell et al., 2003; Hug et al., 1997; Kieber and Helz, 1992) (see Fig. 1). Fur-thermore, Fe(II) catalyzes the reductive dissolution of Fe(III)-(hydr)oxides (Siffert and Sulzberger, 1991; Suter et al., 1988) and acts as an electron donor in the reductive dissolution of MnO2(Villinski et al., 2003). As a result of Fe(II)-promoted dissolution of minerals, adsorbed or-ganic and inoror-ganic compounds, e.g., oror-ganic pollutants and phosphate, are remobilized. Oxidation of Fe(II) by O2 yields the reactive oxygen species (ROS) O2• –, H2O2, and HO•, where the latter is formed in the Fenton reaction (Fe(II) + H2O2Æ Fe(III) + HO•+ OH–) (see Fig. 1). The Fenton reaction can be an important source of HO• in iron-rich, sunlit surface waters (Southworth and Voelker, 2003; White et al., 2003), and HO•is the most reactive oxygen species (Blough and Zepp, 1995), reacting effi-ciently with organic and inorganic pollutants and with cell components of aquatic organisms (see Fig. 1).
Background
Roles of natural organic compounds in the light-induced reduction of dissolved Fe(III). In sunlit surface waters,
formation of Fe(II) can proceed through the following abiotic pathways: (i) Photolysis of Fe(III) complexes (e.g., Barbeau et al., 2001; Barbeau et al., 2003; Barbeau et al., 2002; Faust and Zepp, 1993; Gao and Zepp, 1998; Kuma et al., 1992; Voelker et al., 1997), (ii) reduction of Fe(III) by O2• –(e.g., Emmenegger et al., 2001; Miller et al., 1995; Rose and Waite, 2003a; Rose and Waite, 2005; Voelker and Sedlak, 1995), and (iii) thermal reduction of Fe(III) by natural organic compounds (e.g., Voelker et al., 1997; Voelker and Sulzberger, 1996). In addition, Fe(III) also may be reduced at the surface of algal cell, which is a strategy of some algae to utilize iron bound to organic ligands (e.g., Hutchins et al., 1999; Jones et al., 1987; Mal-donado and Price, 1999; MalMal-donado and Price, 2001; Soria-Dengg and Horstmann, 1995; Weger, 1999; Weger et al., 2002). Regarding the bioavailability of these organic Fe(III) complexes to aquatic microorganisms, Hutchins et al. (1999) suggested that the competition between pro-karyotes and eupro-karyotes for organically-bound iron may depend on the chemical nature of iron complexes, where iron bound to a variety of siderophores was relatively more available to cyanobacteria than to eukaryotes. In pathways (i)–(iii), natural organic compounds act as elec-tron donors. Hitherto, we are lacking a clear picture of the relative importance of above pathways in the formation of Fe(II) in sunlit marine and freshwater systems.
Photolysis of Fe(III) complexes (pathway (i)) may in-volve siderophores (Barbeau et al., 2001; Barbeau et al., 2003; Barbeau et al., 2002) or other natural Fe(III) ligands (Faust and Zepp, 1993; Gao and Zepp, 1998; Kuma et al., 1992; Voelker et al., 1997). Siderophores are low-molecu-lar-weight organic ligands (0.5–1.5 kDa) with a high affin-ity and specificaffin-ity for iron. Under iron-limiting conditions, siderophores are excreted by cyano- and heterotrophic bac-teria (e.g., Haygood et al., 1993; Reid and Butler, 1991; Tortell et al., 1999; Wilhelm and Trick, 1994). The stabil-ity constants of Fe(III)-siderophore complexes are in the range of logK = 20–50 (Albrecht-Gary and Crumbliss, 1998; Witter et al., 2000). Photolysis of Fe(III) siderophore complexes has been demonstrated with the siderophores petrobactin and aerobactin (Barbeau et al., 2003; Barbeau et al., 2002; Borer et al., 2005), and various aquachelins (Barbeau et al., 2001). The photoreactivity of these Fe(III)-siderophore complexes is imparted by the
a-hydroxycar-boxylate functional group, which decara-hydroxycar-boxylates follow-ing ligand-to-metal charge-transfer transition. Accordfollow-ing to recent studies of the photochemical reactivity of sidero-phores based on characteristic iron(III)-binding groups, siderophores containing only hydroxamate groups such as DFOB form photostable complexes with Fe(III) (Barbeau et al., 2003; Borer et al., 2005).
Figure 1. Schematic representation of environmentally important
processes that are linked to the light-induced redox cycling of iron in sunlit surface waters (see text). ROS stands for Reactive Oxygen Species, e.g., HO•, O
2 • –, and H
Roles of natural organic compounds in the oxidation of Fe(II). Natural organic compounds also may greatly affect
the kinetics of Fe(II) oxidation. Several investigators ob-served an acceleration of the Fe(II) oxidation by O2in the presence of natural organic compounds such as fulvic acid (Liang et al., 1993; Pullin and Cabaniss, 2003; Rose and Waite, 2002) or the siderophore DFOB (Welch et al., 2002). Santana-Casiano and coworkers (2004) studied the oxidation of Fe(II) in NaCl-HCO3–and seawater so-lutions in the presence of phthalate and salicylate ions. Phthalate decreased the Fe(II) oxidation rate, while sali-cylate increased it. Emmenegger and coworkers (1998) assessed the apparent rate constant, kapp, of Fe(II) oxida-tion as a funcoxida-tion of pH in unfiltered lake water samples, to which Fe(II) was added to give an initial Fe(II) concen-tration of 30 nM. Above pH 7.4, kappwas consistent with the rate law determined in pure carbonate systems. How-ever, below this pH value, kapp was independent of pH. These authors explain this phenomenon in terms of accel-eration of Fe(II) oxidation by ligands (organic, colloidal, or surface ligands) below pH 7.4. Also the Fenton reaction is greatly affected by natural organic compounds. Sedlak and Hoigné (1993) and Voelker and Sulzberger (1996) have shown that H2O2reacts much faster with Fe(II)-ox-alate and Fe(II)-fulvate complexes than with inorganic Fe(II). Voelker and Sulzberger (1996) also found an en-hancing effect of fulvic acid on the Fenton reaction through the following reaction sequence: (i) scavenging of the HO• radical formed in the Fenton reaction by fulvic acid, yielding an organic radical, (ii) reaction of this or-ganic radical with O2to form HO2•/O2• –, (iii) regeneration of H2O2by reaction of HO2/O2• • –with Fe(II).
Natural organic compounds also may result in a de-crease of Fe(II) oxidation rates. Theis and Singer (1974) and Miles and Brezonik (1981) reported that a variety of model Fe(II)-binding ligands and humic acids decreased the rate of Fe(II) oxidation by O2. When assessing the Fe(II) oxidation kinetics, one has to be aware that net rates are determined, which include the rate of Fe(II) oxidation and the rate of re-reduction of Fe(III). Ferric iron may be reduced thermally, e.g., by fulvic acid (Voelker and Sulz-berger, 1996). Furthermore, HO2/O2• • –formed in the oxida-tion of Fe(II) by O2acts as an electron donor of Fe(III). Finally, Fe(II) may be stabilized by organic ligands (Suzuki et al., 1992). In most studies regarding Fe(II) oxidation kinetics, Fe(II) is added to synthetic or natural water sam-ples (e.g., Emmenegger et al., 1998). As a result, some effects of natural organic compounds, e.g., stabilization of Fe(II), may not be apparent because of much lower concentrations of these natural organic ligands, as com-pared to added Fe(II). The effects of the source and con-centration of natural organic matter (NOM) on the Fe(II) oxidation kinetics was investigated by Rose and Waite (2003b). These authors reported that increasing the con-centration of NOM enhanced the degree of acceleration
or retardation of Fe(II) oxidation, depending on the source of NOM.
Objectives
As discussed above, Fe(II) is a key intermediate species in sunlit surface waters, regarding both iron bioavailability and its role as an electron donor in many environmentally relevant processes. Therefore, it is important to elucidate the roles of natural organic compounds (in the following abbreviated as DOM, Dissolved Organic Matter) in the formation and consumption of Fe(II). As will be demon-strated, both the size and the origin of DOM affect to a great extent Fe(II) steady-state concentrations in sunlit surface waters. The objectives of this study were (i) to assess the effect of the size of dissolved organic matter compounds on Fe(II) steady-state concentrations, (ii) to test hypotheses on the pathway of light-induced Fe(III) reduction and the kinetics of Fe(II) oxidation by simulat-ing experimental data (measured Fe(II) and H2O2 concen-trations during irradiation and after the light-source was turned off) with mathematical kinetic modeling, and (iii) to assess possible effects of the DOM origin on the light-induced redox cycling of iron.
Materials and methods
Study sites and sample collection
Seawater was sampled at different sites in the Strait of Gibraltar (sites P1–P5, Fig. 2A and Table 1) during a cruise on the Dutch research vessel Pelagia (Royal NIOZ) between May 26 and June 4, 2001. At the sampling loca-tion 35° 6¢N, 5° 5¢W, Mediterranean Sea water is covered
by water from the Atlantic Ocean, and hence the water sample from this site, collected at 5 m depth (P4), was an Atlantic seawater sample, whereas all the other water samples were Mediterranean seawater samples. Water samples from different depths were collected using a CTD rosette equipped with Go-Flow bottles, which were coated with a thin film of Teflon. Immediately after col-lection, the water samples were passed on board through 0.22 mm GUPP-C cassette filters (0.5 m2) mounted on a Pellicon holder (Millipore), followed by size fractiona-tion of DOM (see below). All sampling and filtrafractiona-tion de-vices were metal clean.
Freshwater samples were collected in Murtensee, a lake located in the western part of Switzerland (Fig. 2B). Its surface area is 22.8 km2, and its average depth is 23.3 m, with a maximal depth of 45.5 m. Intensive agri-cultural activities cause eutrophic conditions in this lake. On October 24, 2002, the dissolved organic carbon con-centration (DOC) was ~290 mM (Table 1). Water samples
were collected on October 24, 2002, offshore of the city of Murten and at the location where the lake was deepest,
Figure 2. Map of Western Europe with the study areas. Water samples were collected at different locations and depths in the Strait of
both at the surface and at 6 m depth (sites M1–M4, see Table 1). The sampling was performed by use of Go-Flow bottles. The water samples were brought back to the laboratory at Eawag in Duebendorf, passed through 0.45 mm cellulose nitrate filters (Sartorius), followed by
DOM size fractionation (see below) within 48 hours. All sampling and filtration devices were metal clean.
Water samples with different salinity were collected during a cruise with the Dutch research vessel Navicula (Royal NIOZ) between April 2 and April 12, 2001 in the River Scheldt (site N1), the River Waal (site N2), outside the River Rhine delta (sites N3 and N4), and outside the Eastern Scheldt esturary (site N5) (Fig. 2C and Table 1). The River Scheldt originates in the North of France and flows across Belgium and The Netherlands into the North Sea forming the Western and Eastern Scheldt estuaries (Fig. 2C). The River Scheldt is one of the most contami-nated rivers in Europe (Somville and Depauw, 1982) with an extremely high DOC content (Table 1). Indeed, the River Scheldt catchment presently receives sewage dis-charge with only partial treatment from cities such as Lille, Antwerp, Brussels, and Ghent. The River Waal is one branch of the River Rhine, which originates in the Swiss Alps and which splits into two branches (Lek and
Waal) on its flow through The Netherlands. The Rivers Lek, Waal, and Maas form a huge river delta in The Nether-lands (Fig. 2C). Water was sampled with a fish (a Teflon sampling bag attached to a lead weight, looking like a fish), passed through 0.2 mm polycarbonate filters
(Nu-cleopore) immediately after sampling, followed by DOM size fractionation on board (see below). All sampling and filtration devices were metal clean.
Materials
NaCl (suprapure quality), HCl (30 %, suprapure quality), HNO3(65 %, suprapure quality), NH3(25 %, suprapure quality), hydrogen peroxide (30 %, suprapure quality), potassium bromate (pro analysis quality), 3-[4-(2-hy-droxyethyl)-1-piperazinyl] propanesulfonic acid (HEPPS) (purity, 99 %), 1-nitroso-2-naphtol (pro analysis quality), methanol (pro analysis quality) were purchased from Merck, Germany. 5-amino-2,3-dihydrophtalazine-1,4-dion (luminol), p-hydroxyphenylacetic acid (puriss p.a. grade), ammonium ferrous sulfate hexahydrate (puriss p.a. grade) ferric chloride hexahydrate (puriss p.a. grade) were pro-vided by Fluka, Switzerland. Peroxidase, 10,000 U, grade II, from horseradish (HRP) was from Roche Diagnostics Gmbh, Germany.
All solutions were prepared with MQ-UV water (Mil-lipore). Water samples and reagents were prepared and stored in polypropylene bottles. These bottles as well as the Pyrex glass vessels, used in the photochemical ex-periments (see below), were cleaned according to the following protocol: first they were soaked over night in a detergent solution, then rinsed with MQ-UV water, soaked for at least 3 days in 0.1 M HCl and thereafter for a least 3 days in 0.1 M HNO3. Finally they were rinsed with MQ-UV water, dried and stored in plastic bags until use. Glassware for DOC measurement was soaked for at least 3 days in 0.1 M HCl, rinsed with MQ-UV water, and muffled 5 h at temperatures >500 °C to eliminate all organic substances.
DOM fractionation
DOM in water samples from sites P1–P5 and M1–M4 was size fractionated employing a Pellicon tangential flow ultrafiltration system (Millipore) with a 0.5 m2 PLAC cassette filter (Millipore) (1 kDa nominal weight cutoff) and following the protocol by Benner et al. (1997). We operationally define the fraction with DOM < 1 kDa as low-molecular-weight (LMW) DOM in all water sam-ples, and the fraction with 1 kDa < DOM < 0.22 mm and
1 kDa < DOM < 0.45 mm as high-molecular-weight
(HMW) DOM in water samples from sites P1–P5 and sites M1–M4, respectively. The concentrates and perme-ates were deep-frozen immediately after ultrafiltration until use.
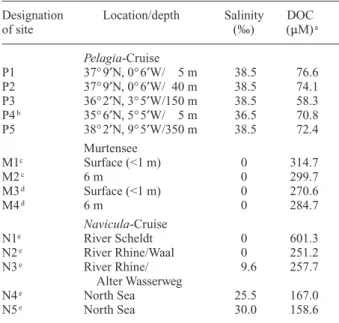
Table 1. Salinity and concentration of dissolved organic carbon
(DOC) at the sites where water samples were collected during the
Pelagia-Cruise (May 2001), in Murtensee (October 2002), and
dur-ing the Navicula-Cruise (April 2001).
Designation Location/depth Salinity DOC
of site (‰) (mM)a Pelagia-Cruise P1 37° 9¢N, 0° 6¢W/ 5 m 38.5 76.6 P2 37° 9¢N, 0° 6¢W/ 40 m 38.5 74.1 P3 36° 2¢N, 3° 5¢W/150 m 38.5 58.3 P4b 35° 6¢N, 5° 5¢W/ 5 m 36.5 70.8 P5 38° 2¢N, 9° 5¢W/350 m 38.5 72.4 Murtensee M1c Surface (<1 m) 0 314.7 M2c 6 m 0 299.7 M3d Surface (<1 m) 0 270.6 M4d 6 m 0 284.7 Navicula-Cruise N1e River Scheldt 0 601.3 N2e River Rhine/Waal 0 251.2 N3e River Rhine/ 9.6 257.7 Alter Wasserweg N4e North Sea 25.5 167.0 N5e North Sea 30.0 158.6
a In filtered water samples (<0.22 mm for samples from site P1–P5,
and <0.45 mm for samples from M1–M4 and N1–N5).
bAt this site, Mediterranean Sea water is covered by water from the
Atlantic Ocean.
c Water samples were taken in the middle of Murtensee. dWater samples were taken offshore of the city of Murten. e For the geographical location of the sites N1–N5, see Figure 2C.
DOM in water samples from sites N1–N5 was size fractionated using an Amicon DC-10 or an Amicon Pro-flux M 30 system with two spiral-wound polysulfone filter cartridges (S10N1, 1 kDa nominal weight cutoff). To gain a powdery product, the water content of the concen-trates was reduced by rotary evaporation, and the samples were dried in a Savant SVC200 SpeedVac concentrator. The powders obtained were stored in precombusted glass vials until further use.
Determination of DOC concentrations
For the determination of DOC concentrations in the 0.22
mm and 0.45 mm filtered water samples from sites P1–P5
and M1–M4, respectively, and in corresponding concen-trates and permeates, 20 ml of each solution were placed into acid-rinsed, precombusted 40-ml EPA glass vials, immediately after filtration and ultrafiltration, sealed with Teflon-lined caps and stored frozen until analysis. For the determination of DOC concentrations in the HMW DOM fraction of waters samples from sites N1–N5, part of each powder was dissolved in MQ-UV water, considering the concentration factor. DOC concentrations were deter-mined by high-temperature catalytic oxidation with a Shimadzu 5050A analyzer (Benner et al., 1997; Benner and Strom, 1993). For the water samples from sites P1– P5 and M1- M4, a carbon mass balance was established to determine whether carbon was lost or gained during size fractionation. Mass balance calculations yielded re-coveries of 120–155 % for the water samples from sites P1–P5 and 87–120 % for the water samples from sites M1–M4. This percentage of DOC recovered after ultrafil-tration was calculated as follows: % DOC recovered = 100
¥ (DOCconcentrate+ DOCpermeate) ¥ (DOC<0.22/0.45 mm)–1, where
DOC stands for the DOC concentration, DOCconcentratefor DOC in the HMW DOM fraction, corrected by the according concentration factor, DOCpermeate for DOC in the LMW DOM fraction, and DOC<0.22/0.45 mmfor DOC in
the DOM fraction that passed a 0.22 mm or 0.45 mm
fil-ter (used for wafil-ter samples from sites P1–P5 or M1–M4, respectively). The fact that more than 100 % of DOC was recovered by ultrafiltration was likely due to contamina-tion from the ultrafiltracontamina-tion membrane, which consisted of regenerated cellulose. Although this membrane was thoroughly cleaned according to the protocol by Benner et al. (1997) before ultrafiltration of the various water samples, it was not possible to avoid some carbon leach-ing, as has been observed by other investigators using the same ultrafiltration membrane (e.g., Kaiser and Sulz-berger, 2004).
Determination of total dissolved iron concentrations
For the determination of total dissolved iron concentra-tions in the HMW and LMW DOM fracconcentra-tions,
concen-trates and permeates were collected in metal clean 50-ml (samples from sites P1–P5) and 10-ml (samples from sites M1–M4) PP tubes (Greiner), immediately following ultrafiltration. After acidification to pH ~2, the samples were kept deep-frozen until analysis. To determine total dissolved iron concentrations in the HMW DOM frac-tions of waters samples from sites N1–N5, part of each powder was dissolved in MQ-UV water, considering the concentration factor.
Total dissolved iron concentrations in the HMW and LMW DOM fractions of water samples from sites P1–P5 were measured employing catalytic cathodic stripping voltammetry (674 VA Stand and 646 VA processor, Metrohm), following the protocol by Aldrich and van den Berg (1998). 1-nitroso-2-naphtol was used to form a com-plex with Fe(III) that adsorbs on a static mercury drop electrode, and BrO3–was used to oxidize Fe(II), eventu-ally present in the water samples. Measurements were performed at pH 7.7, using HEPPS buffer. Prior to mea-surements, samples were irradiated for 24 h with a Hg lamp (La Jolla Scientific Co.) at pH 2 to eliminate dis-solved organic matter. Blanks (MQ-UV water) were treated in the same way as the samples. The detection limit of this analytical method was 0.5 nM.
Total dissolved iron concentrations in the HMW and LMW DOM fractions of water samples from sites M1– M4 and N1–N5 were detected using a Perkin-Elmer 5100 GF-AAS with a transverse heated graphite tube atomizer (THGA). Dissolved iron in the LMW DOM fractions was pre-concentrated three times by injecting 50 ml of the samples and drying for 50 s at 130 °C. The detection limit was 2 nM for the pre-concentrated samples.
Other methods
pH measurements were made by use of an Orion Ross electrode and an Orion meter calibrated with NBS buffers. Buffers and samples were kept at 25 °C unless stated oth-erwise. Alkalinity was determined by automated Gran-titration with use of a Mettler DL 70 ES titrator. UV/VIS spectra were recorded in a quartz cell of 5 cm optical path length using a Varian Cary 1E UV/VIS spectrophotome-ter.
Photochemical experiments
For the photochemical experiments, the concentrates of the water samples from sites P1–P5 and M1–M4 were diluted with MQ-UV water by the concentration factor, and part of the HMW DOM powders gained from the water samples from sites N1–N5 were dissolved in MQ-UV water to yield a DOC concentration of approximately 2 mg L–1. A pH of 8.2 was established by bubbling a mixture of CO2, N2, and 20.9 % O2through the solutions. 300 ml of each solution were filled into a water-jacketed
reactor with an optical Pyrex bottom and irradiated with a 1000-W Xe lamp (OSRAM), contained in a water-cooled housing (PTI, 02-A50001), and simulating solar radiation. The light was focused by two Pyrex lenses (50 % cutoff at 335 nm) and a mirror onto the bottom of the reaction vessel. A more detailed description of the ex-perimental setup is given in Siffert and Sulzberger (1991). We measured the average incident light intensity hitting the bottom of the reaction vessel through a narrowband filter (UV1, lmax355 nm), using ferrioxalate actinometry (Hatchard and Parker, 1956). The total light intensity hit-ting the vessel, when the light was not filtered by the nar-rowband filter, was calculated from the photon flux of the filtered light, the transmission spectrum of the filters and the bottom of the vessel, and the spectrum of the unfil-tered light. The incident light intensity was approximately 0.5, 1.0, and 1.2 kW m–2 in the photochemical experi-ments with the water samples from sites P1–P5, M1–M4, and N1–N5, respectively. In all photochemical experi-ments the solutions were air-saturated and continuously stirred, and the temperature (20 °C) and pH (8.2–8.3) were kept constant.
Iron(II) and H2O2 concentrations were measured dur-ing irradiation and after the light source was turned off. For the determination of Fe(II) concentrations, we employed a flow injection analysis system with luminol-based chemi-luminescence detection (FeLume) (Emmenegger et al., 1998; Emmenegger et al., 2001; King et al., 1995). An alkaline luminol solution is mixed with the water sample containing Fe(II) in front of a photomultiplier. At pH 9.8, Fe(II) is oxidized by molecular oxygen on a millisecond timescale, catalyzing the oxidation of luminol resulting in its electronic excitation that deactivates by producing blue chemiluminescence light. Calibration curves were established after each photochemical experiment in the identical water matrix. Iron(II) was added from an acid (pH 2) stock solution containing 1 mM Fe(II). This stock
solution was prepared daily from another stock solution containing 100 mM Fe(II) at pH 2, which was prepared
twice a month. Both stock solutions were kept at 4 °C. The detection limit was usually 0.2 nM Fe(II).
For measuring H2O2 concentrations, we used the method by Miller and Kester (1988), modified by Em-menegger et al. (2001), utilizing a Perkin-Elmer LS-3 flu-orescence spectrophotometer. We checked that the poten-tial light-induced production of organic peroxides did not influence the H2O2fluorescence measurements (data not shown).
Kinetic modeling
For the mathematical simulation of the time courses of Fe(II) and H2O2 during irradiation and after the light source was turned off, we used the program ACUCHEM (Braun et al., 1988). This program can calculate the
con-centrations of reactants versus time in a complex chemi-cal system by finding a numerichemi-cal solution to the system of nonlinear differential equations defined by the kinetics problem. Best fits of kinetic constants, which were not accessible experimentally or whose values could not be taken from the literature, were obtained by combining ACUCHEM with a Matlab program (The Math Works, Inc., Natick, MA 01760). The unknown rate constants were varied until the sum of squared residuals between the measured data points and the model was minimized. To give Fe(II) and H2O2the same statistical weight, their maximum concentrations were normalized to 1 for the fitting. The optimization routine was the Nelder-Mead simplex (direct search) method of Matlab.
Results and discussion
Effect of the size of natural organic compounds on Fe(II) steady-state concentrations
Considerably higher percentages of Fe(II) steady-state concentrations ([Fe(II)]ss) from total dissolved iron (water samples filtered through 0.22 mm filters) were found
upon irradiation of low-molecular-weight (LMW) DOM, as compared to high-molecular-weight (HMW) DOM in water samples from the Strait of Gibraltar (Fig. 3A). Hence the total dissolved iron concentration is not the major factor determining ([Fe(II)]ssin these DOM frac-tions. This phenomenon was also observed by Gaberell and coworkers (2003), who studied the role of dissolved organic matter composition on the photoreduction of Cr(VI) to Cr(III) in the presence of iron. Also [Fe(II)]ss, normalized to 1 mg C L–1, were higher in the LMW than in the HMW DOM fractions (Fig. 3B). Regarding H2O2 formation, the net rate, normalized to 1 mg C L–1 was higher in the HMW fractions than in the LMW fractions. The fact that higher [Fe(II)]ssoccurred with LMW DOM, as compared to HMW DOM, despite higher net rates of H2O2formation with HMW DOM lead us to the follow-ing hypothesis: The main pathway of Fe(III) reduction in these water samples is photolysis of Fe(III) complexes (and not reduction of Fe(III) by O2• –) and occurs more readily if Fe(III) is bound to LMW organic ligands, as compared to HMW ligands. This hypothesis is tested ex-perimentally in ongoing studies.
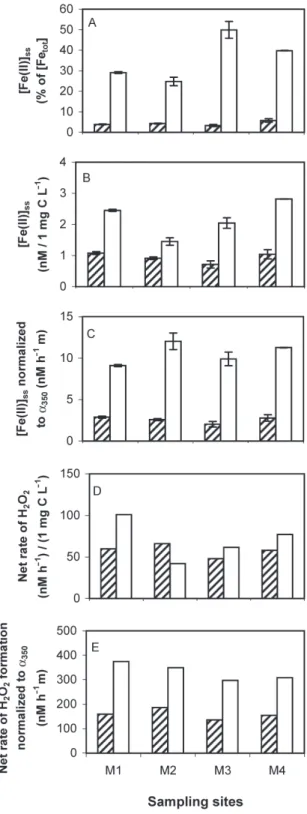
Also in the freshwater samples from Murtensee, both the percentage of [Fe(II)]ssfrom total dissolved iron (wa-ter samples fil(wa-tered through 0.45 mm filters) and [Fe(II)]ss, normalized to 1 mg C L–1, were higher in the LMW DOM fractions than in the HMW DOM fractions (Figs. 4A and B), and approximately five times higher than in the seawater LMW DOM fractions, if normalized to equal light intensities (note that the light intensity of the solar simulator was approximately two times higher in the experiments with the freshwater samples, see “Materials
and methods”). If [Fe(II)]ssis divided by the decadic ab-sorption coefficient at 350 nm (a350, unit m–1) the differ-ence between LMW and HMW DOM fractions is even more pronounced in the water samples from Murtensee (Fig. 4C). These results suggest that the efficiency of Fe(II) formation is higher with LMW DOM than with HMW DOM from Murtensee. Regarding photochemical H2O2 formation, its net rate was higher in the LMW DOM frac-tions than in the HMW DOM fracfrac-tions, particularly if divided by a350(Figs. 4D and E). [Note that the rate of H2O2formation, divided by a350, can be considered as a relative quantum yield of H2O2formation at respective wavelength.] This surprising result means that LMW DOM from Murtensee is photochemically more reactive than HMW DOM from this freshwater system. A higher photoreactivity of LMW DOM, as compared to HMW DOM, in terms of H2O2formation also was observed by Kaiser and Sulzberger (2004) with water samples from
Figure 3. Steady-state concentrations of Fe(II) as the percentage of
total dissolved iron (A) and normalized to 1 mg C L–1(B), and net
rate of H2O2formation, normalized to 1 mg C L–1(C), during
irra-diation with simulated sunlight (I0~0.5 kW m–2) of HMW DOM
(shaded bars) and LMW DOM (open bars) (pH = 8.2–8.3) from sites P1–P5. The HMW DOM fractions were diluted by the con-centration factors for the photochemical experiments (see Materials and methods section). Data represent the mean of 2–3 measure-ments; vertical bars indicate the mean deviation.
Figure 4. Steady-state concentrations of Fe(II) as percentage of
total dissolved iron (A), normalized to 1 mg C L–1(B), and
normal-ized to a350(C) during irradiation with simulated sunlight (I0~1.0
kW m–2) of HMW DOM (shaded bars) and LMW DOM (open bars)
(pH = 8.2) from sites M1–M4. The two lower panels of this figure show net rates of H2O2formation, normalized to 1 mg C L–1(D) and
to a350(E) during irradiation with simulated sunlight (I0~1.0 kW
m–2) of HMW DOM (shaded bars) and LMW DOM (open bars)
from sites M1–M4. The HMW DOM fractions were diluted by the concentration factors for the photochemical experiments (see Ma-terials and methods section). Data represent the mean of 2–3 mea-surements; vertical bars indicate the mean deviation.
the Tagliamento River (Italy). These authors also assessed the effect of light on DOM bioavailability to bacterio-plankton from the Tagliamento River and found that after the long-term growth of bacteria on irradiated DOM, the uptake was unchanged for HMW DOM, however, consid-erably lower for LMW DOM, compared with the corre-sponding non-irradiated fractions. Kaiser and Sulzberger (2004) hypothesize that as a consequence of the higher photoreactivity of LMW compounds from the Taglia-mento, these compounds are transformed into highly biorecalcitrant compounds upon irradiation. Powell and Wilson-Finelli (2003) reported that photodegradation of ligands occurred in a ligand class that was less than 1 kDa in size and ubiquitous throughout the Gulf of Mexico and hypothesized that release of siderophores may be the dominant production term for these ligands.
Kinetics of Fe(II) and H2O2formation and decay
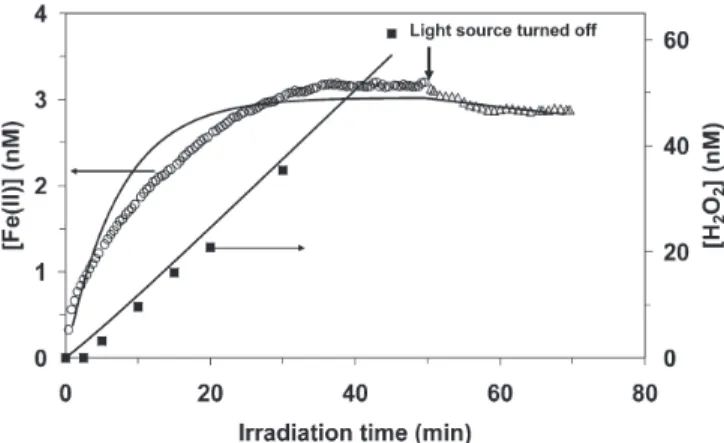
Figure 5 shows the measured concentrations of Fe(II) and H2O2during irradiation and after the light source was turned off (symbols) with the LMW DOM fraction of the water sample from site P3 (see Table 1). The Fe(II) con-centration reached steady-state after ca. 4 min of irradia-tion and decreased to zero within ca. 10 min after the light source was turned off. The H2O2concentration increased linearly and did not reach steady-state during irradiation. After the light source was turned off, the H2O2 concen-tration remained constant for hours (data not shown). This kinetic behavior of the Fe(II) and H2O2 concentra-tions was generally observed with both the LMW and HMW DOM fractions from the Strait of Gibraltar. To-tally different behaviour was observed with the LMW and HMW DOM fractions from Murtensee, e.g., with the LMW fraction of the water sample from site M4 (Fig. 6). In this case, the Fe(II) concentration reached
steady-state only after approximately 35 min, and only a slight decrease in the Fe(II) concentration was observed after the light source was turned off in the time frame of the experiment. With respect to H2O2, its concentration increased linearly without reaching steady-state during irradiation (Fig. 6).
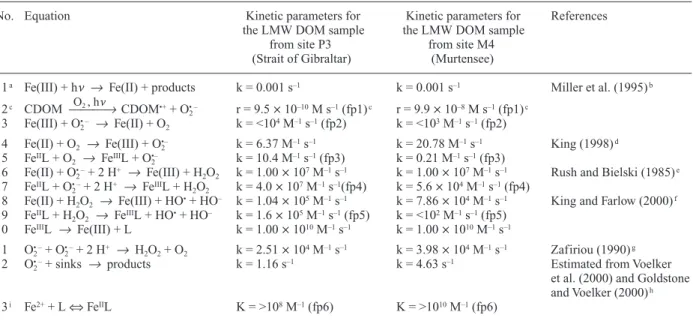
As discussed in the “Introduction”, various phenom-ena may account for a slow decay of the Fe(II) concentra-tion after irradiaconcentra-tion of water samples. Emmenegger and coworkers (2001) observed a slow decay of the Fe(II) concentration in whole water samples from the Lake of Greifen (Switzerland), although less pronounced than in the present study. Based on mathematical kinetic model-ing, these authors hypothesized that this slow decay is due to recycling of Fe(II) by O2• –. Another possibility is stabi-lization of Fe(II) by organic ligands. To evaluate this pos-sibility and to test our hypothesis that photolysis of Fe(III) complexes is the main pathway of Fe(II) formation in the LMW DOM samples from the Strait of Gibraltar and from Murtensee, we simulated the experimental data shown in Figures 5 and 6 using a kinetic model. The rate constants and rates of considered reactions, and the equi-librium constant of formation of an Fe(II) complex with the ligand L are listed in Table 2. [Note that the symbol L is used in the text and in Table 2 exclusively to denote the Fe(II)-stabilizing ligand; other ligands present in the wa-ter samples are not specified, and organic Fe(III) com-plexes are designed as “Fe(III)”, see also below]. The val-ues denoted as “fp” are the optimized rate constants that provided best fits (see also Fig. 7), the other values were taken from the literature or were estimated based on liter-ature values.
The rate constant of photolysis of Fe(III) complexes (reaction 1) was assumed to be in the range suggested by Miller and coworkers (1995). The rate of photochemical production of O2• – involving CDOM (reaction 2) is not known and was a fitting parameter in our model.
Further-Figure 5. Experimental data (symbols) and modeling results (solid
lines) of the concentrations of Fe(II) and H2O2during and after
irradiation with simulated sunlight (I0~0.5 kW m–2) of LMW DOM
(pH = 8.3) from site P3.
Figure 6. Experimental data (symbols) and modeling results (solid
lines) of the concentrations of Fe(II) and H2O2during and after
irradiation with simulated sunlight (I0~1.0 kW m–2) of LMW DOM
more, we assumed that >99 % of dissolved Fe(III) was present as organic Fe(III) complexes in the LMW DOM samples from sites P3 and M4. The rate constant of reac-tion of O2• –with organic Fe(III) species (reaction 3) also was a fitting parameter. Regarding the oxidation of Fe(II) by O2and H2O2(reactions 4 and 8, respectively), we esti-mated these rate constants for the pH and the alkalinity of the LMW DOM samples from sites P3 and M4, based on the values given by King (1998) and King and Farlow (2000), respectively, for inorganic Fe(II) species.
We introduced an Fe(II) stabilizing ligand L in our model and unknown rate constants for the oxidation of FeIIL by O2, O2• –, and H2O2(reactions 5, 7, and 9). We as-sumed that FeIIIL undergoes fast ligand exchange with or-ganic ligands present in the P3 and M4 LMW DOM sam-ples that form more stable complexes with Fe(III) than
does L (reaction 10, note that in our model, L is a Fe(II) stabilizing ligand.) Regarding sinks of O2• –other than re-action with iron (rere-actions 3, 6, and 7), we included reac-tions of O2• –with dissolved copper (Voelker et al., 2000; Zafiriou et al., 1998) and with colored dissolved organic matter (CDOM) (Goldstone and Voelker, 2000) (summa-rized in reaction 12). To obtain an estimate for k12, we assumed that the major part of dissolved copper was pre-sent as organic Cu(II) complexes in these water samples (e.g., Bruland et al., 2000; van den Berg, 1984; Voelker and Kogut, 2001). The overall rate constant, k12, of reac-tion of O2• –with dissolved, organic Cu and CDOM was es-timated based on the studies by Voelker et al. (2000) and Goldstone and Voelker (2000), where k12= kcat[Cutot] + kother(Voelker et al., 2000). We assumed a value of 5.5 ¥
108M–1s–1for the rate constant of catalytic dismutation
Table 2. Reactions and kinetic parameters used in the kinetic model.
No. Equation Kinetic parameters for Kinetic parameters for References
the LMW DOM sample the LMW DOM sample
from site P3 from site M4
(Strait of Gibraltar) (Murtensee)
1a Fe(III) + hn Æ Fe(II) + products k = 0.001 s–1 k = 0.001 s–1 Miller et al. (1995)b
O2 , hn
2c CDOM æææÆ CDOM•++ O
2
• – r = 9.5 ¥ 10–10M s–1(fp1)c r = 9.9 ¥ 10–8M s–1(fp1)c
3 Fe(III) + O2• – Æ Fe(II) + O2 k = <104M–1s–1(fp2) k = <103M–1s–1(fp2)
4 Fe(II) + O2 Æ Fe(III) + O2•– k = 6.37 M–1s–1 k = 20.78 M–1s–1 King (1998)d
5 FeIIL + O
2 Æ FeIIIL + O2•– k = 10.4 M–1s–1(fp3) k = 0.21 M–1s–1(fp3)
6 Fe(II) + O2• –+ 2 H+ Æ Fe(III) + H2O2 k = 1.00 ¥ 107M–1s–1 k = 1.00 ¥ 107M–1s–1 Rush and Bielski (1985)e
7 FeIIL + O 2
• –+ 2 H+ Æ FeIIIL + H
2O2 k = 4.0 ¥ 107M–1s–1(fp4) k = 5.6 ¥ 104M–1s–1(fp4)
8 Fe(II) + H2O2 Æ Fe(III) + HO•+ HO– k = 1.04 ¥ 105M–1s–1 k = 7.86 ¥ 104M–1s–1 King and Farlow (2000)f
9 FeIIL + H
2O2 Æ FeIIIL + HO•+ HO– k = 1.6 ¥ 105M–1s–1(fp5) k = <102M–1s–1(fp5)
10 FeIIIL Æ Fe(III) + L k = 1.00 ¥ 1010M–1s–1 k = 1.00 ¥ 1010M–1s–1
11 O2• –+ O2• –+ 2 H+ Æ H2O2+ O2 k = 2.51 ¥ 104M–1s–1 k = 3.98 ¥ 104M–1s–1 Zafiriou (1990)g
12 O2• –+ sinks Æ products k = 1.16 s–1 k = 4.63 s–1 Estimated from Voelker
et al. (2000) and Goldstone and Voelker (2000)h
13i Fe2++ L ¤ FeIIL K = >108M–1(fp6) K = >1010M–1(fp6)
fp = fitting parameter, see also Figure 7.
aFe(III) stands for total dissolved Fe(III) in the P3 and M4 LMW DOM samples, whose initial concentration was 10.6 nM and 6.8 nM,
respectively.
b We assumed a rate constants of photolysis of Fe(III) complexes in the range of that suggested by Miller et al. (1995).
c[CDOM] = 27 mM and 52 mM in the P3 and M4 LMW DOM samples, respectively, based on measured DOC concentrations and
as-suming that ~65 % of DOC is colored. The rate, r, of superoxide formation includes the CDOM concentration, r = k ¥ [CDOM], where
k is equal to fp1 in Figure 7.
dRate constants given by King (1998) for I = 0, corrected for I = 0.7 M and 7 mM for the P3 and M4 LMW DOM samples, respectively,
using Debye Hückel. P3 LMW DOM sample: alkalinity = 2.4 mM, pH = 8.3; M4 LMW DOM sample: alkalinity = 3.4 mM, pH = 8.2.
eFor inorganic, dissolved Fe(II) at pH > 6.
fRate constants given by King and Farlow (2000) for I = 0, corrected for I = 0.7 M and 7 mM for the P3 and M4 LMW DOM samples,
respectively, using Debye Hückel. P3 LMW DOM sample: alkalinity = 2.4 mM, pH = 8.3; M4 LMW DOM sample: alkalinity = 3.4 mM, pH = 8.2. Regarding HO•as a potential oxidant of Fe(II), we have neglected this pathway in these water samples on the basis of a study
by Emmenegger et al. (1998). We also have neglected the possibility that products of reactions of HO•with other water components, e.g.,
CO32–, might – directly or indirectly – affect the iron redox cycling.
gThis rate constant was calculated according to Zafiriou (1990) as follows: logk = 12.7 – 1.0(pH), with pH = 8.3 (P3 LMW DOM samples)
and pH = 8.2 (M4 LMW DOM sample).
hThese rate constants for reaction of superoxide with additional sinks are rough estimates based on Table 1 in Voelker et al. (2000) and
Figure 2 in Goldstone and Voelker (2000) (see text).
i In Acuchem, this equilibrium is formulated as a forward reaction with an adjustable rate constant and a fast back reaction with k b= 108
(kcat) of O2• –in the presence of organic copper complexes. This value is the average of the range of kcatdetermined in coastal water samples (Voelker et al., 2000). Measured Cu concentrations in the LMW DOM samples from sites P3 and M4 were ~2 nM and ~8 nM, respectively. The rate constant kotherwas estimated from Figure 2 in Goldstone and Voelker (2000) at the corresponding absorption co-efficients (a300) of the LMW DOM samples from sites P3 and M4. Hence the values for the overall rate con-stant, k12, can only be considered as very rough esti-mates.
With these values (Table 2), excellent agreement be-tween the mathematical simulation (solid lines in Figs. 5 and 6) and the experimental data was obtained for the Fe(II) concentration during irradiation and after the light
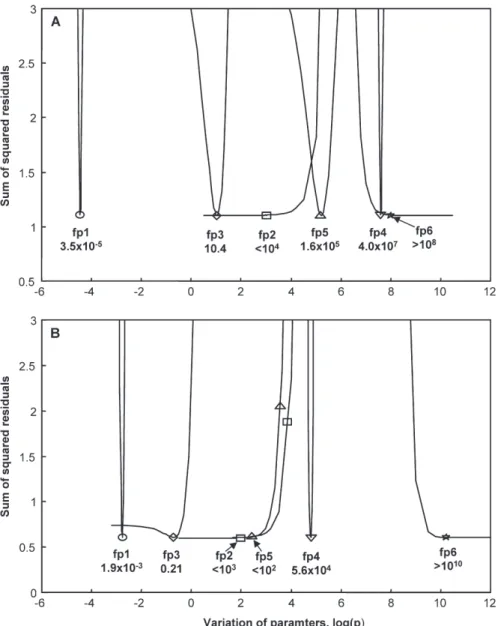
source was turned off, both for the P3 and M4 LMW DOM samples. The model also was able to simulate rea-sonable well the H2O2 concentration during irradiation (Figs. 5 and 6), although only initially with the LMW DOM sample from site P3 (Fig. 5). Figure 7 shows the sum of the squared residuals between model and data as a function of varying each single fitting parameter while keeping the other parameters at their optimized values. Some parameters are well defined while others can be varied over large ranges without compromising the agree-ment between model and data. The parabolic curves in Figure 7 would become broader if all other parameters would be optimized again for each variation of each sin-gle parameter. Since this type of variation is computa-tionally too time consuming, it was done only for some
Figure 7. Sum of the squared residuals between model and data as a function of varying each single fitting parameter while keeping the
other parameters at their optimized values. fp stands for fitting parameter, and the values of fp1–fp6 correspond to those in Table 2. A: LMW DOM from site P3; B: LMW DOM from site M4.
values of the critical parameter fp2 (reduction of Fe(III) by O2• –, see also below).
In the LMW sample from site P3 the rate constants of oxidation of Fe(II) bound to ligand L, FeIIL, by O2, O2• –, and H2O2(fp3, fp4, and fp5, respectively) are in the same range as those of oxidation of inorganic Fe(II) species by these oxidants (Table 2). In the LMW DOM sample from site M4, however, the rate constants of oxidation of FeIIL by O2, O2• –, and H2O2(fp3, fp4, and fp5, respectively) are orders of magnitude smaller, as compared to the corre-sponding rate constants of inorganic Fe(II) oxidation (Table 2). Hence the results of this model are consistent with our hypothesis that the slow decay of the Fe(II) con-centration in the LMW DOM samples from Murtensee is due to stabilization of Fe(II) by a ligand that forms more stable complexes with Fe(II) than with Fe(III), although they do not prove it.
Another striking result from the simulation of the experimental data with kinetic modeling is the following: The rate constants of reduction of Fe(III) by O2• – (fp2) turned out to be orders of magnitude smaller than the re-ported rate constant of reduction of inorganic Fe(III) by O2• –above pH 6, which is 1.50 ¥ 108M–1s–1(Rush and Bielski, 1985). Even with a re-optimization of all other parameters, fp2 could not be increased to above 104M–1 s–1(LMW DOM sample from site P3) and above 103M–1 s–1(LMW DOM sample from site M4) without a signifi-cant increase of the sum of squared residuals. Note that in our model, Fe(III) stands for total iron initially present in the LMW DOM samples from sites P3 and M4, and it is likely that >99 % is present in the form of organic Fe(III) complexes (e.g., Powell and Donat, 2001; Rue and Bru-land, 1995; Rue and BruBru-land, 1997; van den Berg, 1995; Wu and Luther, 1995).
Regarding reduction of organically bound Fe(III) by O2• –, second-order rate constants with well defined Fe(III) complexes have been reported (Bielski et al., 1985; Buet-tner et al., 1983; Butler and Halliwell, 1982; Rose and Waite, 2005). Measurements of the O2• –decay in the pres-ence of Fe(III) complexes yielded 9.3 ± 0.2 ¥ 103M–1s–1 and 1.9 ± 0.2 ¥ 105M–1s–1for the second-order rate con-stant of reaction of O2• –with Fe(III) bound to desferriox-amine B (DFB) and to salicylate, respectively, at pH 8.1 (Rose and Waite, 2005). Employing pulse radiolysis, But-ler and Halliwell (1982) determined the second-order rate constant of reaction of O2• –with FeIII-EDTA–to be 3 ± 0.5
¥ 105M–1s–1at pH 8. These authors also measured rate constants of reaction of O2• –with Fe(III) bound to ligands other than EDTA. They found that complexes of Fe(III) with diethylenetriaminepentaacetic acid (DETAPAC), bathophenanthroline, and desferrioxamine (DFB) reacted with O2• – at much lower, “perhaps insignificant rates”. They stress that their determined rate constants of reac-tion of O2• –with Fe(III) bound to ligands other than EDTA only can be considered as upper limits (e.g., k = <2 ¥ 105
M–1s–1for the reduction of Fe(III)-DFB by O2• –at pH 7.0). According to Buettner and coworkers (1983), who also used pulse radiolysis, the upper limit of the second-order rate constant of reduction of Fe(III)-DETAPAC by O2• –is <104M–1s–1at pH 8.0. These authors state that thermo-dynamics does not appear to govern observed rates of re-duction of organic Fe(III) complexes by O2• –, but rather steric factors. On the other hand, Rose and Waite (2005) found that the rate of reduction of organically complexed Fe(III) by O2• –generally depended on the stability of the complex.
The values determined with our model as best fits for the second-order rate constant of reaction of O2• – with Fe(III) in the P3 LMW DOM and M4 LMW DOM sam-ples (fp2 in Table 2 and in Fig. 7) are <104and <103M–1 s–1, respectively and hence not too far from reported rate constants of reaction of O2• – with well-defined Fe(III) complexes (see above). In sunlit surface waters LMW compounds likely consist in part of siderophores (e.g., Powell and Wilson-Finelli, 2003) that are strong chelators of Fe(III) (Albrecht-Gary and Crumbliss, 1998; Witter et al., 2000). The purpose of the simulation of our experi-mental data with mathematical kinetic modeling was not to determine rate constants that could be generalized but to test hypotheses. Our modeling results are consistent with, but do not prove, that the main pathway of Fe(III) reduction in the LMW DOM samples from sites P3 and M4 is photolysis of Fe(III) complexes (and not reduction of Fe(III) by O2• –).
Effect of DOM origin on Fe(II) steady-state concentrations
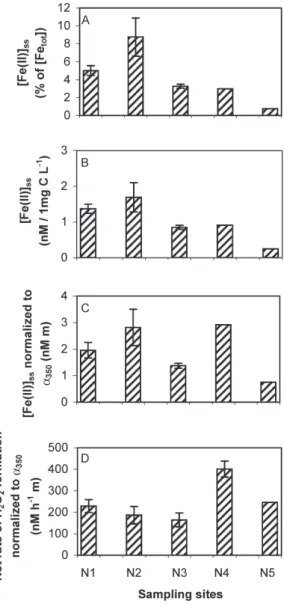
Figure 8A shows the percentage of [Fe(II)]ss from total dissolved iron in HMW DOM fractions gained from wa-ter samples collected at sites with different salinity during the Navicula cruise (samples from sites N1–N5, see Table 1 and Fig. 2C). The percentage of [Fe(II)]ssfrom total dis-solved iron was higher in the HMW DOM samples with a higher proportion of freshwater, and was higher in the River Waal than in the River Scheldt water samples. As also observed for the sea- and freshwater samples from sites P1–P5 and M1–M4, respectively, [Fe(II)]ssis not pri-marily controlled by total dissolved iron concentrations. A similar pattern as shown in Figure 8A is observed for [Fe(II)]ss, normalized to 1 mg C L–1(Fig. 8B). Obviously, [Fe(II)]ss depends on the type of HMW organic com-pounds present. In the River Scheldt and River Waal (sites N1 and N2, respectively), these compounds are likely to be terrestrially derived, whereas in the North Sea (sites N4 and N5) autochthonous HMW DOM is pre-dominant. At site N3 (salinity 9.6 ‰), HMW DOM is probably a mixture of terrestrial and algal-derived com-pounds. Gaberell and coworkers (2003) found signifi-cantly higher rates of Cr(VI) reduction with DOM
de-rived from terrestrial sources than with predominantly autochthonous materials even if additional iron was added to the latter. Based on their results, these authors hypoth-esize that the rate-determining step in Cr(VI) reduction is light-induced formation of Fe(II), either through pho-tolysis of Fe(III) complexes or via reduction of Fe(III) by O2• –or other intermediates formed in photochemical re-actions after light absorption of DOM (see Fig. 1). Gaberell and coworkers (2003) also found that the terres-trially derived DOM samples exhibited a higher percent-age of aromaticity and higher molar absorption coeffi-cients at 280 nm than the algal derived DOM samples
and, therefore, were photochemically more reactive in Cr(VI) reduction.
The Fe(II) steady-state concentration in the HMW DOM sample from site N4 (River Rhine estuary, see Fig. 2C), normalized to both total dissolved iron and 1 mg C L–1, was almost identical to that in the HMW DOM sample from site N3 (north of N4 in the River Rhine estuary, see Fig. 2C) and considerably higher than that in the HMW DOM sample from site N5 (see Fig. 2C). Furthermore, approximately equal Fe(II) steady-state con-centrations, normalized to the decadic absorption coeffi-cient at 350 nm (a350, unit m–1) were measured in the HMW DOM samples from sites N4 and N2 (Fig. 8C), where site N2 is the River Waal site. Interestingly, the net rate of H2O2formation, normalized to a350, was highest in the HMW DOM sample from N4 (Fig. 8D). The elucida-tion of causes for this higher photochemical reactivity of HMW DOM compounds from site N4, compared to HMW DOM compounds from the other sampling sites of the
Navicula cruise, would involve chemical characterization
of these compounds (Kaiser et al., 2003; Schwede-Thomas et al., 2005), which was outside the scope of this study.
Conclusions
The main results of this study can be summarized as fol-lows: (i) In the studied sea- and freshwater samples, LMW DOM compounds exhibited a higher photochemi-cal reactivity towards Fe(II) formation than HMW DOM compounds. This result led us to the hypothesis that the main pathway of Fe(III) reduction in these water samples is photolysis of Fe(III) complexes (and not reduction of Fe(III) by O2• –) and occurs more readily if Fe(III) is bound to LMW organic ligands, as compared to HMW ligands. (ii) We hypothesize that the slow decay of the Fe(II) con-centration after irradiation of the LMW water samples from Murtensee may be due to stabilization of Fe(II) by a ligand that forms more stable complexes with Fe(II) than with Fe(III). (iii) The simulation of the experimental data obtained with the LMW DOM samples from sites P3 and M4 with mathematical kinetic modeling is in agreement with our hypotheses presented above under (i) and (ii). (iv) The origin and thus the chemical composition of HMW DOM compounds determined their photoreactiv-ity towards Fe(II) formation in the “river-to-ocean” water samples, confirming the findings by Gaberell and co-workers (2003).
The assessment of the environmental factors that de-termine [Fe(II)]ssis key since Fe(II) is an utmost impor-tant intermediate species in sunlit surface waters, not only regarding the bioavailability of iron but also the role of Fe(II) as an electron donor. One of the key redox reac-tions involving Fe(II) is the Fenton reaction yielding the hydroxyl radical. The oxidation of organic and inorganic pollutants by HO•may not always be beneficial but may
Figure 8. Steady-state concentrations of Fe(II) as percentage of
total dissolved iron (A), normalized to 1 mg C L–1(B), and
normal-ized to a350(C), and net rate of H2O2formation, normalized to a350
(D) during irradiation with simulated sunlight (I0~1.2 kW m–2) of
HMW DOM (pH = 8.2) from sites N1–N5. The HMW DOM pow-ders were dissolved in MQ-UV water yielding a DOC concentration of approximately 2 mg L–1in each sample. Data represent the mean
increase the toxicity of pollutants as in the case of Hg0 aq (Lalonde et al., 2004). In addition, HO•can damage cellu-lar components such as proteins, lipids, and nucleic acids (Lupinkova and Komenda, 2004). Kaiser and Sulzberger (2004) observed a short-term (1 h) decrease in bacterial utilization of irradiated high-molecular-weight, low-mol-ecular-weight, hydrophobic, and hydrophilic DOM frac-tions by up to 80 %, compared with the uptake of the corresponding non-irradiated fractions. Based on exper-iments with the addition of ROS scavengers and on mea-sured Fe(II) formation during irradiation, these authors hypothesize that HO•, formed in the Fenton reaction, was responsible for the inhibition of bacterial utilization of irradiated high-molecular-weight DOM.
Acknowledgments
We acknowledge the Swiss Government (Bundesamt für Bildung und Wissenschaft) for the financial support of this project, which was part of the EU-Project COMET (Composition of Dissolved Organic Matter and its Inter-actions with Metals and Ultraviolet Radiation in River-Ocean Systems: Impact on the Microbial Food Web). We thank Rainer Amon (Alfred Wegener Institute Foundation for Polar and Marine Research (AWI), Bremerhaven, Germany; present address: Texas A&M University at Galveston, Galveston, Texas, USA) for providing us with the HMW DOM samples from sites N1–N5 and with the DOC data at these sites. We also thank Diane Buerge-Weirich and Edith Kaiser (Eawag; present address of Diane Buerge-Weirich: Swiss Federal Research Sta-tion for Agroecology and Agriculture (FAL), Zürich, Switzerland) for their help before and during the Pelagia cruise, and for many fruitful discussions. Last but not least we would like to acknowledge D. Whitney King (Colby College, Waterville, Maine, USA) for his help with the evaluation of rate constants of inorganic Fe(II) oxidation.
References
Albrecht-Gary, A. M. and A. L. Crumbliss, 1998. Coordination chemistry of siderophores: Thermodynamics and kinetics of iron chelation and release. In: A. Sigel and H. Sigel (eds.), Iron Transport and Storage in Microorganisms, Plants and Animals, Metal Ions in Biological Systems, Marcel Dekker, New York, pp. 239–327.
Aldrich, A. P. and C. M. G. van den Berg, 1998. Determination of iron and its redox speciation in seawater using catalytic ca-thodic stripping voltammetry. Electroanalysis 10: 369–373. Anderson, M. A. and F. M. M. Morel, 1982. The influence of
aque-ous iron chemistry on the uptake of iron by the coastal diatom
Thalassiosira weissflogii. Limnol. Oceanogr. 27: 789–813.
Barbeau, K., E. L. Rue, K. W. Bruland and A. Butler, 2001. Photo-chemical cycling of iron in the surface ocean mediated by mi-crobial iron(III)-binding ligands. Nature 413: 409–413.
Barbeau, K., E. L. Rue, C. G. Trick, K. T. Bruland and A. Butler, 2003. Photochemical reactivity of siderophores produced by marine heterotrophic bacteria and cyanobacteria based on char-acteristic Fe(III) binding groups. Limnol. Oceanogr. 48: 1069– 1078.
Barbeau, K., G. P. Zhang, D. H. Live and A. Butler, 2002. Petro-bactin, a photoreactive siderophore produced by the oil-de-grading marine bacterium Marinobacter hydrocarbonoclasticus. J. Am. Chem. Soc. 124: 378–379.
Benner, R., B. Biddanda, B. Black and M. McCarthy, 1997. Abun-dance, size distribution, and stable carbon and nitrogen isotopic compositions of marine organic matter isolated by tangential-flow ultrafiltration. Mar. Chem. 57: 243–263.
Benner, R. and M. Strom, 1993. A critical evaluation of the analyt-ical blank associated with DOC measurements by high-temper-ature catalytic oxidation. Mar. Chem. 41: 153–160.
Bielski, B. H. J., D. E. Cabelli and R. L. Arudi, 1985. Reactivity of HO2/O2–radicals in aqueous solution. J. Phys. Chem. Ref. Data
14: 1060–1063.
Blough, N. V. and R. G. Zepp, 1995. Reactive oxygen species in natural waters. In: C. S. Foote, J. S. Valentine, A. Greenberg and J. F. Liebman (eds.), Active Oxygen Species in Chemistry, Blackie Academic and Professional, New York, pp. 280–333. Borer, P. M., B. Sulzberger, P. Reichard and M. S. Kraemer, 2005.
Effect of siderophores on the light-induced dissolution of col-loidal iron(III) (hydr)oxides. Mar. Chem. 93: 179–193. Braun, W., J. T. Herron and D. K. Kahaner, 1988. Acuchem: a
com-puter program for modeling complex chemical reaction sys-tems. Int. J. Chem. Kinet. 20: 51–62.
Bruland, K. W., E. L. Rue, J. R. Donat, S. A. Skrabal and J. W. Mof-fett, 2000. Intercomparison of voltammetric techniques to de-termine the chemical speciation of dissolved copper in a coastal seawater sample. Anal. Chim. Acta 405: 99–113.
Buettner, G. R., T. P. Doherty and L. K. Patterson, 1983. The ki-netics of the reaction of superoxide radical with Fe(III) com-plexes of EDTA, DETAPAC and HEDTA. FEBS Lett. 158: 143–146.
Butler, A., 1998. Acquisition and utilization of transition metal ions by marine organisms. Science 281: 207–210.
Butler, J. and B. Halliwell, 1982. Reaction of iron-EDTA chelates with the superoxide radical. Arch. Biochem. Biophys. 218: 174– 178.
Emmenegger, L., D. W. King, L. Sigg and B. Sulzberger, 1998. Ox-idation kinetics of Fe(II) in a eutrophic Swiss lake. Environ. Sci. Technol. 32: 2990–2996.
Emmenegger, L., R. Schönenberger, L. Sigg and B. Sulzberger, 2001. Light-induced redox cycling of iron in circumneutral lakes. Limnol. Oceanogr. 46: 49–61.
Falkowski, P. G., 1997. Evolution of the nitrogen cycle and its influence on the biological sequestration of CO2in the ocean.
Nature 387: 272–275.
Faust, B. C. and R. G. Zepp, 1993. Photochemistry of aqueous iron(III) polycarboxylate complexes – Roles in the chemistry of atmospheric and surface waters. Environ. Sci. Technol. 27: 2517–2522.
Gaberell, M., Y.-P. Chin, S. J. Hug and B. Sulzberger, 2003. Role of dissolved organic matter composition on the photoreduction of Cr(VI) to Cr(III) in the presence of iron. Environ. Sci. Technol.
37: 4403–4409.
Gao, H. Z. and R. G. Zepp, 1998. Factors influencing photore-actions of dissolved organic matter in a coastal river of the southeastern United States. Environ. Sci. Technol. 32: 2940– 2946.
Goldstone, J. V. and B. M. Voelker, 2000. Chemistry of superoxide radical in seawater: CDOM associated sink of superoxide in coastal waters. Environ. Sci. Technol. 34: 1043–1048. Hatchard, C. G. and C. A. Parker, 1956. A new sensitive chemical
actinometer II. Potassium ferrioxalate as a standard chemical actinometer. Proc. R. Soc. Lond. Ser. A 235: 518–536.
Haygood, M. G., P. D. Holt and A. Butler, 1993. Aerobactin pro-duction by a planktonic marine Vibrio sp. Limnol. Oceanogr.
38: 1091–1097.
Hug, S. J., H.-U. Laubscher and B. R. James, 1997. Iron(III) cat-alyzed photochemical reduction of chromium(VI) by oxalate and citrate in aqueous solutions. Environ. Sci. Technol. 31: 160– 170.
Hutchins, D. A., A. E. Witter, A. Butler and G. W. Luther, 1999. Competition among marine phytoplankton for different chelated iron species. Nature 400: 858–861.
Jones, G. J., B. P. Palenik and F. M. M. Morel, 1987. Trace metal reduction by phytoplankton: The role of plasmalemma redox enzymes. J. Phycol. 23: 237–244.
Kaiser, E., A. J. Simpson, K. J. Dria, B. Sulzberger and P. G. Hatcher, 2003. Solid-state and multidimensional solution-state NMR of solid phase extracted and ultrafiltered riverine dissolved organic matter. Environ. Sci. Technol. 37: 2929– 2935.
Kaiser, E. and B. Sulzberger, 2004. Phototransformation of riverine dissolved organic matter (DOM) in the presence of abundant iron: Effect on DOM bioavailability. Limnol. Oceanogr. 49: 540–554.
Kieber, R. J. and G. R. Helz, 1992. Indirect photoreduction of aque-ous chromium(VI). Environ. Sci. Technol. 26: 307–312. King, D. W., 1998. Role of carbonate speciation on the oxidation
rate of Fe(II) in aquatic systems. Environ. Sci. Technol. 32: 2997–3003.
King, D. W. and R. Farlow, 2000. Role of carbonate speciation on the oxidation of Fe(II) by H2O2. Mar. Chem. 70: 201–209.
King, D. W., H. A. Lounsbury and F. J. Millero, 1995. Rates and mechanism of Fe(II) oxidation at nanomolar total iron concen-trations. Environ. Sci. Technol. 29: 818–824.
Kuma, K., S. Nakabayashi, Y. Suzuki, I. Kudo and K. Matsunaga, 1992. Photo-reduction of Fe(III) by dissolved organic sub-stances and existence of Fe(II) in seawater during spring blooms. Mar. Chem. 37: 15–27.
Lalonde, J. D., M. Amyot, J. Orvoine, F. M. M. Morel, J. C. Auclair and P. A. Ariya, 2004. Photoinduced oxidation of Hg0(aq) in the
waters from the St. Lawrence estuary. Environ. Sci. Technol.
38: 508–514.
Liang, L. Y., J. A. McNabb, J. M. Paulk, B. H. Gu and J. F. McCarthy, 1993. Kinetics of Fe(II) oxygenation at low partial pressure of oxygen in the presence of natural organic matter. Environ. Sci. Technol. 27: 1864–1870.
Lupinkova, L. and J. Komenda, 2004. Oxidative modifications of the Photosystem II D1 protein by reactive oxygen species: From isolated protein to cyanobacterial cells. Photochem. Pho-tobiol. 79: 152–162.
Maldonado, M. T. and N. M. Price, 1999. Utilization of iron bound to strong organic ligands by plankton communities in the subarctic Pacific Ocean. Deep-Sea Res. Part II-Top. Stud. Oceanogr. 46: 2447–2473.
Maldonado, M. T. and N. M. Price, 2001. Reduction and transport of organically bound iron by Thalassiosira oceanica (Bacillar-iophyceae). J. Phycol. 37: 298–309.
Miles, C. J. and P. L. Brezonik, 1981. Oxygen consumption in hu-mic-colored waters by a photochemical ferrous-ferric catalytic cycle. Environ. Sci. Technol. 15: 1089–1095.
Miller, W. L. and D. R. Kester, 1988. Hydrogen peroxide measure-ment in seawater by (p-hydroxyphenyl)acetic acid dimeriza-tion. Anal. Chem. 60: 2711–2715.
Miller, W. L., D. W. King, J. Lin and D. R. Kester, 1995. Photo-chemical redox cycling of iron in coastal seawater. Mar. Chem.
50: 63–77.
Mills, M. M., C. Ridame, M. Davey, J. La Roche and R. J. Geider, 2004. Iron and phosphorus co-limit nitrogen fixation in the eastern tropical North Atlantic. Nature 429: 292–294. Morel, F. M. M. and N. M. Price, 2003. The biogeochemical cycles
of trace metals in the oceans. Science 300: 944–947.
Powell, R. T. and J. R. Donat, 2001. Organic complexation and spe-ciation of iron in the South and Equatorial Atlantic. Deep-Sea Res. Part II-Top. Stud. Oceanogr. 48: 2877–2893.
Powell, R. T. and A. Wilson-Finelli, 2003. Photochemical degrada-tion of organic iron complexing ligands in seawater. Aquat. Sci.
65: 367–374.
Pullin, M. J. and S. E. Cabaniss, 2003. The effects of pH, ionic strength, and iron-fulvic acid interactions on the kinetics of non-photochemical iron transformations. I. Iron(II) oxidation and iron(III) colloid formation. Geochim. Cosmochim. Acta
67: 4067–4077.
Reid, R. T. and A. Butler, 1991. Investigation of the mechanism of iron acquisition by the marine bacterium Alteromonas
luteovi-olaceus: Characterization of siderophore production. Limnol.
Oceanogr. 36: 1783–1792.
Rose, A. L. and T. D. Waite, 2002. Kinetic model for Fe(II) oxida-tion in seawater in the absence and presence of natural organic matter. Environ. Sci. Technol. 36: 433–444.
Rose, A. L. and T. D. Waite, 2003a. Predicting iron speciation in coastal waters from the kinetics of sunlight-mediated iron redox cycling. Aquat. Sci. 65: 375–383.
Rose, A. L. and T. D. Waite, 2003b. Effect of dissolved natural organic matter on the kinetics of ferrous iron oxygenation in seawater. Environ. Sci. Technol. 37: 4877–4886.
Rose, A. L. and T. D. Waite, 2005. Reduction of organically com-plexed ferric iron by superoxide in a simulated natural water. Environ. Sci. Technol. 39: 2645–2650.
Rue, E. L. and K. W. Bruland, 1995. Complexation of iron(III) by natural organic ligands in the Central North Pacific as deter-mined by a new competitive ligand equilibration adsorptive cathodic stripping voltammetric method. Mar. Chem. 50: 117– 138.
Rue, E. L. and K. W. Bruland, 1997. The role of organic complexa-tion on ambient iron chemistry in the equatorial Pacific Ocean and the response of a mesoscale iron addition experiment. Lim-nol. Oceanogr. 42: 901–910.
Rush, J. D. and B. H. J. Bielski, 1985. Pulse radiolysis studies of the reactions of HO2/O2–with ferric ions and its implication on the
occurrence of the Haber-Weiss reaction. J. Phys. Chem. 89: 5062–5066.
Santana-Casiano, J. M., M. González-Dávila and F. J. Millero, 2004. The oxidation of Fe(II) in NaCl-HCO3–and seawater
so-lutions in the presence of phthalate and salicylate ions: a kinetic model. Mar. Chem. 85: 27–40.
Schulz, K. G., I. Zondervan, L. J. A. Gerringa, K. R. Timmermans, M. J. W. Veldhuis and U. Riebesell, 2004. Effect of trace metal availability on coccolithophorid calcification. Nature 430: 673–676.
Schwede-Thomas, S. B., Y.-P. Chin, K. J. Dria, P. G. Hatcher, E. Kaiser and B. Sulzberger, 2005. Characterizing the properties of dissolved organic matter isolated by XAD and C-18 solid phase extraction and ultrafiltration. Aquat. Sci. 67: 61–71. Sedlak, D. L. and J. Hoigné, 1993. The role of copper and oxalate in
the redox cycling of iron in atmospheric waters. Atmospheric Environment 27A: 2173–2185.
Siffert, C. and B. Sulzberger, 1991. Light-induced dissolution of hematite in the presence of oxalate: A case study. Langmuir 7: 1627–1634.
Somville, M. and N. Depauw, 1982. Influence of temperature and river discharge on water quality of the Western Scheldt Estuary. Water Res. 16: 1349–1356.
Soria-Dengg, S. and U. Horstmann, 1995. Ferrioxamine-B and ferrioxamine-E as iron sources for the marine diatom
Phaeo-dactylum tricornutum. Mar. Ecol., Prog. Ser. 127: 269–277.
Southworth, B. A. and B. M. Voelker, 2003. Hydroxyl radical pro-duction via the photo-Fenton reaction in the presence of fulvic acid. Environ. Sci. Technol. 37: 1130–1136.
Sunda, W. G., 1991. Trace metal interactions with marine phyto-plankton. Biol. Oceanogr. 6: 411–442.