Sebastian Leschka Lars Husmann Lotus M. Desbiolles Oliver Gaemperli Tiziano Schepis Pascal Koepfli Thomas Boehm Borut Marincek Philipp A. Kaufmann Hatem Alkadhi Received: 14 December 2005 Revised: 21 February 2006 Accepted: 20 March 2006 Published online: 13 May 2006 # Springer-Verlag 2006
Optimal image reconstruction intervals
for non-invasive coronary angiography
with 64-slice CT
Abstract The reconstruction inter-vals providing best image quality for non-invasive coronary angiography with 64-slice computed tomography (CT) were evaluated. Contrast-enhanced, retrospectively electrocar-diography (ECG)-gated 64-slice CT coronary angiography was performed in 80 patients (47 male, 33 female; mean age 62.1±10.6 years). Thirteen data sets were reconstructed in 5% increments from 20 to 80% of the R-R interval. Depending on the average heart rate during scanning, patients were grouped as <65 bpm (n=49)
and≥65 bpm (n=31). Two blinded and
independent readers assessed the image quality of each coronary
seg-ment with a diameter≥1.5 mm using
the following scores: 1, no motion artifacts; 2, minor artifacts; 3, moder-ate artifacts; 4, severe artifacts; and 5, not evaluative. The average heart rate
was 63.3±13.1 bpm (range 38–102).
Acceptable image quality (scores 1–3)
was achieved in 99.1% of all coronary segments (1,162/1,172; mean image
quality score 1.55±0.77) in the best reconstruction interval. Best image quality was found at 60% and 65% of the R-R interval for all patients and for each heart rate subgroup, whereas motion artifacts occurred significantly more often (P<0.01) at other recon-struction intervals. At heart rates <65 bpm, acceptable image quality was found in all coronary segments at
60%. At heart rates≥65 bpm, the
whole coronary artery tree could be visualized with acceptable image quality in 87% (27/31) of the patients at 60%, while ten segments in four patients were rated as non-diagnostic
(scores 4–5) at any reconstruction
interval. In conclusion, 64-slice CT coronary angiography provides best overall image quality in mid-diastole. At heart rates <65 bpm, diagnostic image quality of all coronary segments can be obtained at a single reconstruction interval of 60%. Keywords 64-slice CT . Coronary angiography . Reconstruction interval
Introduction
Non-invasive coronary angiography using multi-slice computed tomography (CT) is currently emerging as an important tool for the assessment of coronary artery disease (CAD). First experience has shown the ability of the recently introduced 64-slice CT to accurately diagnose
significant coronary artery stenosis [1–5]. However,
despite the substantial improvement of temporal resolution
from 125 to 250 ms with four-detector-row CT and 105–
210 ms with 16-detector-row CT to 83–165 ms with
64-slice CT [6], cardiac motion artifacts still occur and may
lead to a decline in diagnostic accuracy [1–5].
Because of limitations with regard to temporal resolu-tion, image quality is still linked to the heart rate and to the timing of image reconstruction. Several studies have evaluated the optimal time interval for image reconstruc-tion using retrospectively electrocardiography
(ECG)-gated four-detector-row CT [7–9] and 16-detector-row
CT [10–12]. With four-detector-row CT, the left anterior
S. Leschka . L. Husmann . L. M. Desbiolles . T. Boehm . B. Marincek . H. Alkadhi (*) Institute of Diagnostic Radiology, University Hospital Zurich, Raemistrasse 100, 8091 Zurich, Switzerland e-mail: [email protected] Tel.: +41-1-2553662 Fax: +41-1-2554443 O. Gaemperli . T. Schepis . P. Koepfli . P. A. Kaufmann Cardiovascular Center, University Hospital Zurich, Zurich, Switzerland P. A. Kaufmann
Center for Integrative Human Physiology, University of Zurich, Zurich, Switzerland
descending artery (LAD) was best visualized at 50–70%,
the left circumflex artery (LCX) at 50–60%, and the right
coronary artery (RCA) at 40–50% of the R-R interval [7–
9], indicating the need for separate reconstructions for each coronary artery. With 16-detector-row CT, best image quality was most commonly achieved in mid-diastole [10], with additional reconstructions needed with higher heart
rates in end-systole [11,12].
The improved temporal resolution of 64-slice CT may allow to adequately image all relevant coronary artery segments with diagnostic image quality at a single interval of the cardiac cycle. This would have the advantage of allowing the implementation of ECG-pulsing [13] and to reduce the time for diagnosis by minimizing the amount of reconstructed data to be handled. The purpose of this study was to evaluate the reconstruction interval providing the best image quality for non-invasive coronary angiography with 64-slice CT.
Materials and methods Study population
Between May 2005 and August 2005, 80 consecutive patients (47 male, 33 female; mean age 62.1±10.6 years;
range 30–83 years) prospectively underwent 64-slice CT
coronary angiography. Patients had suffered from stable angina pectoris (n=42), atypical chest pain in combination with high risk for coronary artery disease (n=29), or recurrent symptoms after previous balloon angioplasty (n=9). Exclusion criteria were allergy to iodine-containing contrast medium, renal insufficiency (creatinine level
>120 μmol/l), pregnancy, hemodynamic instability,
non-sinus rhythm, and previous stent graft or bypass surgery. Forty-seven patients (59%) had taken beta-blocker as part of their baseline medication at the time of the CT examination. No additional beta-blockers were adminis-tered prior to the CT scan. The study was approved by our institutional ethics committee and all participating patients gave written informed consent.
CT data acquisition
All CT scans were performed on a 64-slice scanner with a 330-ms rotation time (Somatom Sensation 64, Siemens, Forchheim, Germany). A bolus of 80 ml non-ionic iodinated contrast agent (iodixanol, Visipaque 320 mgI/ml, Amersham Health, Buckinghamshire, UK) was injected at a rate of 5 ml/s via an 18- to 20-gauge catheter placed in the right antecubital vein followed by a saline chasing bolus of 30 ml. Contrast agent application was controlled by bolus tracking with a region of interest placed in the aortic root and by starting data acquisition 5 s after signal density reached the threshold of 140 HU. Data acquisition
was performed in a cranio-caudal direction using the
following scanning parameters: detector collimation
32×0.6 mm, slice acquisition 64×0.6 mm, pitch 0.24, tube voltage 120 kV, and tube current 700 mAs. No additional non-contrast CT for quantitative calcium scoring was performed.
CT image reconstruction and data analysis
For retrospective ECG-gating, images were reconstructed using the 180° cardiac interpolation algorithm [14] and the adaptive cardio volume (ACV) approach [15]. In each patient, 13 datasets were reconstructed in 5% steps from 20 to 80% of the R-R interval with a slice thickness of 0.75 mm, a reconstruction increment of 0.5 mm, and using a medium soft-tissue convolution kernel (B30f). The field of view (FoV) was manually adjusted to exactly encompass the heart (mean
FoV 152±17 mm; range, 128–178 mm). All reconstructed
images were transferred to a separate workstation (Leonardo with Syngo InSpace4D application, Siemens).
The coronary artery tree was subdivided into 15 segments according to the guidelines of the American Heart Associ-ation [16]. Coronary artery analysis was performed in all vessels with at least 1.5 mm of luminal diameter. All reconstructed images were evaluated and classified by two independent readers, each with 3 years of experience in cardiovascular radiology, using axial source images, multi-planar reformations (MPR), and thin-slab maximum inten-sity projections (MIP). Each coronary segment in all 13 data sets from 20 to 80% of the R-R interval was evaluated by both readers with regard to the presence of motion artifacts. Image quality was semi-quantitatively assessed on a
five-point ranking scale as previously published [17]: 1 no
motion artifacts, clear delineation of the segment; 2 minor artifacts, mild blurring of the segment; 3 moderate artifacts, moderate blurring without structure discontinuity; 4 severe artifacts, doubling or discontinuity in the course of the segment; or 5 not evaluative, vessel structures not differentiable. A score of 3 or less was considered acceptable in terms of image quality for routine clinical diagnostics. For any disagreement in data analysis, consensus reading between the readers was performed.
Statistical analysis
Statistical analysis was performed using a commercially available software package (SPSS 12.0.1 for Windows, SPSS, Chicago, Ill.). Data were expressed as mean± standard deviation for continuous variables and as frequencies and percentages for categorical variables.
Inter-observer agreements were expressed as Cohen’s
kappa statistics [18] and interpreted by the guidelines of
Landis and Koch [19]. Depending on the average heart rate during scanning, patients were subdivided in two groups:
with heart rates <65 bpm or with heart rates ≥65 bpm, respectively. The Fisher exact test was used to evaluate categorical data. Multivariate calculations with repeated measures analysis of variance (ANOVA) was performed to test for the null hypothesis, that not all ratings for the reconstruction intervals have the same mean. When statistical significance was observed by repeated measures ANOVA, the results were made post hoc by the Scheffé test for multiple pairwise comparisons. A P value of <0.05 indicated a statistically significant difference.
Results
No statistically significant difference was present with regard to age (P=0.57), BMI (P=0.12), and beta-blocker administration (P=0.41) in patients with heart rates <65 bpm compared with patients with heart rates ≥65 bpm, whereas significantly fewer women were present
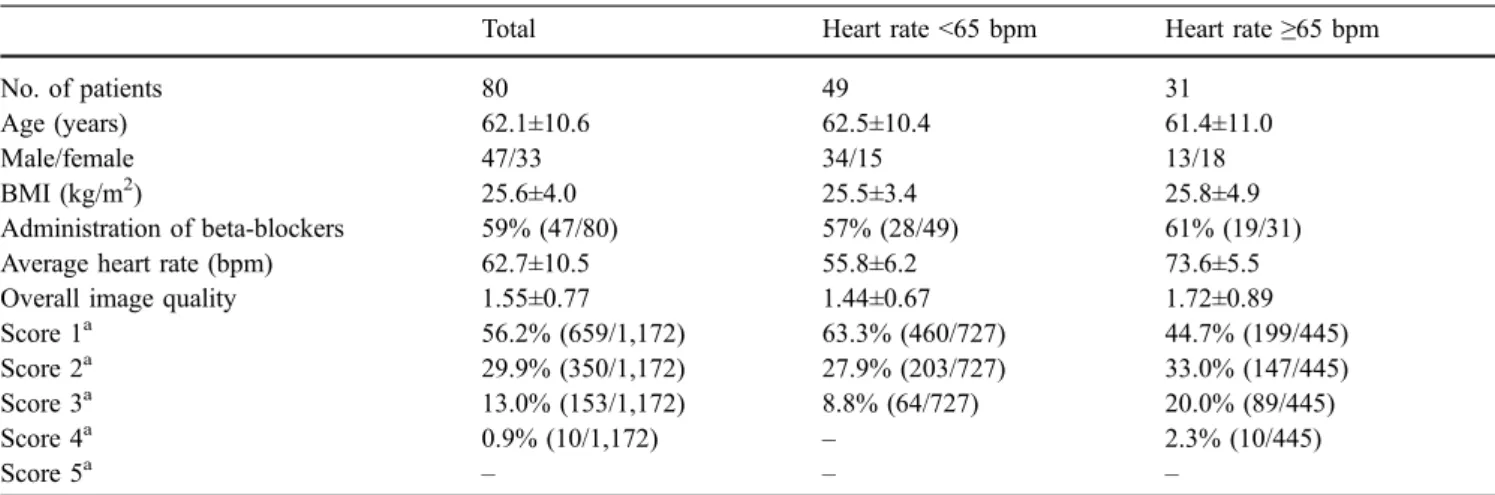
in the group with lower heart rates (P<0.05). Table 1
summarizes demographic data and image quality ratings for the entire study population. The average heart rate in all
patients was 62.7±10.5 bpm (range 39–88 bpm). In 61% of
the patients (49/80), the heart rate was <65 bpm, with a
mean of 55.8±6.2 bpm (range 39–64 bpm). In the
remaining 39% (31/80), the heart rate was ≥65 bpm with
a mean of 73.6±5.5 bpm (range 65–88 bpm).
Image quality of coronary artery segments
In 19% of patients (15/80), less than 15 coronary segments were available for evaluation because of anatomical variations (12 segments in six patients) or due to a lumen diameter <1.5 mm at the origin of the vessel of interest (16 segments in nine patients). Therefore, a total of 1,172 coronary segments in 80 patients were available for
evaluation. Regarding the best image quality score in all evaluated reconstruction intervals, acceptable image
qual-ity (scores 1–3) was achieved in 99.1% of all coronary
segments (1,162/1,172) with motion artifact-free images (score 1) were present in 56.2% of the coronary segments (659/1,172), minor artifacts (score 2) occurred in 29.9% (350/1,172), and moderate artifacts (score 3) in 13.0% (153/1,172). Severe artifacts (score 4) occurred in 0.9% (10/1,172) even in the best reconstruction interval. No coronary segment was rated as being not evaluative (score 5) by both readers. Inter-observer agreement for image quality rating was good (kappa=0.71). In 75% of the coronary segments (880/1,172), immediate agreement between both observers was achieved. The consensus reading about the remaining 292 segments (25%) was required for discriminating between image quality scores 2 and 3 (205/292, 70%) and for discriminating between scores 1 and 2 (87/292, 30%). Mean image quality score in all patients was 1.55±0.77. Statistically significant differ-ences of mean image quality were observed between the lower and higher heart rate groups (<65 bpm, 1.44±0.67; ≥65 bpm, 1.72±0.89; P<0.01).
Effect of reconstruction interval on image quality
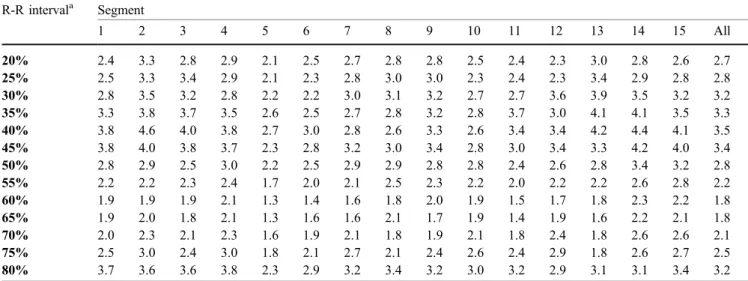
Table 2 shows the mean image quality scores of the
coronary segments in all patients at different reconstruction intervals. Some segments were visualized with the same
image quality score at two or more intervals. Figure 1
demonstrates examples of coronary artery delineation at different reconstruction intervals.
Image quality was superior at 60% and 65% of the R-R interval for all patients together and for both heart rate subgroups, while image quality was significantly reduced (P<0.01) at other reconstruction intervals. Comparing the heart rate subgroups, mean image quality scores were
Table 1 Demographic data, average heart rate, beta-blocker medication, and image quality scores for 64-slice CT coronary angiography Total Heart rate <65 bpm Heart rate≥65 bpm
No. of patients 80 49 31
Age (years) 62.1±10.6 62.5±10.4 61.4±11.0
Male/female 47/33 34/15 13/18
BMI (kg/m2) 25.6±4.0 25.5±3.4 25.8±4.9
Administration of beta-blockers 59% (47/80) 57% (28/49) 61% (19/31)
Average heart rate (bpm) 62.7±10.5 55.8±6.2 73.6±5.5
Overall image quality 1.55±0.77 1.44±0.67 1.72±0.89
Score 1a 56.2% (659/1,172) 63.3% (460/727) 44.7% (199/445) Score 2a 29.9% (350/1,172) 27.9% (203/727) 33.0% (147/445) Score 3a 13.0% (153/1,172) 8.8% (64/727) 20.0% (89/445) Score 4a 0.9% (10/1,172) – 2.3% (10/445) Score 5a – – – a
Image quality scores at the best R-R interval. Score 1 no motion artifacts; score 2 minor artifacts; score 3 moderate artifacts; score 4 severe artifacts; score 5 not evaluative
Table 2 Mean score of image quality of the coronary artery segments of all patients (n=80) according to percent of R-R interval R-R intervala Segment 1 2 3 4 5 6 7 8 9 10 11 12 13 14 15 All 20% 2.4 3.3 2.8 2.9 2.1 2.5 2.7 2.8 2.8 2.5 2.4 2.3 3.0 2.8 2.6 2.7 25% 2.5 3.3 3.4 2.9 2.1 2.3 2.8 3.0 3.0 2.3 2.4 2.3 3.4 2.9 2.8 2.8 30% 2.8 3.5 3.2 2.8 2.2 2.2 3.0 3.1 3.2 2.7 2.7 3.6 3.9 3.5 3.2 3.2 35% 3.3 3.8 3.7 3.5 2.6 2.5 2.7 2.8 3.2 2.8 3.7 3.0 4.1 4.1 3.5 3.3 40% 3.8 4.6 4.0 3.8 2.7 3.0 2.8 2.6 3.3 2.6 3.4 3.4 4.2 4.4 4.1 3.5 45% 3.8 4.0 3.8 3.7 2.3 2.8 3.2 3.0 3.4 2.8 3.0 3.4 3.3 4.2 4.0 3.4 50% 2.8 2.9 2.5 3.0 2.2 2.5 2.9 2.9 2.8 2.8 2.4 2.6 2.8 3.4 3.2 2.8 55% 2.2 2.2 2.3 2.4 1.7 2.0 2.1 2.5 2.3 2.2 2.0 2.2 2.2 2.6 2.8 2.2 60% 1.9 1.9 1.9 2.1 1.3 1.4 1.6 1.8 2.0 1.9 1.5 1.7 1.8 2.3 2.2 1.8 65% 1.9 2.0 1.8 2.1 1.3 1.6 1.6 2.1 1.7 1.9 1.4 1.9 1.6 2.2 2.1 1.8 70% 2.0 2.3 2.1 2.3 1.6 1.9 2.1 1.8 1.9 2.1 1.8 2.4 1.8 2.6 2.6 2.1 75% 2.5 3.0 2.4 3.0 1.8 2.1 2.7 2.1 2.4 2.6 2.4 2.9 1.8 2.6 2.7 2.5 80% 3.7 3.6 3.6 3.8 2.3 2.9 3.2 3.4 3.2 3.0 3.2 2.9 3.1 3.1 3.4 3.2 a
Mean image quality scores from consensus ratings for each reconstruction interval in all patients (n=80)
Fig. 1a–d Volume-rendered images and curved-planar reconstruc-tions of the RCA (arrows) at different reconstruction intervals in a 52-year-old male patient with a mean heart rate of 63 bpm. a At 20% of the R-R interval, image quality was reduced in the proximal (severe blurring) and distal segment (discontinuity). Image quality scores were: proximal RCA, score 4; mid RCA, score 2; and distal RCA, score 4. b At 40%, image quality with severe artifacts occurred in all segments. Image quality ratings were: proximal
RCA, score 4; mid RCA, score 4; and distal RCA, score 5. c At 60%, the vessel outlines are sharply demarcated and the side branches are well-defined. Consequently, image quality ratings were excellent (score 1) for all segments. d At 80%, the proximal RCA shows mild blurring that does not preclude diagnostic evaluation, while discontinuities in the course of the mid and distal segment impair evaluation. Image quality ratings were: proximal RCA, score 2; mid RCA, score 5; and distal RCA, score 4
T able 3 Number and percent of coronary segments with excellent (score 1), good to excellent (score 1 o r 2), or at least acceptable image quality (scores 1– 3) of all patients (n =80), patients with an average heart rate <65 bpm (n =49), and with an average heart rate ≥ 65 bpm (n =31) according to the reconstruction interval (HR heart rate) R-R interval Excellent image quality (score 1) a Excellent to good image quality (score 1 o r 2 ) a Acceptable image quality (scores 1– 3) a All patients HR<65 bpm HR ≥ 65 bpm All patients HR<65 bpm HR ≥ 65 bpm All patients HR<65 bpm HR ≥ 65 bpm 20% 3.9% (46/1,172) 4.1% (30/727) 3.6% (16/445) 44.9% (526/1,172) 44.3% (322/727) 45.8% (204/445) 87.3% (1023/1,172) 86.8% (631/727) 88.1% (392/445) 25% 3.6% (42/1,172) 1.2% (9/727) 7.4% (33/445) 43.5% (510/1,172) 40.0% (291/727) 49.2% (219/445) 81.2% (952/1,172) 80.5% (585/727) 82.5% (367/445) 30% 7.3% (85/1,172) 5.8% (42/727) 9.7% (43/445) 32.1% (376/1,172) 30.3% (220/727) 35.1% (156/445) 72.4% (848/1,172) 70.6% (513/727) 75.3% (335/445) 35% 2.6% (30/1,172) 2.2% (16/727) 3.1% (14/445) 24.6% (288/1,172) 24.8% (180/727) 24.3% (108/445) 60.3% (707/1,172) 58.7% (427/727) 62.9% (280/445) 40% 4.9% (57/1,172) 6.2% (45/727) 2.7% (12/445) 19.5% (228/1,172) 22.0% (160/727) 15.3% (68/445) 51.7% (606/1,172) 52.8% (384/727) 49.9% (222/445) 45% 8.8% (103/1,172) 10.7% (78/727) 5.6% (25/445) 24.7% (290/1,172) 29.2% (212/727) 17.5% (78/445) 53.6% (628/1,172) 58.5% (425/727) 45.6% (203/445) 50% 12.8% (150/1,172) 16.4% (1 19/727) 7.0% (31/445) 43.9% (515/1,172) 52.7% (383/727) 29.7% (132/445) 73.4% (860/1,172) 78.5% (571/727) 64.9% (289/445) 55% 25.0% (293/1,172) 31.1% (226/727) 15.1% (67/445) 61.9% (725/1,172) 72.2% (525/727) 44.9% (200/445) 90.5% (1,061/1,172) 93.4% (679/727) 85.8% (382/445) 60% 39.5% (463/1,172) 45.3% (329/727) 30.1% (134/445) 80.2% (940/1,172) 88.4% (643/727) 66.7% (297/445) 99.1% (1,162/1,172) 100% (727/727) 97.8% (435/445) 65% 42.7% (501/1,172) 49.0% (356/727) 32.6% (145/445) 78.2% (917/1,172) 85.4% (621/727) 66.5% (296/445) 98.9% (1,159/1,172) 99.7% (725/727) 97.5% (434/445) 70% 34.8% (408/1,172) 41.0% (198/727) 24.7% (1 10/445) 67.2% (788/1 172) 73.3% (533/727) 57.3% (255/445) 92.0% (1,078/1 172) 95.2% (692/727) 86.7% (386/445) 75% 19.3% (226/1,172) 23.4% (170/727) 12.6% (56/445) 51.5% (604/1,172) 59.3% (431/727) 38.9% (173/445) 83.7% (981/1,172) 89.0% (647/727) 75.1% (334/445) 80% 3.1% (36/1,172) 4.0% (29/727) 1.6% (7/445) 25.9% (304/1,172) 30.8% (224/727) 18.0% (80/445) 62.1% (728/1,172) 67.1% (488/727) 53.9% (240/445) a Scor e 1 no motion artifacts; scor e 2 minor artifacts; scor e 3 moderate artifacts; scor e 4 severe artifacts; no vessel segment was rated as being not evaluative (scor e 5 ). Calculations were performed for each reconstruction interval for all patients (n =80) and for the subgroup of patients with heart rates <65 bpm and ≥ 65 bpm
significantly better at heart rates <65 bpm for the recon-struction intervals from 45 to 80% (P<0.05), whereas no significant differences were present for reconstructions
during systole (20–40% of the R-R interval).
In the segments where excellent image quality was not
present (i.e., scores 2–5) at 60% of the R-R interval
(709/1,172, 61%), excellent image quality (score 1) could be obtained by additional reconstructions in diastole for 26% of the segments (184/709) and by using diastolic and systolic reconstructions in 28% of the segments (196/709). At heart rates <65 bpm, image quality was not excellent in 55% of the segments (398/727) at 60% of the R-R interval. While additional reconstructions during diastole yielded excellent image quality in 33% of the segments (131/398), systolic reconstructions did not increase the number of segments with excellent image quality when compared to
reconstructions at diastole. At heart rates≥65 bpm, the 60%
reconstruction interval did not provide excellent image quality in 69.9% of the segments (311/445). Additional diastolic reconstructions provided excellent image quality in 14% of the segments (53/311), while systolic recon-structions yielded additional excellent image quality in 4% of the segments (12/311).
Table3demonstrates the numbers and percentages of all
coronary segments with excellent (score 1), good to excellent (score 1 or 2), and diagnostic, i.e., acceptable
image quality (scores 1–3) at different reconstruction
intervals. Diagnostic image quality was observed at 60% of the R-R interval in all coronary segments when the heart rate was <65 bpm. There was no significant difference with regard to image quality between the intervals 60%, 65%, and 70% but to all other reconstruction intervals (P<0.01).
At heart rates≥65 bpm, significantly more segments were
visualized with acceptable image quality by using a 60% or 65% reconstruction interval than compared with the other reconstruction intervals (P<0.01).
Figure2shows the percentage of patients with
diagnos-tic image quality (scores 1–3) of all coronary segments.
The reconstruction interval at 60% provides an acceptable image quality for diagnostic purposes in all coronary segments in patients with an average heart rate <65 bpm. In
only 87% (27/31) of the patients with a heart rate≥65 bpm,
acceptable image quality of all coronary segments was obtained at a single reconstruction interval at 60%. In four patients with a heart rate of 72 bpm, 77 bpm, 78 bpm, and 81 bpm, respectively, a total of ten segments were rated as non-diagnostic (i.e., image quality scores 4 and 5) in any reconstruction interval. These ten segments were evenly distributed throughout the coronary artery tree (RCA, n=3;
LAD, n=2; LCX, n=5). Figure 3 visualizes the coronary
artery tree in one of these patients with heart rates >65 bpm.
Discussion
Two different types of motion artifacts generally occur with coronary CT angiography: stair-step and blurring artifacts [20]. Stair-step artifacts may result either from respiratory motion or from variations in heart rate during breath-hold. Usually, heart rate acceleration occurs in the latter part of breath-hold, resulting in axial slices, differing in their cardiac phase, although acquired in the same time-frame of the R-R interval [20]. Blurring artifacts occur when the motion velocity of the coronary segment of interest exceeds the temporal resolution of the CT technique. In coronary CT angiography with four- and 16-detector-row CT, lowering of the heart rate or individual selection of an appropriate reconstruction interval for the coronary
seg-ments was mandatory to reduce blurring artifacts [9,10,12,
21]. The increased temporal resolution provided by the decreased gantry rotation time of the 64-slice CT system apparently allows imaging of nearly all coronary segments
Fig. 2 Percent of patients with acceptable image quality (scores 1–3) in all coronary segments at different reconstruction intervals. From end-systole to early diastole (35–45% of the R-R interval), acceptable image quality of all segments was not observed in any patient. At 60%, acceptable image quality was obtained for all segments in all patients with a heart rate below 65 bpm
with acceptable image quality in the mid-diastolic phase, even when the diastolic rest-period shortens with elevated heart rates.
To the best of our knowledge, no studies exist to date on image quality and optimal reconstruction interval with 64-slice CT, whereas several studies addressed this issue with
former CT scanner types [7–12, 21]. With
four-detector-row CT, the phase of reconstruction was individually chosen depending on the coronary artery of interest (e.g.,
LAD was best visualized at 50–70%, LCX at 50–60%, and
the RCA at 40–50% of the R-R interval) [7–9]. When using
a 16-slice CT system with a 420-ms gantry rotation time, Hoffmann et al. [21] observed the 80% interval to be optimal for lower heart rates, while with higher heart rates less motion artifacts occurred at 50%. When using 16-slice CT coronary angiography with a gantry rotation time of 370 ms, the optimal image reconstruction interval was commonly found in mid-diastole for all coronary arteries. Hamoir et al. [10] investigated the image quality in different diastolic time-points by applying an absolute reverse reconstruction method. In their study, only 1.9% of the coronary segments were scored as being not assessable due
to motion artifacts. Best image quality was obtained at−350
and−400 ms time-points, which corresponds to a relative
reconstruction interval of approximately 60–65% at the
mean heart rate of 60.5 bpm in their study. Sanz et al. [12] investigated the impact of diastolic and end-systolic reconstructions on image quality. Although mid-diastolic
reconstructions at 60–70% presented the best image quality,
the combination of end-systolic and mid-diastolic recon-structions offered superior image quality and less non-evaluative vessels than even larger numbers of diastolic reconstructions alone. In a recently published study by Bley et al. [11], the authors found the best reconstruction interval to be at 60% for most patients, while with higher heart rates the best reconstruction window was found at an earlier stage in the cardiac cycle. The results of our study indicate, that with 64-slice CT additional reconstruction during systole are no longer necessary, even at higher heart rates. Although at heart rates above 65 bpm, 4% of the segments had a better image quality in systole when compared with diastole, image quality of all these segments in diastole was found to be diagnostic; therefore, additional reconstructions in systole are not mandatory.
CT coronary angiography is characterized by a substantial inherent radiation with recent 64-slice CT studies reporting effective doses of up to 21.4 mSv [4]. For dose reduction in cardiac CT, the technique of ECG-controlled tube current modulation has been introduced [13], which is characterized by a nominal tube output during mid- to end-diastole and by Fig. 3 Curved-planar
recon-structions of the RCA (a), the LAD (b), and the LCX (c) at 60% of the R-R interval in a 64-year-old female patient with a mean heart rate during scanning of 78 bpm. Image quality was scored as being diagnostic in all segments except of the distal segment of the LCX due to severe blurring (score 4; arrow-heads in c). Different recon-struction intervals from 20 to 80% of the R-R interval of this coronary segment demonstrate non-diagnostic image quality in every reconstruction
a reduction of tube output to approximately 20% during other parts of the cardiac cycle. Applying this technique has shown to lead to a dose reduction of 48% for males and 45% for females, respectively [13]. Interestingly, all 64-slice CT
studies so far [1–5] have not applied this technique, most
probably to allow for reconstructing images at other parts of the cardiac cycle when image quality of the coronary arteries during diastole has been found to be non-diagnostic. The results of this study indicate that 64-slice CT image reconstruction can be limited to a time interval during mid-diastole which represents the basis for utilizing the technique of ECG-pulsing in future coronary artery CT studies. With 64-slice CT, beta-blockers are needed in patients with higher heart rates to visualize all coronary segments with a diagnostic image quality in a single reconstruction time-interval, but not to improve the rate of evaluative coronary segments, as was the case in previous 16-detector-row CT
studies [22,23].
The following study limitations have to be acknowl-edged. First, because of incomplete catheter angiography data, we did not include assessment of coronary artery stenosis to prove our scoring threshold of diagnostic image quality. Nineteen patients admitted to CT coronary angi-ography for evaluation of suspected coronary artery stenosis refused to undergo catheter angiography because of negative findings on CT. Therefore, we decided to omit the assessment of coronary artery stenosis to avoid selection bias to our results. A second limitation is the subjective nature of the image quality analysis. However, a kappa value of 0.71 indicates a good inter-observer agreement and may argue against subjectivity bias. Third, our definition for the cut-off for heart rates at 65 bpm appears to be relatively arbitrary. On the other hand, the cut-off point was chosen according to recommendations for the administration of beta-blockers with 16-slice CT at
heart rates above 65 bpm [22,23] and from first 64-slice
CT studies, which defined the threshold for medication at
65–70 bpm [2–5].
Conclusions
The results of this study provide useful information about the optimal reconstruction interval for coronary artery imaging with 64-slice CT. Two main conclusions can be drawn. First, 64-slice CT coronary angiography provides best image quality in mid-diastole at 60% and 65%, irrespective of the mean heart rate during scanning. Second, at heart rates <65 bpm, diagnostic image quality of all coronary segments is obtained at a single recon-struction interval of 60%, which obviates the need for individual image reconstruction and data analysis at numerous time intervals throughout the cardiac cycle. In patients with higher heart rates, administration of beta-bockers to lower the heart rate can be recommended to visualize with a diagnostic image quality all coronary segments in a single reconstruction time interval. Image reconstruction at one time interval during diastole also provides the rationale to implement the ECG-controlled tube current modulation technique [13] in order to substantially reduce the applied radiation dose to the patient. Furthermore, time for data reconstruction and the amount of data to be handled for diagnostic purposes would be considerably reduced.
Acknowledgements This research has been supported by the National Center of Competence in Research, Computer Aided and Image Guided Medical Interventions of the Swiss National Science Foundation, and by the Georg und Bertha Schwyzer-Winiker-Stiftung, Switzerland.
References
1. Leschka S et al (2005) Accuracy of MSCT coronary angiography with 64-slice technology: first experience. Eur Heart J 26:1482–1487
2. Raff GL, Gallagher MJ, O’Neill WW, Goldstein JA (2005) Diagnostic accu-racy of noninvasive coronary angiog-raphy using 64-slice spiral computed tomography. J Am Coll Cardiol 46:552–557
3. Leber AW et al (2005) Quantification of obstructive and nonobstructive coro-nary lesions by 64-slice computed tomography: a comparative study with quantitative coronary angiography and intravascular ultrasound. J Am Coll Cardiol 46:147–154
4. Mollet NR et al (2005) High-resolution spiral computed tomography coronary angiography in patients referred for diagnostic conventional coronary angi-ography. Circulation 112:2318–2323 5. Pugliese F et al (2005) Diagnostic
accuracy of non-invasive 64-slice CT coronary angiography in patients with stable angina pectoris. Eur Radiol:1–8
6. Flohr TG, Stierstorfer K, Ulzheimer S, Bruder H, Primak AN, McCollough CH (2005) Image reconstruction and image quality evaluation for a 64-slice CT scanner with z-flying focal spot. Med Phys 32:2536–2547
7. Giesler T et al (2002) Noninvasive visualization of coronary arteries using contrast-enhanced multidetector CT: influence of heart rate on image quality and stenosis detection. AJR Am J Roentgenol 179:911–916
8. Hong C et al (2001) ECG-gated reconstructed multi-detector row CT coronary angiography: effect of varying trigger delay on image quality. Radiology 220:712–717
9. Kopp AF et al (2001) Coronary arte-ries: retrospectively ECG-gated multi-detector row CT angiography with selective optimization of the image reconstruction window. Radiology 221:683–688
10. Hamoir XL et al (2005) Coronary arteries: assessment of image quality and optimal reconstruction window in retrospective ECG-gated multislice CT at 375-ms gantry rotation time. Eur Radiol 15:296–304
11. Bley TA et al (2005) Computed tomo-graphy coronary angiotomo-graphy with 370-millisecond gantry rotation time: evaluation of the best image recon-struction interval. J Comput Assist Tomogr 29:1–5
12. Sanz J et al (2005) The importance of end-systole for optimal reconstruction protocol of coronary angiography with 16-slice multidetector computed tomo-graphy. Invest Radiol 40:155–163 13. Jakobs TF et al (2002) Multislice helical CT of the heart with retro-spective ECG gating: reduction of radiation exposure by ECG-controlled tube current modulation. Eur Radiol 12:1081–1086
14. Kachelriess M, Ulzheimer S, Kalender WA (2000) ECG-correlated image re-construction from subsecond multi-slice spiral CT scans of the heart. Med Phys 27:1881–1902
15. Flohr T, Ohnesorge B (2001) Heart rate adaptive optimization of spatial and temporal resolution for electrocardio-gram-gated multislice spiral CT of the heart. J Comput Assist Tomogr 25: 907–923
16. Austen WG et al (1975) A reporting system on patients evaluated for coro-nary artery disease. Report of the Ad Hoc committee for grading of coronary artery disease, council on cardiovascu-lar surgery, American heart association. Circulation 51:5–40
17. Shim SS, Kim Y, Lim SM (2005) Improvement of image quality with beta-blocker premedication on ECG-gated 16-MDCT coronary angiography. AJR Am J Roentgenol 184:649–654
18. Cohen J (1960) A coefficient of agreement for nominal scales. Educ Psychol Meas 20:37–46
19. Landis JR, Koch GG (1977) The measurement of observer agreement for categorical data. Biometrics 33: 159–174
20. Choi HS et al (2004) Pitfalls, artifacts, and remedies in multi- detector row CT coronary angiography. Radiographics 24:787–800
21. Hoffmann MH et al (2005) Noninva-sive coronary angiography with 16-detector row CT: effect of heart rate. Radiology 234:86–97
22. Nieman K, Cademartiri F, Lemos PA, Raaijmakers R, Pattynama PM, de Feyter PJ (2002) Reliable noninvasive coronary angiography with fast sub-millimeter multislice spiral computed tomography. Circulation 106: 2051–2054
23. Cademartiri F et al (2005) Diagnostic accuracy of multislice computed tomo-graphy coronary angiotomo-graphy is im-proved at low heart rates. Int J Cardiovasc Imaging:1–5