Research Articles
Effects of Lindane on the Photosynthetic Apparatus of the Cyanobacterium Anabaena
Fluorescence Induction Studies and Immunolocalization of Ferredoxin-NADP + ReductaseMarta Bueno t, Maria E FiUat 1, Reto J. Strasse#, Ronald Maldonado-Rodriguez 2, Nerea Marina 1, Henry Smienk t, Carlos G6mez-Moreno 1 and Francisco Barja 3"
Department of Biochemistry and Molecular and Cell Biology, Faculty of Sciences, Pedro Cerbuna 12, University of Zaragoza, Spain 2 Bioenergetics Laboratory, University of Geneva, Chemin des Embrouchis 10, CH-1254 Jussy-Geneva, Switzerland
3 Bioenergetics and Microbiology Laboratory, 10 Chemin des Embrouchis, CH-1254 Jussy, Switzerland * Corresponding author ([email protected])
DOh http:Hdx.doi.or _o/10.1065/esor2003.10.175
Abstract
Intention, Goal, Scope, Background. Cyanobacteria have the natural ability to degrade moderate amounts of organic pollut- ants. However, when pollutant concentration exceeds the level of tolerance, bleaching of the cells and death occur within 24 hours. Under stress conditions, cyanobacterial response includes the short-term adaptation of the photosynthetic apparatus to light quality, named state transitions. Moreover, prolonged stresses produce changes in the functional organization of phycobilisomes and in the core-complexes of both photosystems, which can result in large changes in the PS II fluorescence yield. The localization of ferredoxin-NADP" reductase (FNR) at the ends of some peripheral rods of the cyanobacterial phyco- bilisomes, makes this protein a useful marker to check phyco- bilisome integrity.
Objective. The goal of this work is to improve the knowledge of the mechanism of action of a very potent pesticide, lindane (y-hexaclorociclohexane), in the cyanobacterium Anabaena sp., which can be considered a potential candidate for bioremediation of pesticides. We have studied the effect of lindane on the pho- tosynthetic apparatus of Anabaena using fluorescence induc- tion studies. As ferredoxin-NADP" reductase plays a key role in the response to oxidative stress in several systems, changes in synthesis, degradation and activity of FNR were analyzed. Immunolocalization of this enzyme was used as a marker of phycobilisome integrity. The knowledge of the changes caused by lindane in the photosynthetic apparatus is essential for ra- tional further design of genetically-modified cyanobacteria with improved biorremediation abilities.
Methods. Polyphasic chlorophyll a fluorescence rise measure- ments (OJIp) have been used to evaluate the vitality and stress adaptation of the nitrogen-fixing cyanobacterium Anabaena PCC 7119 in the presence of increasing concentrations of lindane. Effects of the pesticide on the uhrastructure have been investi- gated by electron microscopy, and FNR has been used as a marker of phycobilisome integrity.
Results and Discussion. Cultures of Anabaena sp. treated with moderate amounts of lindane showed a decrease in growth rate followed by a recovery after 72 hours of pesticide treatment. Concentrations of lindane below 5 ppm increased the photo- synthetic performance and activity of the cells. Higher amounts
of pesticide caused a decrease in these activities which seems to be due to a non-competitive inhibition of PS II. Active PS II units are converted into non-QA reducing, so called heat sink centers. Specific activity and amount of FNR in lindane-treated cells were similar to the values measured in control cultures. Release of FNR from the thylakoid after 48 hours of exposure to 5 ppm of lindane towards the cytoplasm was detected by immunogotd labeling and electron microscopy.
Conclusions. From these results, we conclude that the photo- synthetic performance and activity of the cells are slightly in- creased in the presence of lindane up to 5 ppm. Moreover, in those conditions, lindane did not produce significant changes in the synthesis, degradation or activity of FNR. The high capabil- ity of Anabaena to tolerate lindane makes this cyanobacterium a good candidate for phytoremediation of polluted areas. Recommendation and Outlook. The results of this study show that cultures of Anabaena PCC 7119 tolerate lindane up to 5 ppm, without significant changes in the photosynthetic vitality index of the cells. However, a slight increase in phycobiliprotein synthesis is observed, which is related to total protein content. This change might be due to degradation of proteins less stable than phycobiliproteins. An identification of the proteins with altered expression pattern in the presence of the pesticide remains the subject of further work and will pro- vide valuable information for the preparation of strains which are highly tolerant to lindane.
Keywords: Anabaena, cyanobacterium; Chl a fluorescence; core
complexes of PSI and PS II; cyanobacteria; ferredoxin-NADP+ reductase; fluorescence induction studies; immunolocalization; JIP-test; lindane; PEA (Plant Efficiency Analyzer); phycobili- somes; stress adaptation; vitality
Abbreviations: CS, cross section of the sample; DI, dissipated flux; ET, energy flux for electron transport; F0, FM, initial and maximum Chl a fluorescence; J, I, intermediate steps of Chl a fluorescence rise between F 0 and peak (P); kN, non-photochemi- cal, de-excitation rate constant; kp, photochemical de-excitation rate constant; cpEo, probability that an absorbed photon will move an electron into the electron transport chain; q)po. maximum quan- tum yield of primary photochemistry; ~o, efficiency with which a trapped exciton can move an electron into the electron transport chain; QA, primary bound plastoquinone; QB, secondary bound plastoquinone; RC, reaction center; TR, energy flux for trapping
Research Articles
Effects of Lindane on
Anabaena
Introduction
Cyanobacteria are phototrophic organisms which constitute the most important producers of organic carbon and fixed nitrogen in fresh and sea-waters contributing to the fertility of natural and cultivated habitats (Fay 1992). To perform oxygenic photosynthesis, cyanobacteria contain chlorophyll a and phycobilisomes which deliver most light energy ab- sorbed by phycobiliproteins to PS II reaction centers under normal growth conditions (Wang and Myers 1973). Struc- ture and composition of phycobilisomes have been studied extensively (Glazer 1989, Sidler 1994). These supramolecular complexes are constructed from a core substructure con- taining phycobiliproteins and peripheral rods that are ar- ranged in a hemidiscoidal fashion around that core. Ferre- doxin-NADP, reductase (FNR) is localized at the end of some peripheral rods of the phycobilisomes through the interac- tion of a CpcD-like domain found at the N-terminus of this enzyme (van Thor et al. 1999). This particular organization of the photosynthetic apparatus, together with the ability of some strains to fix nitrogen, are both decisive for the eco- logical success of cyanobacteria.
Moreover, cyanobacteria have developed diverse mechanisms for sensing and acclimating to changes in their environment. Differences in light quality and intensity, nutrient availabil- ity or the presence of toxic substances induce responses that include an alteration of light-harvesting complexes synthe- sis and degradation, changes in the ratio or substitution of soluble redox carriers and heterocyst differentiation, among other processes (Bryant 1994). The extreme adaptability of some cyanobacterial strains makes them able to tolerate or even metabolize moderate doses of several insecticides and pesticides (DaSilva et al. 1975, Kuritz and Wolk 1995). Among the pesticides found in rice fields and fresh water ponds, lindane is one of the most toxic to the cells. Biodeg- radation of lindane by cyanobacteria has been reported in
Anabaena cultures supplemented with 0.5 ppm of the pesti-
cide and it seems to be dependent of a functional nir operon (Kuritz et al. 1997). However, higher concentrations of lin- dane are toxic to the cyanobacteria, as well as seen to pro- duce a drastic inhibition of chlorophyll and protein con- tents (Suresh Babu et al. 2001). Data available on the tolerance of lindane by cyanobacteria are controversial. Per- formance of the cells in the presence of the pesticide seems to be dependent on different parameters, such as the cyano- bacterial strain, the presence of nitrate in the medium or the starting density of the culture (Das and Singh 1978, Suresh Babu et al. 2001). Moreover, little is known about the influ- ence of lindane on the metabolism of cyanobacteria. Since the photosynthetic apparatus is tightly connected to the other principal metabolic paths, chlorophyll fluorescence signals can provide rapid information on both photosynthesis and the overall acclimation status of the cells (Campbell et al. 1998, Strasser et al. 1995). Under stress conditions, cyano- bacterial response includes short-term adaptation of the photosynthetic apparatus to light quality, which are known as state transitions. Moreover, prolonged stresses produce changes in the functional organization of phycobilisomes and in the core-complexes of both photosystems, which can result in large changes in the PS II fluorescence yield (Strasser et al. 2000).
In this work, polyphasic chlorophyll a fluorescence rise meas- urements (OJIP) have been used to evaluate the vitality and stress adaptation of the nitrogen-fixing cyanobacterium
Anabaena PCC 7119 in the presence of increasing amounts
of lindane. Effects of the pesticide on the ultrastructure have been investigated by electron microscopy and FNR has been used as a marker of phycobilisome integrity.
An optimized use of cyanobacteria in bioremediation requires an extensive study of the effects of several xenobiotics in order to characterize the cell response. Detailed analysis of fluorescence patterns can be used to discriminate different modes of action of environmental pollutants (Brack and Frank 1998). Identification of pesticide targets and changes in protein synthesis and degradation will be essential in bio- technology to prepare genetically engineered strains which are more resistant to pesticides and demonstrate enhanced degradative capabilities.
1 Materials and Methods
1.1 Growth conditions and pesticide treatments
Anabaena sp. PCC 7119 was grown at 25~ in BG-11 me-
dium (Rippka et al. 1979) supplemented with a filtered-steri- lized solution of N a H C O 3 to a final concentration of 2.54 g/l. Cultures were placed in 500 ml sealed bottles contain- ing 200 ml of medium and shaken at 100 rpm during 72 h with illumination of 6 watt/m 2.
Pesticide treatments were carried out in cultures in logarith- mic phase of growth adding lindane h'-hexachlorocyclohex- ane, Sigma-Aldrich Co.) at increasing concentrations rang- ing from 1 to 15 ppm. To prevent pesticide degradation, stock solutions were prepared just before each experiment dissolving lindane in 100% ethanol. The effect of ethanol is negligible in our experiments. Bacterial growth was moni- tored by measuring optical density at 600 nm. The amount of chlorophyll a was determined by extraction with metha- nol according to Mackinney (1941) and expressed in milli- grams per milliliter of Anabaena culture.
1.2 Fluorescence measurements
Chlorophyll a fluorescence transients were measured by a PEA fluorometer (Plant Efficiency Analyzer, Hansatech In- struments Ltd., King's Lynn, Norfolk, UK) using an actinic light intensity of 600 Wm -2 red light with a center excita- tion wavelength of 650 nm. The actinic light of the PEA was provided by an array of six light emitting diodes (LED) which were focused in the bottom of the bottle. Chlorophyll a fluo- rescence was detected by a photodiode located behind a long pass filter (50% transmission at 720 nm). Chlorophyll a fluo- rescence signals were recorded during 1 s with a 10 las time resolution for the first 200 data points, then with I ms for the next 998 points (up to 1 second) and later with a 10 ms time resolution. All experiments were performed in I cm diameter vials using 2 ml of light adapted samples from different cul- tures of cell suspension kept in low room light. The fluores- cence transients were analyzed according to the equations of the JIP-test (Strasser et al. 2000, Strasser and Tsimilli- Michael 2001) with the software package BIOLYZER writ-
ten by R. Maldonado-Rodrlguez and available on the Internet
(http://www.unige.ch/sciences/biologie/bioen). At different
time points, such as 0.05, 0.1, 0.3 and 2 ms, the correspond- ing fluorescence intensities, F1, F2, F3, F 4 , have been extracted
from the fluorescence induction curve. The value F 1 is con- sidered to be representative for the state when all reaction centers are open and this value will be labeled as initial fluo- rescence F 0. The maximal fluorescence value of each fluo- rescence curve is extracted as well and called Fro. The val- ues F 1 and F 3 are used for the calculation of the slope at the origin to the fluorescence kinetics and F 4 = F 2 ms = Fj is taken
as the fluorescence value at the step J of the OJIP transient.
1.3 Cyanobacterial crude extract preparation
Cyanobacterial crude extracts were prepared from 20 ml culture during the exponential phase of growth, collected by centrifugation at 2500 x g and washed in 50 mM Tris- HCI buffer pH 8.0. Cells were disrupted by ultrasonic treat- ment and debris was pelleted by centrifugation for 20 min at 15800 x g in an Eppendorf centrifuge.
1.4 Biochemical analysis
Protein concentration was determined according to Brad- ford (1976). Phycobiliprotein content was quantified fol- lowing the protocol described by Glazer (1976). Cells were harvested by centrifugation, divided into two aliquots and processed immediately for Western analysis and electron microscopy studies. Diaphorase activity of FNR was meas- ured using DCPIP (2,6-dichlorophenol-indophenol) as an artificial electron donor, as described by Sancho et al. (1988).
1.5 Immunodetection of FNR by Western-blot
Antiserum against FNR was obtained according to Razquin et al. (1995) and further purified as follows: in 5 ml of crude serum, to which 0.9 (18% (w/v)) g of sodium sulfate was added. After incubation at room temperature for 30 rain, the solution was centrifuged at 3 000 x g for 30 min at 25~ Supernatant was discarded and the pellet was re-suspended in 2.5 ml of milli-Q water. A second precipitation using so- dium sulfate to 14% (w/v) was performed and the resulting pellet re-suspended in 1.5 ml of milliQ water, dialyzed against 0.07 M phosphate buffer at pH 6.3 and passed through a DEAE column. Several one ml fractions were collected and the recovery of the antiserum was monitored by checking the absorbance at 280 nm.
For Western analysis, SDS-PAGE was performed with Ana-
baena crude extracts containing the soluble proteins and then
electroblotted onto nitrocellulose at 70 V overnight (Bio- Rad trans-blot cell; Bio-Rad, model 200/2.0 Power supply). The membrane was incubated at room temperature for 1 h 30 min in a blocking solution containing TBS (10 mM Tris, 150 mM NaCl, pH 7.5) and 5% BSA, washed twice in TTBS (0.05 % (v/v) Tween-20 in TBS) and subsequently incubated for 1 h with the primary antiserum against FNR diluted 1 : 100. After thorough washing of the membrane in TTBS, the second antibody, goat antirabbit IgG conjugated to horse- radish-peroxidase (Sigma), was applied at a 1 : 100 dilution
in TYBS and incubated for 1 h. Following 4 washes in TBS, peroxidase activity was assessed with 0.5 mg/ml of 3.3'- diaminobenzidine tetrahydrochloride (DAB) (Flucka Chemie) in 100 mM Tris-HCl, pH 7.5 containing 0.03% I-I20 z.
1.6 Electron microscopy and immunogold labeling
Cells were harvested by microcentrifugation at 4000 rpm for 4 rain, and then fixed with 4% paraformaldehyde and 2% glutaraldehyde in 100 mM phosphate buffer (0.1 M NaHzPO4, 0.1 M K2HPO4, pH 7.4) for 2 h at room tem- perature. After fixation, the cells were washed four times for 10 min each in phosphate-buffer, pre-embedded in 1.5% agar at 45"C, dehydrated respectively in 70% and 100% ethanol (for 30 rain each). The samples were then infiltrated sequentially in 2 : 1 (v/v) ethanol: LR White resin (Poly- sciences), 1 : 1 (v/v) ethanol : LR White for 30 rain each, 1 : 2 (v/v) ethanol : LR White for I h and finally 100% LR White for 24 h at 50"C for polymerization.
Ultrathin sections were taken on nickel grids, incubated at room temperature for 2 h in 50 mM phosphate buffer con- taining 2% BSA, 0.05% (v/v) Tween-20, and then for 2 h with the first antibody raised against FNR diluted 1 : 50. The sections were rinsed 3 times with 0.05% Tween-20 in 50 mM phosphate buffer pH 7.0 and incubated for 1 h with secondary antibodies, goat anti-rabbit conjugated to 20 nm gold particles diluted to 1 : 30, in phosphate buffer contain- ing 2% BSA and 0.05% Tween-20. After incubation, sec- tions were washed 3-fold with phosphate buffer, and then fixed in 2% glutaraldehyde in PBS for 2 min (Smith et al. 1992) and finally rinsed in distilled water, stained for 10 min in 2% uranyl acetate, 5 min in Reynold's lead citrate and examined at 60 kV in a Philips M400 transmission elec- tron microscope.
2 Results and Discussion
2.1 Growth of A n a b a e n a sp. PCC 7119 in the presence
of lindane
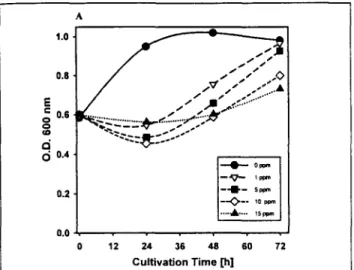
Lindane decreased the growth rate of Anabaena as meas- ured by the optical density at 600 nm (Fig. 1A) as a function of the cultivation time and lindane concentration. Recovery of the cell growth after 24 h of treatment with 1 and 5 ppm of lindane could be observed and the cultures were seen to have reached optical densities similar to the control after 72 h. The increase in cell number was lower in cultures with 10 ppm and 15 ppm of the pesticide. Treatment with concentrations of lindane higher than 15 ppm caused partial bleaching and death of the cells after 24 h (not shown). The recovery could be due to adaptation of the Anabaena cells to the pesticide, together with the ability of this cyanobacterium to metabo- lize moderate doses of lindane. The tolerance observed in our culture conditions was much higher than that reported by Suresh Babu et al. (2001), who observed that the growth of Anabaena was almost completely inhibited in samples treated with 2 ppm lindane. This different behavior of the cells might be due to the use of a different strain of Ana-
baena and to important differences in the culture conditions,
Research Articles
Effects of Lindane on
Anabaena
, 0 0.8 / / T ? s s ~ , , , ' . . & S . . . . ~/..~;..~," ~.-." "" ...~o.6
.:....=.:~p.e.~
5 0.4 0.2 0.0 , 0 12 ~ppm -- 5p~m lo p ~ 15ppm 24 36 48 60 72 Cultivation Time [h]Fig. 1A: Effect of lindane on the growth of Anabaena PCC 7119 moni- tored by optical density of cell culture at 600 nm versus cultivation time
and lindane concentration
absence of nitrate in the culture might also contribute to the lower tolerance since nitrogen fixation and heterocyst for- mation in cyanobacteria are inhibited by lindane (Das and Singh 1978). Consequently, degradation of low doses of lin- dane in cyanobacteria was faster and more efficient in the presence of nitrate (Kuritz and Wolk 1995).
2.2 Effects of lindane on the c h l o r o p h y l l a f l u o r e s c e n c e
Chlorophyll a fluorescence analyses are frequently used to determine the photosynthetic capacity and vitality of plant material. In cyanobacteria, the chlorophyll a fluorescence tran- sients are more difficult to measure accurately due to a very large basal fluorescence (F 0 measured at 50 ps) and a contri- bution of PSI and phycobilin fluorescence (Strasser et al. 1995). Therefore, the influence of the phycobiliprotein content and the variable ratio between PSI and PS II complexes should be taken into account for the interpretation of fluorescence sig- nals (Campbell et al. 1998). This influence of P S I fluores- cence corresponds for each case to a proportionality factor of the signal F 0. The importance of this factor cancels or becomes low due to the fact that 1) the performance index is built out of the ratio of expressions for the same sample and 2) each sample is compared relatively to the control. That means the indicated values of cpp o are underestimated, but the relative variations of cp~o are accurate. Moreover, it is important to distinguish between the photochemical and non-photochemi- cal events which influence the fluorescence signal and which determine the photosynthetic performance and the vitality of the cells (Fig. 1B).
The use of a Plant Efficiency Analyzer (PEA) allows measur- ing the polyphasic chlorophyll a fluorescence transient in
Anabaena cultures in the time range of 50 ps to 1 second in
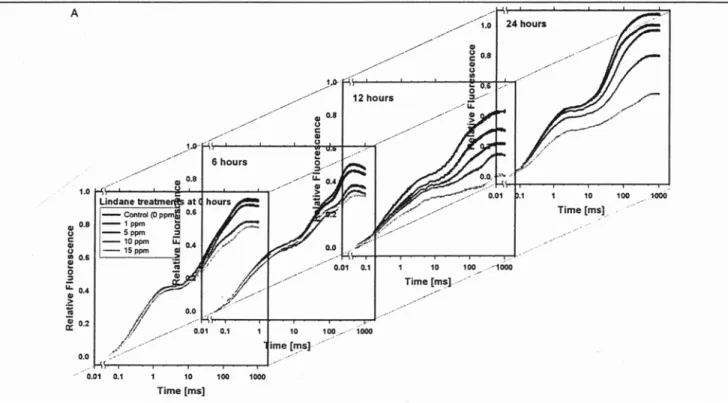
the presence of increasing amounts of lindane as a function of incubation time (Fig. 1C).
The measured raw data of the OJIP fluorescence transients of Anabaena are shown in Fig. 2A. The typically polyphasic
character of the transient was clearly visible by plotting it on a logarithmic time scale. The high time resolution of the
B 300 . ~ 2 8 8 a c 276' e D. 264, "6 252, .E 0 240,
_=
2 2 8 J= 216 ~ 0 p p m 1 --0"- 1 ppm | - ' q p - 5 p p m / /~J~'--~-" ~
/
~
~
0 12 24 36 48 Cultivation Time [h]Fig. 1B: Fraction of phycobiliproteins per total proteins versus cultivation
time and lindane concentration
c 1.0S 1.00 0.95 E 0.90 ,,c
~
- 0.85 o ~1 0.80 0.75 0.70 i--#--- 24h I i-..~,.-.. 48. i I---o-- ~2, I Q ' ' . 9 '~ "'... " " ~ =='---=---l-: =-"-=: =-I . . . .#.. .. . . "_# .\ ... .... "%. '"'.-...,~ CI x % 0 5 10 15 Lindane Concentration [ppm]Fig. l C : Chlorophyll concentration in cell suspension (pg/ml) versus lin- dane concentration and incubation time
OJIP transient measured with the PEA instrument (10 las per data point) makes it possible to distinguish between changes due to primary photochemical reactions or purely non-light (dark) dependent reactions.
Fig. 2B (top) shows the fluorescence transients normalized between F 0 and Fj (or F 2 ms) of the fluorescence transient (corresponding to a normalization between 50 ps and 2 ms) after 24 h of cultures incubated with lindane of 0 to 15 ppm. In the first phase from 0 to 2 ms, the fluorescence signal was dominated by the photochemical single turn over events (pro- ducing reduced Qa) and several dark reactions led to the fully reduced state of PS II after 2 ms, accumulating Qa-Qb 2- and reduced plastoquinone. The difference of each fluores- cence transient (with 1, 5, 10, 15 ppm lindane) minus the control without lindane is shown in Fig. 2B (bottom) with a gain of 2. The induction curves were strictly proportional one to the other in the time range from 0 to about 5 ms (the differences are zero), indicating that no qualitative changes in the photochemical reactions occurred. However, between 50 and 100 ms, a relative increase (relative to the control)
Fig. 2A: Relative fluorescence measurements (V = (F - F0)/(F u - Fo) taken with the PEA portable fluoremeter instrument. The OJIP fluorescence transients (measured with 100% light), plotted on a logarithmic time scale, were measured on cultures treated with different lindane concentrations (0 to 15 ppm) for different incubation times (0 to 24 hours)
Fig. 2B: Top: Ruorescence transients normalized between F o and Fjof the fluorescence transient after 24 h exposure to 0, 1, 5, 10 and 15 ppm lin- dane. Bottom: Differences of each fluorescence transient minus the con- trol, without lindane, plotted with a gain of 2
for the sample with 1 ppm lindane was observed. Lindane from 5 to 15 ppm produced a gradual decrease.
Therefore, a primary action of lindane is located in the biochemical dark reactions. The chlorophyll content per
ml cell suspension (cf. Fig. 1C) showed the same behavior for the incubation of 24 h and a lower chlorophyll accu- mulation in the cell culture for any lindane concentration from 1 to 15 ppm. The question arises about the distinction of the quality and quantity of biomass. A slowed down biomass production did not imply that the produced cells were of lower quality. The notion vitality of a cell was inde- pendent of the growth rate of these cells. Several vitality parameters have been defined, here we used the so-called photosynthetic performance index PIa~ s (Strasser et al. 2000, Strasser and Tsimilli-Michae12001), which is a measure for the photosynthetic performance of the cells on an equal chlo- rophyll basis (where abs stands for the absorption of light by the chlorophylls). The performance index PI~, is con- structed in analogy to the Nernst equation describing the redox potential in physicochemistry. PI~b , is the product of several expressions of the form xi/(1 - %) where x, stands for the fractions of reaction center chlorophyll per total chloro- phyll or excitons trapped by the reaction center per total photons absorbed, or energy conserved in the electron trans- port beyond Qa- per exciton trapped by the reaction center. Therefore, the performance index has the following form:
Plabs
where Y ~'/(] -7) (PPo
=71 (] - 7 ) * ~Opo (I - %,0) * ~o I (l - ~o) (I)
= RC chlorophyll/total a n t e n n a chlorophyll, and = RC chlorophyll/total a n t e n n a chlorophyll = RC/ABS = maximal quantum yield of primary photochemistry = Trapping per absorption
Research Articles Effects of Lindane on
Anabaena
Therefore, q~Po/(1- fl0po)
~ o
r
= T R o / ( A B S - TRo) = kp/k N = Fv/F 0, where kp and k N are de-excitation rate constants for the photochemi- cal or non-photochemical events, respectively = maximum yield of electron transport beyond Qa- per
exciton trapped
= ET o / TR o = (FM-F3)/(FM-Fo) and = q~po. % = ETo/ABS
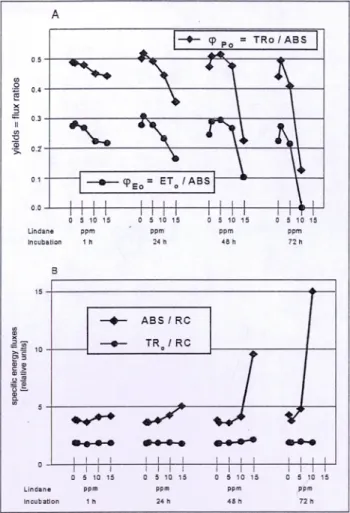
The logarithm of the performance index is therefore the sum of the three components representing the density of RCs, the efficiency of the light reactions and the efficiency of the dark reactions. The variation of performance index PI~b s is shown as a three-dimensional plot in Fig. 3 for the lindane concen- trations of 0 to 15 ppm and for an incubation time from 0 to 72 h. Fig. 3 shows the antagonistic (lindane concentratign above 5 ppm) and synergistic (lindane concentration below 5 ppm) effects of the photosynthetic performance PI with the lindane concentration and the incubation time, representing the dose of lindane exposure. Low lindane concentrations (below 5 ppm) increased the performance of the sample, while lindane concentrations higher than 5 ppm decreased the performance as a function of time and as a function of the lindane concentra- tion. Such an approach was suitable for screenings of dilutions of soil extracts, in analogy to the lindane concentration used here. The performance index is a multiparametric expression and the question arises as to which component of the photo- synthetic system was the target of lindane.
Fig. 3: The three-dimensional graphics show the calculated values of the performance index of PtAa s as a function of the different combinations of time and of the lindane concentration. The control culture (0 ppm, at time 0 h) has been normalized to 1 and used as the comparative reference
Fig. 4A,B shows the maximum quantum efficiency of the primary reactions of photochemistry q%o and the quantum yield for electron transport q%o beyond Qa- (for definitions see above). Both expressions showed a similar trend with an increase from 0 to 5 ppm lindane and a ctecrease for higher lindane concentrations. Therefore, not only the dark reac- tions but also the apparent maximum quantum yield of pri- mary photochemistry q~Po were influenced by lindane. The expression q%o can be deconvoluted into the two structure-
Fig. 4A: The maximum quantum yield of primary photochemistry epo and of
electron transport q~Eo beyond Qa- (bottom) at different times and lindane concentrations. B: Specific energy fluxes measured as absorption flux per reaction center (ABS/RC) and trapping flux per reaction center (TRc'RC)
dependent de-excitation rate constants for photochemical events kp and for non-photochemical events k N (Havaux et al. 1991). The relative rate constant can be expressed with the fluorescence measurements as follows:
k N + kp is proportional to 1IF o
k N is proportional to 1/FM; therefore, kp is proportional to (1/F o - 1/FM)
In this case, kp decreased as a function of time and lindane concentration while k N increased. However, k N increased less than kp decreased so that the sum of all rate constants kN+k P decreased as well. The mechanism for that could be elucidated by Fig. 5.
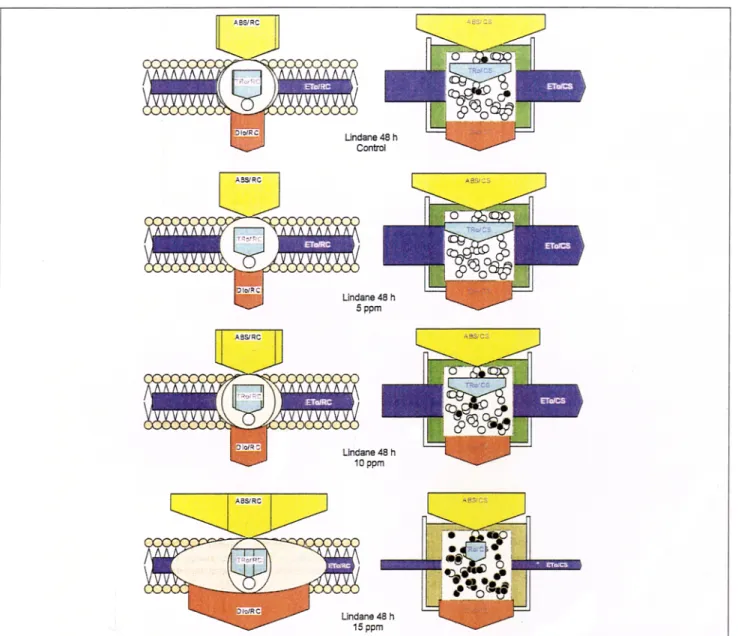
Here, the specific energy fluxes, such as absorption flux per reaction center (ABS/RC) and trapping flux per reaction center (TR0/RC) were shown. According to the JIP test (Strasser et al. 2000), these expressions can be calculated with the experimental signals as follows:
TRo/RC = (F~oo~ s - Fso,s)/(F2m s - F~o,s ) and (2) ABS/RC = (TRo/RC) / (TRJABS) = (TRo/RC) / (F v / % ) (3) Even for high iindane concentrations and long incubation times the trapping flux per a~dve RCs remained nearly unchanged.
Fig. 5: Cell suspension pipeline model (right side) of the phenomenological or appearance energy fluxes (absorption, trapping, dissipation and electron transport) per cross-section and membrane pipeline model (left side) of specific energy fluxes per reaction center. The width of each arrow corresponds to the intensity of the flux. For details see text
However, the apparent antenna size measured as total absorp- tion per active RC increased with time and lindane concentra- tion. As the chlorophyll concentration in the samples decreased, one has to assume that the fraction of active (in the sense of Qa reducing) RCs was strongly decreasing under iindane in- cubation concentrations above 5 ppm.
The constellation of the specific energy fluxes (absorption, trap- ping, dissipation, electron transport) ABS, TR0, DI 0 and ET 0 per RC can be represented with the membrane pipeline model (left side of Fig. 5), and the same apparent or phenomenological fluxes, although per ml of cell-suspension or cross-section (CS), was shown with the ceil-suspension pipeline model (right side of Fig. 5). The incubation time was 48 h and the lindane concen- trations were (from top to bottom) 0, 5, 10, 15 ppm. The width of each arrow represents the intensity of the respective energy flux. Each white small circle indicates active (Qa re- ducing) RCs and each black small circle represents inactive
(non-Qa reducing heat sink or so-called silent) RCs (Krause and Weis
1991,
Kriiger et al. 1997). In the membrane model, the outer oval corresponds to all absorbing pigments per one active RC (small circle) and the inner oval indicates the ab- sorbing pigments, which belong to that active RC. Only the active RCs are responsible for the electron transport per RC or per cross-section. The presented models were calculated with the experimental data. The membrane model showed clearly that the activity of an active PS II expressed, e.g. as electron transport ET0fRC , was quasi-independent of the lin- dane concentration. However, the apparent activity, ET0/CS , of the cells per cross-section (or ml of cell suspension) increased up to a lindane concentration of 5 ppm and decreased sharply for higher lindane concentrations. The decrease in biological activity seemed to be due to a non-competitive inhibition of the PS II multienzyme complex, which transforms active RCs into non-Qa-reducing heat sink centers. The color intensity of the suspension in the model is calculated as well and it repre-Research Articles
Effects of Lindane on Anabaena
sents the chlorophyll concentration of the cell culture or ABS/ CS. For lindane concentrations higher than 10 ppm and incu- bation times of more than 24 h, a fast additional step (K step) (Strasser et al. 2000) was observed in the fluorescence rise leading to a polyphasic transient OKJIP. The appearance of the K step (data not shown) at about 250 to 300 ps is an indi- cation of a partial uncoupling of the oxygen evolving system from the electron transport chain (Strasser 1997, Srivastava et al. 1997).
2.3 Effects on the phycobilisome and ferredoxin-NADP§ reductase
Since phycobilisomes (PBS) carry out the main light-harvest- ing in cyanobacteria, the effects of the pesticide in the struc- ture and composition of PBS will determine the viability and degrading ability of the cultures. Although the polypeptide composition of PBS varies widely among strains of cyano- bacteria, three classes of polypeptides are always present in those macromolecular complexes: phycobiliproteins, linker polypeptides and PBS-associated proteins, such as Ferredoxin- NADP § reductase (FNR), encoded by the petH gene (Sidler 1994). Phycobiliprotein content per total protein indicated that there was not a substantial degradation of phycobiliproteins under the conditions tested (cf. Fig. 1B). A small increase of this ratio was observed after 24 and 48 h of exposure to con- centrations of lindane of 5 ppm and higher, probably due to degradation of proteins less stable than phycobiliproteins. Iden- tification of the proteins, which suffer earlier degradation, will be required to design more resistant Anabaena strains. Although binding of FNR to the phycobilisome is a com- mon characteristic among cyanobacteria (Bryant 1994, Fillat et al. 1993, van Thor et al. 1999), its presence in the com- plex affected neither the distribution of the excitation en- ergy of phycobilisome-absorbed light between both photosystems nor the occurrence of light-state transitions (van Thor et al. 1999). Investigation of changes in the syn- thesis of FNR and its enzymatic activity are of interest for different reasons: 1) dark and salt stresses regulate transcript levels of petH (van Thor et al. 1999); 2) Activity of FNR decreases significantly in low light levels or dark (Fillat et al. 1991); 3) Lindane has been reported as an oxidative stress- ing agent (Banerjee et al. 1999). In E. coli, FNR is part of the soxRS regulon and its expression is considerably in- creased as a response against oxidative stress (Liochev et al. 1994). In higher plants, however, treatment with the redox cycling herbicide methyl viologen (paraquat) causes release of FNR from the thylakoid membranes (Patatnik et al. 1997). Changes in the specific activity of FNR were negligible in the presence of lindane (data not shown). The amount of FNR in control and pesticide-exposed cultures was monitored by Western blot analysis. Fig. 6 shows that there were no varia- tions in the amount of FNR after 48 h of exposure to lindane. The N-terminal domain of the 49 kDa FNR, which serves to attach the flavoprotein to the phycobilisome, seemed to be quite unstable and becomes quickly degraded even in the pres- ence of protease inhibitors during FNR purification (Martinez- Julvez et al. 1996). However, under our conditions, it was remarkable that the observed band pattern was similar even in pesticide-treated cells, with the 49 kDa being the main form,
Fig. 6: Western blot of crude extracts from Anabaena PCC 7119 grown
for 48 h in the presence of 1,5, 10 and 15 ppm of lindane (lanes 2-5); lane
1: control without lindane (C); lane 6: pure FNR. Nitrocellulose membrane
was immunostaining with primary antiserum against FNR and goat antirabbit IgG conjugated to horseradish-peroxidase
followed by the processed protein of 36 kDa and intermedi- ate, partially digested forms being observed to a lower extent.
2.4 Immunolocalization of FNR in control and pesticide treated cells
The position of FNR in the phycobilisome makes this protein a good probe to monitor the integrity of the photosynthetic ap- paratus through immunolocalization. Although exposure to lin- dane did not produce changes in FNR synthesis and activity, immunochemical studies using electron microscopy revealed that the spatial distribution of immunogold labeling of FNR in con- trol ultrathin sections of cyanobacteria was found in the thylakoid membranes and cytoplasm (Fig. 7A). In contrast, labeled grains were found concentrated in the cytoplasm of cyanobacteria in cells treated for 48 h with 5 ppm of lindane (Fig. 7B). As has been reported for higher plants, the release of FNR from the thylakoid membranes in Anabaena could be due to the potential oxidative stress caused by lindane (Banerjee et al. 1999), which did not produce an increase in the synthesis of FNR but solubilization of the enzyme from the phycobilisome.
Fig. 7: Spatial distribution of immunogold labeled ferredoxin-NADP§ - ductase in ultrathin sections of cyanobacteria Anabaena. A. Non treated cells. B. Treated cells with 5 ppm pesticide lindane during 48 h. CW: cell wall; T: thylakoids; CY: cytoplasm; C: carboxysomes
3 Conclusions
Lindane is a widely used pesticide, which also inhibits the photosynthetic activity of Anabaena. Sites of action and mecha- nism of lindane are very different to many herbicides blocking the photosynthetic electron transport at a particular site. The decrease of the photosynthetic activity in Anabaena in the pres- ence of lindane seemed to be due to an inhibition of the PS II complexes inhibiting the excited RC to reduce Qa to Qa-. However, not only the remaining, but the newly synthesized active centers, seemed to tolerate high concentrations of lin- dane for longer times and the cells were able to metabolize and degrade the pesticide during this time. For low concentra- tions of lindane (below 5 ppm), the cells respond with a typi- cal overreaction so that the photosynthetic performance and the photosynthetic activities increased.
The potential oxidative stress caused by lindane did not change the FNR concentration. However, the enzymes were solubilized from the phycobilisome and released to the cy- toplasm. From these results, we can conclude that lindane did not produce significant changes in the synthesis, degra- dation or activity of FNR under the conditions tested. The high capability of Anabaena to tolerate and metabolize fin- dane makes this cyanobacterium a good candidate for phytoremediation of polluted waters.
Acknowledgments. This work was financially supported by Diputaci6n General de Arag6n. The authors would like to thank Dr. Maria Luisa
Peleato and Dr. Mukti Ojha for helpful discussions concerning the
manuscript, and Ricardo Camicer (Erasmus student) for westem blot analysis. We gratefully acknowledge the financial support from the Swiss National Science Foundation, grants N ~ 31-46.860.96 and 31- 52.541.97, as well as the Academic Society of Geneva and Funds
Constantin Topali (F.B.). Thanks are due to Ms. Malou Chappuis for technical support and Ms. Ariane Fehr for secretarial assistance as well as to Ismael Bermudez for assistance with electronic photographs.
References
Baneriee BD, Seth V, Bhartacharya A, Pasha ST, Chakraborty AK (1999): Biochemical effects of some pesticides on lipid peroxidation and flee- radical scavengers. Toxicol Lett 107, 33-47
Brack W, Frank H (1998): Chlorophyll a fluorescence: a tool for the in- vestigation of toxic effects in the photosynthetic apparatus. Ecotoxicol Environ Safety 40, 34--41
Bradford MM (1976): A rapid and sensitive method for the quantitation
of microgram quantities of protein utilizing the principle of proteins- dye binding. Anal Biochem 72, 248-254
Bryant DA (1994): The Molecular Biology of Cyanobacteria (Bryant DA, Ed.), Kluwer Academic Publishers, Dordrecht, The Netherlands, 9O8 pp.
Campbell D, Hurry V, Clarke AK, Gustafsson P, Oquist G (1998): Chlo- rophyll fluorescence analysis of cyanobacterial photosynthesis and acclimation. Microbiol Mol Biol Rev 62, 667-683
Das B, Singh PK (1978): Pesticide (hexachlorocyclohexane) inhibition of growth and nitrogen fixation in blue-green algae Anabaenopsis raciborskii and Anabaena aphanizomenoides. Z allgem Mikrobio118,
161-167
DaSilva EJ, Henriksson LE, Henriksson E (1975): Effect of pesticides on blue-green algae and nitrogen-fixation. Arch Environ Contam Toxicol 3, 193-204
Fay P (1992): Oxygen relations of nitrogen fixation in cyanobacteria. Microbiol Rev 56, 340-373
Fillar MI-, Edmondson DE, Gomez-Moreno C (1991): Light-dependent de-activation/re-activation of Anabaena variabilis ferredoxin: NADP* reductase. Biochem J 274, 781-786
Fillat MF, Flores E, Gomez-Moreno C (1993): Homology of the N-terminal domain of the petH gene product from Anabaena sp. PCC 7119 to the CpcD phycobilisome linker polypeptide. Plant Mol Biol 22, 725-729
Glazer AN (1976): Phycocyanins: Structure and function. Photochem Photobiol Rev 1, 71-115
Glazer AN (1989): Light guides. Directional energy transfer in a photo- synthetic antenna. J Biol Chem 264, 1-4
Havaux M, Strasser RJ, Greppin HA (1991): A theoretical and experi- mental analysis of the q_ and q. coefficients of chlorophyll fluores-
9 I " , ,
cence quenching and thenr relatnon to photochemncal and non photo- chemical events. Photosynth Res 27, 41-55
Krause, GH, Weis E (1991): Chlorophyll fluorescence and photosynthe- sis: the basics. Annu Rev Plant Physiol Plant Mol Biol 42, 313-349 Kriiger GHJ, Tsimilli-Michael M, Strasser RJ (1997): Light stress provokes
plastic and elastic modifications in structure and function of photosystem II in camelia leaves. Physiol Plant 101,265-277
Kurit-z T, Wolk CP (1995): Use of filamentous cyanobacteria for biodeg- radation of organic pollutants. Appl Environ Microbiol 61,234-238 Kuritz T, Bocanera LV, Rivera NS ( 1997): Dechlorination of lindane by the cyanobacterium Anabaena sp. strain PCC7120 depends on the function of the nit operon, j Bacterio1179, 3368-3370
Liochev SI, Hausladen A, Beyer Jr WF, Fridovich I (1994): NADPH: ferre- doxin oxidoreductase acts as a paraquat diaphorase and is a member of the soxRS regulon. Proc Natl Acad Sci USA 91, 1328-1331 Mackinney G (1941): Absortion of light by chlorophyll solutions. J Biol
Chem 140, 315-322
Martinez-Julvez M, Hurley JK, Tollin G, G6mez-Moreno C, Fillat MF ( 1996): Overexpression in E. coli of the complete petH gene product from Anabaena: purification and properties of a 49 kDa ferredoxin- NADP. reductase. Biochim Biophys Acta 1297, 200-206
Palamik JF, Valle EM, Carrillo N (1997): Oxidative stress causes ferre- doxin-NADP § reductase solubilization from the thylakoid membranes in methyl viologen-treated plants. Plant Physiol 115, 1721-1727 Razquin P, Fillat MF, G6mez-Moreno C, Peleato ML (1995): The 36
kDa form of ferredoxin-NADP" reductase from Anabaena co-puri- fies with phycobiliproteins. Bioelectrochem Bioen 38, 57-6 I Rippka R, Deruelles J, Waterbury JB, Herdman M, Stanier RY (1979):
Genetic assignments, strains histories and properties of pure cultures of cyanobacteria. J Gen Microbiol 11, 1-6 I
Sancho J, Peleato ML, G6mez-Moreno C, Edmondson DE (1988): Purifi- cation and properties of ferreduxin-NADP" oxidoreductase from the nitrogen-fixing cyanobacteria Anabaena variabilis. Arch Biochem Biophys 260, 200-207
Sidler WA (1994): Phycobilisome and phycobiliprotein structures. In: Bryant DA (Ed): The Molecular Biology of Cyanobacteria,. Kluwer Academic Publishers, Dordrecht, The Netherlands, pp. 139-216 Smith D, Bendall DS, Howe CJ (1992): Occurrence of a Pbotosystem II
polypeptide in non-photosynthetic membranes of cyanobacteria. Mot Microbio[ 6, 1821-1827
Srivastava A, Guiss6 B, Greppin H, Strasser RJ (1997): Regulation of an- tenna structure and electron transport in photosystem lI of Pisurn sativum under elevated temperature probed by the fast polyphasic chlorophyll a fluorescence transient: OKJIP. Biochim Biophys Acta 1320, 95-106 Strasser BJ ( 1997): Donor side capacity of photosystem II probed by chlo-
rophyll a fluorescence transients. Photosynth Res 52, 147-155 Strasser RJ, Srivastava A, Govindjee (1995): Polyphasic chlorophyll a fluo-
rescence transient in plants and cyanobacteria. Photochem Photobiol 61, 32-42
Strasser RJ, Srivastava A, Tsimilli-Michael M (2000): The fluorescence transient as a tool to characterize and screen photosynthetic samples. In: Yunus M, Pathre U, Mohanthy P (Eds): Probing Photosynthesis, Mechanism, Regulation and Adaptation, Taylor & Francis, London, U.K, pp. 445-483
Strasser RJ, Tsimilli-Michael M (2001): Stress in plants, from daily rhythm to global changes, detected and quantified by the JIP-test. Chimie Nouvelle (SRC) 75, 3321-3326
Suresh Babu G, Hans R, Singh J, Viswanathan PN, Joshi PC (2001): Ef- fect of lindane on the growth and metabolic activities of cyanobacteria. Ecotoxicol Environ Safety 48, 219-221
van Thor JJ, Gruters OWM, Matthijs HCP, Hellingwerf KJ (1999): Lo- calization and function of ferredoxin: NADP" reductase bound to the phycobilisomes of Synechocystis. EMBO J 18, 4128-4136
Wang RT, Myers J (1973): Energy transfer between photosynthetic units analyzed by flash oxygen yield vs. flash intensity. Photochem Photobiol 17, 321-332
Received: February 27th, 2003 Accepted: October 6th, 2003