HAL Id: hal-00119529
https://hal.archives-ouvertes.fr/hal-00119529
Preprint submitted on 11 Dec 2006
HAL is a multi-disciplinary open access
archive for the deposit and dissemination of
sci-entific research documents, whether they are
pub-lished or not. The documents may come from
teaching and research institutions in France or
abroad, or from public or private research centers.
L’archive ouverte pluridisciplinaire HAL, est
destinée au dépôt et à la diffusion de documents
scientifiques de niveau recherche, publiés ou non,
émanant des établissements d’enseignement et de
recherche français ou étrangers, des laboratoires
publics ou privés.
Interferometric observations of eta Carinae with
VINCI/VLTI
Pierre Kervella
To cite this version:
hal-00119529, version 1 - 11 Dec 2006
December 11, 2006
Interferometric observations of
η
Carinae with VINCI/VLTI
(Research Note)
P. Kervella
LESIA, UMR 8109, Observatoire de Paris-Meudon, 5, place Jules Janssen, F-92195 Meudon Cedex, France Received ; Accepted
ABSTRACT
Context.The bright star η Carinae is the most massive and luminous star in our region of the Milky Way. Though it has been extensively studied using many different techniques, its physical nature and the mechanism that led to the creation of the Homunculus nebula are still debated.
Aims.We aimed at resolving the central engine of the η Carinae complex in the near-infrared on angular scales of a few milliarcseconds.
Methods.We used the VINCI instrument of the VLTI to recombine coherently the light from two telescopes in the K band.
Results.We report a total of 142 visibility measurements of η Car, part of which were analyzed by Van Boekel et al. (2003). These observations were carried out on projected baselines ranging from 8 to 112 meters in length, using either two 0.35 m siderostats or two 8-meter Unit Telescopes. These observations cover the November 2001 - January 2004 period.
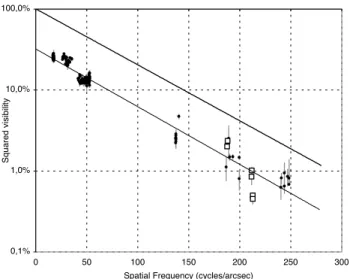
Conclusions. The reported visibility data are in satisfactory agreement with the recent results obtained with AMBER/VLTI by Weigelt et al. (2006), asuming that the flux of η Car encircled within 70 mas reaches 56% of the total flux within 1400 mas, in the K band. We also confirm that the squared visibility curve of η Car as a function of spatial frequency follows closely an exponential model.
Key words.Stars: individual: η Car, Stars: circumstellar matter, Technique: interferometric
1. Introduction
ηCarinae, the brightest example of the S Doradus class of stars, is the most massive, most luminous star in our region of the Milky Way. Over the last two hundred years η Car has shown many signs of violent activity, with in particular a spectacu-lar eruption in the 1840s that created the Homunculus neb-ula. The study of η Car raises important questions about how the most massive stars may end their lives. The central object was studied by Weigelt & Ebersberger (1986) and Falcke et al. (1996) using speckle interferometry at an angular resolution of the order of 30 milliarcsecond (mas). This revealed a com-plex structure with several equatorial blobs at distances of 0.1 to 2 arcsec from the star, but the central engine remained unre-solved. Long baseline interferometry, currently the only tech-nique allowing the mas resolution necessary to resolve η Car, was recently applied to this star in the near- and mid-infrared domains by Van Boekel et al. (2003), Chesneau et al. (2005) and Weigelt et al. (2006). At the estimated distance of η Car of 2.3 kpc (Davidson & Humphreys 1997, Davidson et al. 2001, Smith 2006), one mas corresponds to 2.3 AU. We report in this Research Note the complete corpus of VINCI observations of
ηCar in the K band, including those discussed by Van Boekel et al. (2003).
Correspondence to: pierre.kervella@obspm.fr
2. Observations
The Very Large Telescope Interferometer (VLTI, Glindemann et al. 2003) has been operated by the European Southern Observatory on top of the Cerro Paranal, in Northern Chile since March 2001. For the present work, the light from η Car and its calibrators was collected either by two 0.35m VLTI Test Siderostats or two 8 m Unit Telescopes (UTs) without adap-tive optics. It was subsequently recombined coherently in the VINCI instrument using a K band filter (λ = 2.0 − 2.4 µm).
We have observed η Car repeatedly over the period November 2001 to January 2004. This resulted in a total of 71 000 interferograms on this target, out of which 50% (35 639) were selected automatically by the pipeline. Approximately the same quantity of data were obtained on the calibrators. We used the standard VINCI data reduction pipeline (Kervella et al. 2004, version 3.1) to derive instrumental visibilities. The calibration of η Car’s visibilities was done using well-known reference stars selected in the Bord´e et al. (2002) and Cohen et al. (1999) catalogues, except β Car. The diameter of β Car was computed from an interferometric measurement obtained with the Intensity Interferometer (Hanbury Brown et al 1974). The original V band uniform disk (UD) angular diameter was converted into a K band uniform disk angular diameter (θUD=
1.54 ± 0.10 mas) using linear limb darkening coefficients from Claret et al. (2000). Thanks to the relatively low values of
2 P. Kervella: Interferometric observations of η Car with VINCI/VLTI (RN) -120 -80 -40 0 40 80 120 -120 -80 -40 0 40 80 120 u (m) v (m)
Fig. 1. (u, v) coverage of the η Car observations. Large spots
represent the UT observations and small spots the siderostat observations (North is up and East is to the right).
η Car’s visibilities, the systematic uncertainty due to the cal-ibrators is in general a small fraction of the total error bars.
The calibrated visibility values obtained on η Car are listed in Table 1. Thanks to the use of several different telescope con-figurations and to the supersynthesis effect, we were able to cover a broad range of baseline lengths and azimuth. The (u, v) coverage of our observations is presented in Figure 1.
3. Effective wavelength
The VINCI instrument has no spectral resolution and its band-pass corresponds to the K band filter (2.0-2.4 µm). It is thus important to compute the precise effective wavelength of the instrument in order to determine the spatial frequency of the observation. The true effective wavelength differs from the fil-ter mean wavelength mainly because of the object spectrum shape, the detector quantum efficiency, and the fiber beam combiner transmission. To derive the effective wavelength of our observations, we computed a model taking into account
ηCar’s spectrum. The instrumental transmission of VINCI and the VLTI was measured on bright reference stars with the UTs (see Kervella et al. 2003 for details). Due to the extraordinarily dense, opaque stellar wind, the shape of the η Car spectrum in the infrared is different from the curve of a black body at the ef-fective temperature of the central object. In particular, the flux is increasing by about 20% from 2.0 to 2.5 µm (Smith 2002). In our model, no spectral line either in emission or absorption has been taken into account, considering the relatively limited contribution of these spectral features to the total flux in the K band. Taking the average wavelength of this model spectrum gives an effective wavelength of λeff = 2.196 µm for our η Car
observations, slightly longer than the typical 2.179 µm value
for solar-type stars. We estimate the uncertainty on this effec-tive wavelength to less than ±0.5%, or ±0.01µm.
4. Interferometric field of view
When injecting the light from an extended astronomical ob-ject into a single-mode fiber, the wavefront corrugation by the atmosphere (loss of coherence) is converted into photometric fluctuations. They are easily corrected during the data pro-cessing using the dedicated photometric channels of VINCI. Unfortunately, the restoration of coherence by spatial filtering comes at the expense of a very small field of view (FOV). It is well approximated by the diffraction pattern of a telescope whose size is the geometric mean of the apertures of the two telescopes. In the case of our homogeneous two-UT observa-tions, the FOV is thus 70 mas in the K band. Considering the extension of the η Car complex, this limited FOV has an impact on the measured visibilities.
Guyon (2002) studied in detail this limitation for the in-terferometric observation of extended objects. One important conclusion is that the effective FOV depends on the seeing, and so does the visibility. This is particularly true when large tele-scopes are used without adaptive optics, as this was the case for our observations. While all the UTs are now equipped with MACAO adaptive optics systems (Arsenault et al. 2004), the early observations reported here were all obtained with atmo-sphere limited point spread functions. The atmospheric turbu-lence creates a large cloud of speckles on the fiber head, and incoherent light coming from separate parts of the object is coupled into the fiber, therefore reducing the contrast of the fringes. As a second order effect, different local seeing condi-tions for the two UTs could also slightly degrade the visibili-ties. In the case of small objects such as single stars, this effect is negligible, but η Car is surrounded by a large and bright en-velope that is resolved by the UTs and contributes significantly to the light distribution within the FOV.
Practically, this means that the visibility measurements ob-tained with the UTs should be debiased from the seeing fluctu-ations. Unfortunately, this is not an easy task because the rela-tionship between the speckle cloud size (defined by the see-ing) and the flux coupled into the optical fiber is unknown. Tentatively, we mention as a first estimation of the UTs FOV the observatory seeing in the K band at the time of the obser-vations. The seeing values from the Paranal DIMM, obtained at λ = 0.5 µm have been converted to the K band assuming a classical λ−6/5 dependance. Future comparisons of the visi-bility measurements reported in the present Note with results from other instruments should take into account their relative interferometric FOV.
On the other hand, the observations obtained with the 0.35m siderostats are in principle not affected by this bias be-cause most of the η Car flux is coming from an area on the sky that is contained into the Airy pattern of these telescopes. Therefore, the obtained visibility is expected to be a faithful measurement of η Car’s intrinsic visibility in the 1.40 arcsec FOV of the siderostats. For the E0-G1 baseline, many visibil-ity points have been obtained on different nights, with a broad range of seeing conditions. The fact that they give very
consis-tent visibility values is a confirmation that the FOV variation is negligible for the siderostats.
5. Discussion
Figure 2 shows a comparison of the VINCI squared visibilities with the AMBER model fitting result of Weigelt et al. (2006), represented as a thick curve. The VINCI squared visibilities show a strong decrease with increasing spatial frequencies, clearly indicating that the central source is resolved by the in-terferometer. The measurements obtained with the UTs, though in principle affected by an uncertainty due to the variation of the FOV with the seeing, are roughly consistent with the siderostat data obtained on comparable baselines. The simple model developed by Hillier et al. (2001, 2006), was adjusted by Weigelt et al. (2006) to the AMBER observations of η Car in the continuum at λ = 2.174 µm. This model is well repro-duced by an exponential curve following the expression:
V2 = 1.008 exp(−0.016 s), (1) where s = B/λ is the spatial frequency. Our wavelength refer-ence is λ = 2.196 µm (Sect. 3). On the same figure, the dashed curve is an exponential fit to the VINCI data:
V2 = 0.322 exp(−0.016 s). (2) The slopes (in logarithmic scale) of the VINCI data fit and the model representing the AMBER measurements are in excellent agreement. However, the ratio of the two (VINCI/AMBER) is ρ2 = 32% in squared visibilities, translating into a factor ρ = 56% in visibilities. This ratio is constant with the spatial frequency, the signature of a fully resolved component.
To estimate the contribution of this extended component, we can consider the FOV of the two instruments. While the AMBER observations were obtained with the MACAO adap-tive optics system in function (the FOV was thus ≈70 mas), the FOV of the VINCI siderostat observations was much larger,
≈1400 mas. From the observed ratio ρ between the visibili-ties measured by VINCI and AMBER, we can infer that 56% of the 1400 mas encircled K band flux of η Car comes from within the 70 mas point spread function of a single UT. This value is nicely consistent with the independent measurement by Van Boekel et al. (2003), based on adaptive optics observa-tions with the NACO instrument, that gives an encircled energy of 57% within 70 mas. When corrected for the contribution of the extended emission, the visibilities measured by AMBER and VINCI are in excellent agreement.
A discussion of the shape of the dense stellar wind of η Car can be found in Smith et al. (2003) and Van Boekel et al. (2003). To improve the currently simplified spherical models, this observable appears highly desirable. The operating VLTI instruments are now routinely providing spectro-interferometric datasets on η Car (Weigelt et al. 2006; Chesneau et al. 2005), and the planned second generation will combine at least four telescopes, allowing to obtain rich data cubes at mas scales. This is an essential effort to follow the ex-tremely fast evolution of η Car (Martin et al. 2006). In this con-text, the simple, two-telescopes, broadband VINCI data pro-vide an interesting fiducial.
0,1% 1,0% 10,0% 100,0%
0 50 100 150 200 250 300
Spatial Frequency (cycles/arcsec)
Sq u a re d vi si b ili ty
Fig. 2. Squared visibilities obtained on η Car with VINCI,
com-pared to the model fitting result of Weigelt et al. (2006), rep-resented as a solid curve. The UT data points are reprep-resented with open squares.
Acknowledgements. Based on observations made with ESO’s VLT
Interferometer at Cerro Paranal, Chile. The VINCI data were re-trieved from the ESO/ST-ECF Archive. This research made use of the SIMBAD and VIZIER databases at the CDS, Strasbourg (France), and of NASA’s Astrophysics Data System Bibliographic Services.
References
Arsenault, R., Kervella, P., Donaldson, R., et al. 2004, Proc SPIE, 5490, 97
Bord´e, P., Coud´e du Foresto, V., Chagnon, G., Perrin, G., 2002, A&A, 393, 183
Chesneau, O., Min, M., Herbst, T., et al. 2005, A&A, 435, 1043 Claret, A., 2000, A&A 363, 1081
Cohen, M., Walker, R. G., Carter, B., et al. 1999, AJ 117, 1864 Davidson, K., & Humphreys, R. M. 1997, ARA&A, 35, 1
Davidson, K., Smith, N., Gull, T. R., Ishibashi, K., Hillier, D. J., 2001, AJ, 121, 1569
Falcke, H., Davidson, K., Hofmann, K. H., Weigelt, G., 1996, A&A, 306, L17
Glindemann, A., Argomedo, J., Amestica, R., et al. 2003, ApSS, 286, 1
Guyon, O., 2002, A&A, 387, 366
Hanbury Brown, R., Davis, J., Allen, L. R., 1974, MNRAS, 167, 121 Hillier, D. J., Davidson, K., Ishibashi, K., & Gull, T. 2001, ApJ, 553,
837
Hillier, D. J., Gull, T., Nielsen, K., et al. 2006, ApJ, 642, 1098 Kervella, P., Th´evenin, F., S´egransan, D., et al. 2003, A&A, 404, 1087 Kervella, P., S´egransan, D. & Coud´e du Foresto, V. 2004, A&A, 425,
1161
Martin, J. C., Davidson, K., & Koppelman, M. D. 2006, ApJ, 132, 2717
Smith, N., 2002, MNRAS, 336, 22
Smith, N., Davidson, K., Gull, T. R., Hillier, J. 2003, ApJ, 586, 432 Smith, N., 2006, ApJ, 644, 1151
Van Boekel, R., Kervella, P., Schoeller, M., et al. 2003, A&A, 410, L37
4 P. Kervella: Interferometric observations of η Car with VINCI/VLTI (RN) Weigelt, G., Kraus, S., Driebe, T., et al. 2006, A&A, in press,
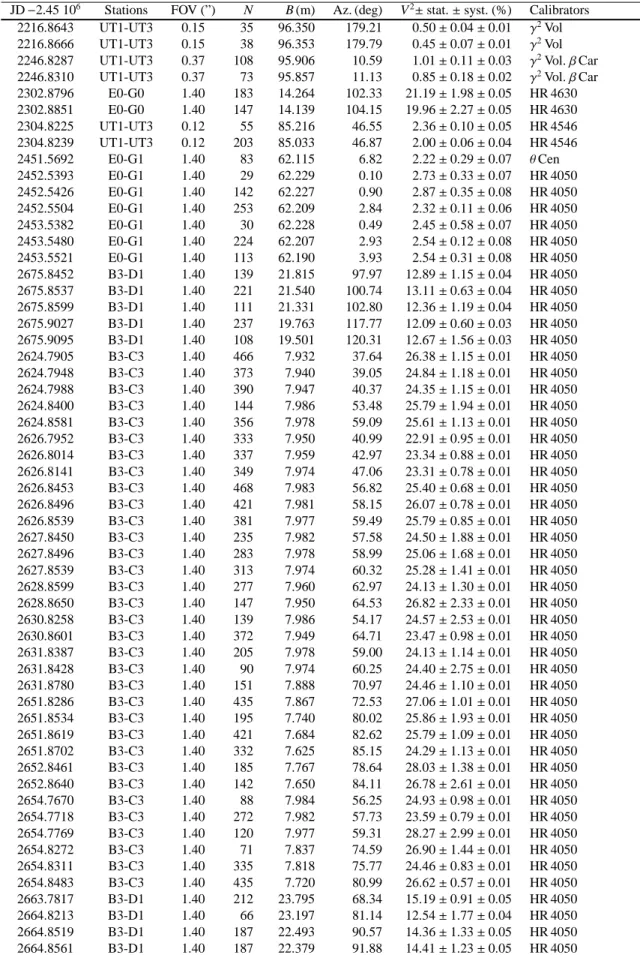
Table 1. Squared visibilities measured with VINCI on η Car. The seeing in the K band at the time of the observation is given as the FOV
with the UTs (see Section 4). N is the number of processsed interferograms, B the baseline length, and Az. the azimuth angle of the projected baseline (North = 0◦, East = 90◦). The squared visibility values and error bars are expressed in percents. The statistical and systematic (from the calibrator star estimated angular size) error contributions are given separately.
JD −2.45 106 Stations FOV (”) N B (m) Az. (deg) V2±stat. ± syst. (%) Calibrators
2216.8643 UT1-UT3 0.15 35 96.350 179.21 0.50 ± 0.04 ± 0.01 γ2Vol
2216.8666 UT1-UT3 0.15 38 96.353 179.79 0.45 ± 0.07 ± 0.01 γ2Vol
2246.8287 UT1-UT3 0.37 108 95.906 10.59 1.01 ± 0.11 ± 0.03 γ2Vol. β Car
2246.8310 UT1-UT3 0.37 73 95.857 11.13 0.85 ± 0.18 ± 0.02 γ2Vol. β Car
2302.8796 E0-G0 1.40 183 14.264 102.33 21.19 ± 1.98 ± 0.05 HR 4630 2302.8851 E0-G0 1.40 147 14.139 104.15 19.96 ± 2.27 ± 0.05 HR 4630 2304.8225 UT1-UT3 0.12 55 85.216 46.55 2.36 ± 0.10 ± 0.05 HR 4546 2304.8239 UT1-UT3 0.12 203 85.033 46.87 2.00 ± 0.06 ± 0.04 HR 4546 2451.5692 E0-G1 1.40 83 62.115 6.82 2.22 ± 0.29 ± 0.07 θCen 2452.5393 E0-G1 1.40 29 62.229 0.10 2.73 ± 0.33 ± 0.07 HR 4050 2452.5426 E0-G1 1.40 142 62.227 0.90 2.87 ± 0.35 ± 0.08 HR 4050 2452.5504 E0-G1 1.40 253 62.209 2.84 2.32 ± 0.11 ± 0.06 HR 4050 2453.5382 E0-G1 1.40 30 62.228 0.49 2.45 ± 0.58 ± 0.07 HR 4050 2453.5480 E0-G1 1.40 224 62.207 2.93 2.54 ± 0.12 ± 0.08 HR 4050 2453.5521 E0-G1 1.40 113 62.190 3.93 2.54 ± 0.31 ± 0.08 HR 4050 2675.8452 B3-D1 1.40 139 21.815 97.97 12.89 ± 1.15 ± 0.04 HR 4050 2675.8537 B3-D1 1.40 221 21.540 100.74 13.11 ± 0.63 ± 0.04 HR 4050 2675.8599 B3-D1 1.40 111 21.331 102.80 12.36 ± 1.19 ± 0.04 HR 4050 2675.9027 B3-D1 1.40 237 19.763 117.77 12.09 ± 0.60 ± 0.03 HR 4050 2675.9095 B3-D1 1.40 108 19.501 120.31 12.67 ± 1.56 ± 0.03 HR 4050 2624.7905 B3-C3 1.40 466 7.932 37.64 26.38 ± 1.15 ± 0.01 HR 4050 2624.7948 B3-C3 1.40 373 7.940 39.05 24.84 ± 1.18 ± 0.01 HR 4050 2624.7988 B3-C3 1.40 390 7.947 40.37 24.35 ± 1.15 ± 0.01 HR 4050 2624.8400 B3-C3 1.40 144 7.986 53.48 25.79 ± 1.94 ± 0.01 HR 4050 2624.8581 B3-C3 1.40 356 7.978 59.09 25.61 ± 1.13 ± 0.01 HR 4050 2626.7952 B3-C3 1.40 333 7.950 40.99 22.91 ± 0.95 ± 0.01 HR 4050 2626.8014 B3-C3 1.40 337 7.959 42.97 23.34 ± 0.88 ± 0.01 HR 4050 2626.8141 B3-C3 1.40 349 7.974 47.06 23.31 ± 0.78 ± 0.01 HR 4050 2626.8453 B3-C3 1.40 468 7.983 56.82 25.40 ± 0.68 ± 0.01 HR 4050 2626.8496 B3-C3 1.40 421 7.981 58.15 26.07 ± 0.78 ± 0.01 HR 4050 2626.8539 B3-C3 1.40 381 7.977 59.49 25.79 ± 0.85 ± 0.01 HR 4050 2627.8450 B3-C3 1.40 235 7.982 57.58 24.50 ± 1.88 ± 0.01 HR 4050 2627.8496 B3-C3 1.40 283 7.978 58.99 25.06 ± 1.68 ± 0.01 HR 4050 2627.8539 B3-C3 1.40 313 7.974 60.32 25.28 ± 1.41 ± 0.01 HR 4050 2628.8599 B3-C3 1.40 277 7.960 62.97 24.13 ± 1.30 ± 0.01 HR 4050 2628.8650 B3-C3 1.40 147 7.950 64.53 26.82 ± 2.33 ± 0.01 HR 4050 2630.8258 B3-C3 1.40 139 7.986 54.17 24.57 ± 2.53 ± 0.01 HR 4050 2630.8601 B3-C3 1.40 372 7.949 64.71 23.47 ± 0.98 ± 0.01 HR 4050 2631.8387 B3-C3 1.40 205 7.978 59.00 24.13 ± 1.14 ± 0.01 HR 4050 2631.8428 B3-C3 1.40 90 7.974 60.25 24.40 ± 2.75 ± 0.01 HR 4050 2631.8780 B3-C3 1.40 151 7.888 70.97 24.46 ± 1.10 ± 0.01 HR 4050 2651.8286 B3-C3 1.40 435 7.867 72.53 27.06 ± 1.01 ± 0.01 HR 4050 2651.8534 B3-C3 1.40 195 7.740 80.02 25.86 ± 1.93 ± 0.01 HR 4050 2651.8619 B3-C3 1.40 421 7.684 82.62 25.79 ± 1.09 ± 0.01 HR 4050 2651.8702 B3-C3 1.40 332 7.625 85.15 24.29 ± 1.13 ± 0.01 HR 4050 2652.8461 B3-C3 1.40 185 7.767 78.64 28.03 ± 1.38 ± 0.01 HR 4050 2652.8640 B3-C3 1.40 142 7.650 84.11 26.78 ± 2.61 ± 0.01 HR 4050 2654.7670 B3-C3 1.40 88 7.984 56.25 24.93 ± 0.98 ± 0.01 HR 4050 2654.7718 B3-C3 1.40 272 7.982 57.73 23.59 ± 0.79 ± 0.01 HR 4050 2654.7769 B3-C3 1.40 120 7.977 59.31 28.27 ± 2.99 ± 0.01 HR 4050 2654.8272 B3-C3 1.40 71 7.837 74.59 26.90 ± 1.44 ± 0.01 HR 4050 2654.8311 B3-C3 1.40 335 7.818 75.77 24.46 ± 0.83 ± 0.01 HR 4050 2654.8483 B3-C3 1.40 435 7.720 80.99 26.62 ± 0.57 ± 0.01 HR 4050 2663.7817 B3-D1 1.40 212 23.795 68.34 15.19 ± 0.91 ± 0.05 HR 4050 2664.8213 B3-D1 1.40 66 23.197 81.14 12.54 ± 1.77 ± 0.04 HR 4050 2664.8519 B3-D1 1.40 187 22.493 90.57 14.36 ± 1.33 ± 0.05 HR 4050 2664.8561 B3-D1 1.40 187 22.379 91.88 14.41 ± 1.23 ± 0.05 HR 4050
6 P. Kervella: Interferometric observations of η Car with VINCI/VLTI (RN)
Table 1. continued.
JD −2.45 106 Stations FOV (”) N B (m) Az. (deg) V2±stat. ± syst. (%) Calibrators
2665.8654 B3-D1 1.40 227 22.032 95.70 12.34 ± 0.80 ± 0.04 HR 4050 2670.6898 B3-D1 1.40 320 23.946 45.81 13.89 ± 0.72 ± 0.05 HR 4050 2670.7270 B3-D1 1.40 263 23.985 57.49 16.20 ± 1.43 ± 0.06 HR 4050 2670.7312 B3-D1 1.40 287 23.976 58.77 14.12 ± 1.24 ± 0.05 HR 4050 2670.7567 B3-D1 1.40 217 23.845 66.57 16.16 ± 1.34 ± 0.06 HR 4050 2670.7661 B3-D1 1.40 177 23.762 69.40 15.69 ± 1.75 ± 0.05 HR 4050 2670.8071 B3-D1 1.40 172 23.154 81.81 13.67 ± 1.46 ± 0.04 HR 4050 2670.8121 B3-D1 1.40 158 23.051 83.35 14.16 ± 1.12 ± 0.05 HR 4050 2675.8452 B3-D1 1.40 139 21.815 97.97 12.89 ± 1.15 ± 0.04 HR 4050 2675.8537 B3-D1 1.40 221 21.540 100.74 13.11 ± 0.63 ± 0.04 HR 4050 2675.8599 B3-D1 1.40 111 21.331 102.80 12.36 ± 1.19 ± 0.04 HR 4050 2675.9027 B3-D1 1.40 237 19.763 117.77 12.09 ± 0.60 ± 0.03 HR 4050 2675.9095 B3-D1 1.40 108 19.501 120.31 12.67 ± 1.56 ± 0.03 HR 4050 2677.7022 B3-D1 1.40 458 23.993 55.70 14.67 ± 0.45 ± 0.05 HR 4050 2677.7094 B3-D1 1.40 466 23.982 57.94 14.56 ± 0.42 ± 0.05 HR 4050 2677.7168 B3-D1 1.40 463 23.961 60.21 13.88 ± 0.41 ± 0.05 HR 4050 2677.7542 B3-D1 1.40 389 23.684 71.59 12.47 ± 0.40 ± 0.04 HR 4050 2677.7617 B3-D1 1.40 357 23.590 73.85 12.07 ± 0.43 ± 0.04 HR 4050 2677.7698 B3-D1 1.40 377 23.473 76.31 12.32 ± 0.41 ± 0.04 HR 4050 2678.8376 B3-D1 1.40 485 21.795 98.17 13.91 ± 0.32 ± 0.04 HR 4050 2678.8447 B3-D1 1.40 450 21.565 100.49 13.19 ± 0.32 ± 0.04 HR 4050 2678.8519 B3-D1 1.40 386 21.326 102.85 12.32 ± 0.35 ± 0.04 HR 4050 2678.8914 B3-D1 1.40 389 19.881 116.62 14.84 ± 0.40 ± 0.04 HR 4050 2678.8979 B3-D1 1.40 208 19.634 119.02 15.38 ± 0.60 ± 0.04 HR 4050 2679.8071 B3-D1 1.40 387 22.594 89.36 13.53 ± 0.32 ± 0.04 HR 4050 2679.8149 B3-D1 1.40 256 22.386 91.81 12.34 ± 0.38 ± 0.04 HR 4050 2679.8216 B3-D1 1.40 285 22.197 93.92 12.87 ± 0.52 ± 0.04 HR 4050 2679.8580 B3-D1 1.40 355 21.018 105.82 13.10 ± 0.39 ± 0.04 HR 4050 2679.8644 B3-D1 1.40 113 20.789 108.00 13.88 ± 2.00 ± 0.04 HR 4050 2679.8941 B3-D1 1.40 193 19.674 118.63 15.15 ± 0.90 ± 0.04 HR 4050 2683.7023 B3-D1 1.40 206 23.954 60.78 11.48 ± 0.86 ± 0.03 HR 4050 2683.7105 B3-D1 1.40 128 23.916 63.31 13.09 ± 1.79 ± 0.03 HR 4050 2683.7171 B3-D1 1.40 169 23.875 65.31 12.65 ± 1.20 ± 0.03 HR 4050 2683.7274 B3-D1 1.40 430 23.792 68.45 12.83 ± 0.46 ± 0.03 HR 4050 2683.7347 B3-D1 1.40 408 23.719 70.63 12.55 ± 0.49 ± 0.03 HR 4050 2683.7421 B3-D1 1.40 437 23.631 72.89 13.48 ± 0.48 ± 0.03 HR 4050 2683.7746 B3-D1 1.40 431 23.094 82.72 12.31 ± 0.43 ± 0.03 HR 4050 2683.7819 B3-D1 1.40 467 22.936 84.96 13.01 ± 0.44 ± 0.03 HR 4050 2683.7888 B3-D1 1.40 444 22.775 87.10 12.72 ± 0.45 ± 0.03 HR 4050 2683.8185 B3-D1 1.40 243 21.963 96.43 12.14 ± 0.50 ± 0.03 HR 4050 2683.8254 B3-D1 1.40 105 21.749 98.64 13.00 ± 1.64 ± 0.03 HR 4050 2683.8581 B3-D1 1.40 192 20.621 109.59 12.09 ± 0.64 ± 0.03 HR 4050 2683.8658 B3-D1 1.40 449 20.334 112.31 13.39 ± 0.46 ± 0.03 HR 4050 2683.8736 B3-D1 1.40 256 20.040 115.10 12.48 ± 0.93 ± 0.03 HR 4050 2683.8928 B3-D1 1.40 172 19.306 122.25 14.13 ± 1.31 ± 0.04 HR 4050 2683.9008 B3-D1 1.40 272 18.998 125.39 13.21 ± 0.83 ± 0.03 HR 4050 2683.9065 B3-D1 1.40 275 18.784 127.63 13.83 ± 0.75 ± 0.04 HR 4050 2684.7819 B3-D1 1.40 211 22.874 85.81 13.05 ± 0.59 ± 0.01 HR 4050 2684.7929 B3-D1 1.40 80 22.607 89.21 11.33 ± 1.71 ± 0.01 HR 4050 2684.7992 B3-D1 1.40 118 22.442 91.16 12.58 ± 1.44 ± 0.01 HR 4050 2684.8310 B3-D1 1.40 198 21.476 101.38 12.17 ± 0.49 ± 0.01 HR 4050 2741.7918 B3-M0 1.40 55 84.580 131.47 1.12 ± 0.37 ± 0.04 HR 4526 2742.7684 B3-M0 1.40 70 90.319 122.20 0.80 ± 0.23 ± 0.03 HR 4526 2742.7849 B3-M0 1.40 52 85.714 129.50 2.52 ± 1.12 ± 0.09 HR 4526 2745.6829 B3-M0 1.40 36 112.435 93.90 0.68 ± 0.71 ± 0.01 HR 4831. HR 4546 2769.6173 B3-M0 1.40 104 112.447 93.89 0.81 ± 0.12 ± 0.01 HR 4831 2769.6249 B3-M0 1.40 94 110.408 96.36 0.65 ± 0.13 ± 0.01 HR 4831 2769.6299 B3-M0 1.40 111 109.049 98.01 0.82 ± 0.12 ± 0.01 HR 4831 2770.6169 B3-M0 1.40 82 111.816 94.66 0.85 ± 0.21 ± 0.01 HR 4831 2770.6224 B3-M0 1.40 64 110.358 96.42 0.94 ± 0.33 ± 0.01 HR 4831
Table 1. continued.
JD −2.45 106 Stations FOV (”) N B (m) Az. (deg) V2±stat. ± syst. (%) Calibrators
2770.6280 B3-M0 1.40 81 108.811 98.29 0.63 ± 0.19 ± 0.01 HR 4831 2786.6480 B3-M0 1.40 226 90.383 122.10 1.47 ± 0.08 ± 0.05 HR 4546 2786.6581 B3-M0 1.40 184 87.543 126.48 1.50 ± 0.10 ± 0.05 HR 4546 2786.6634 B3-M0 1.40 133 86.084 128.87 1.49 ± 0.13 ± 0.05 HR 4546 2790.5635 E0-G0 1.40 480 13.813 108.79 25.20 ± 0.39 ± 0.01 HR 4546 2790.5686 E0-G0 1.40 369 13.688 110.56 21.89 ± 0.40 ± 0.01 HR 4546 2790.5733 E0-G0 1.40 346 13.571 112.23 23.13 ± 0.47 ± 0.01 HR 4546 2790.6054 E0-G0 1.40 426 12.755 124.14 26.06 ± 0.59 ± 0.01 HR 4546 2790.6103 E0-G0 1.40 479 12.633 126.03 28.03 ± 0.58 ± 0.01 HR 4546 2790.6151 E0-G0 1.40 406 12.512 127.94 24.87 ± 0.56 ± 0.01 HR 4546 2791.4925 E0-G0 1.40 468 15.214 86.68 25.02 ± 0.30 ± 0.01 HR 4546 2791.4974 E0-G0 1.40 358 15.135 88.20 22.31 ± 0.36 ± 0.01 HR 4546 2791.5023 E0-G0 1.40 180 15.053 89.70 22.05 ± 0.85 ± 0.01 HR 4546 2791.5296 E0-G0 1.40 419 14.526 98.37 23.30 ± 0.35 ± 0.01 HR 4546 2791.5347 E0-G0 1.40 297 14.416 100.03 21.75 ± 0.45 ± 0.01 HR 4546 2791.5398 E0-G0 1.40 154 14.305 101.69 20.42 ± 0.96 ± 0.01 HR 4546 2791.5737 E0-G0 1.40 445 13.494 113.32 25.73 ± 0.59 ± 0.01 HR 4546 2791.5786 E0-G0 1.40 381 13.371 115.08 24.49 ± 0.59 ± 0.01 HR 4546 2791.5840 E0-G0 1.40 329 13.233 117.06 20.99 ± 0.58 ± 0.01 HR 4546 2791.6264 E0-G0 1.40 453 12.166 133.73 25.88 ± 0.58 ± 0.01 HR 4546 2791.6316 E0-G0 1.40 375 12.044 135.90 25.05 ± 0.61 ± 0.01 HR 4546 2791.6367 E0-G0 1.40 358 11.927 138.09 23.81 ± 0.58 ± 0.01 HR 4546 2977.8452 E0-G0 1.40 390 15.962 44.66 24.45 ± 0.41 ± 0.01 HR 4546 2977.8530 E0-G0 1.40 333 15.980 47.14 24.03 ± 0.41 ± 0.01 HR 4546 3011.7317 D0-H0 1.40 111 63.563 37.94 4.72 ± 0.37 ± 0.07 HR 4050