HAL Id: tel-00713703
https://tel.archives-ouvertes.fr/tel-00713703
Submitted on 2 Jul 2012HAL is a multi-disciplinary open access
archive for the deposit and dissemination of sci-entific research documents, whether they are pub-lished or not. The documents may come from teaching and research institutions in France or abroad, or from public or private research centers.
L’archive ouverte pluridisciplinaire HAL, est destinée au dépôt et à la diffusion de documents scientifiques de niveau recherche, publiés ou non, émanant des établissements d’enseignement et de recherche français ou étrangers, des laboratoires publics ou privés.
Développement, validation et applications d’un système
de mesure des propriétés hygroscopiques des particules
atmosphériques type VH-TDMA
Paolo Villani
To cite this version:
Paolo Villani. Développement, validation et applications d’un système de mesure des propriétés hy-groscopiques des particules atmosphériques type VH-TDMA. Océan, Atmosphère. Université Blaise Pascal - Clermont-Ferrand II, 2006. Français. �NNT : 2006CLF21720�. �tel-00713703�
N° d’Ordre : D.U. 1720
UNIVERSITE BLAISE PASCAL
U.F.R. de Recherche Scientifique et Technique
ECOLE DOCTORALE DES SCIENCES FONDAMENTALES
N° 519
THESE
Présentée pour obtenir le grade de
DOCTEUR D’UNIVERSITE
Par
Paolo VILLANI
Diplomé d’Etudes Approfondies en Climat et Physico-Chimie de l’Atmospère (CPCA)
Développement, validation et applications d'un
système de mesure des propriétés hygroscopiques
des particules atmosphériques type VH-TDMA
Soutenue publiquement le 14 décembre 2006, devant la commission d’examen :
Présidente Nadine Chaumerliac
Rapporteur Ernest Weingartner
Rapporteur Denis Boulaud
Examinateur Laurent Gomes
Examinateur Alfred Wiedensohler
Directeur de thèse Paolo Laj
Table des matières
Table des matières
...2Introduction générale
...3Chapitre I: Techniques
...12I.1 Differential Mobility Analyser (DMA)...12
I.1.1 Article 1: Design, optimisation and evaluation of a Differential Mobility 12-34 Analyser (DMA)...14
I.2 Volatility Tandem Differential Mobility Analyser (V-TDMA)...39
I.2.1 Article 2: Design and validation of a 6-Volatility Tandem Differential Mobility Analyser (V-TDMA)...41
I.3 Volatility Hygroscopic Tandem Differential Mobility Analyser (VH-TDMA)...65
I.3.1 Article 3: A Multi-TDMA to characterise relationship between thermal and hygroscopic properties of atmospheric aerosol particles...68
Chapitre II: La croissance hygroscopique de l’aérosol atmosphérique
et l’impact des propriétés de surface des particules
...93II.1 Article 4: Hygroscopic behaviour of aerosol particles in diverse environnements...94
II.2 Article 5: The role of surface layers on particle hygroscopic properties...128
II.3 Article 6: Effect of surface modification on the hygroscopic properties of natural aerosol particles...138
Conclusion et perspectives
...165Références bibliographiques
...171Annexes
...176Liste des figures
...196Introduction générale
Les aérosols et les nuages jouent un rôle important sur le bilan radiatif de la terre mais les mécanismes par lesquels ils influencent le climat sont complexes. L’interaction aérosols/nuages est souvent abordée au travers de l’effet Twomey (Twomey, 1974). Cet effet décrit l’augmentation du nombre de gouttelettes et la diminution de leur rayon moyen en réponse à une augmentation du nombre de noyaux de condensation (CCN). Cet effet est potentiellement accompagné d’une rétroaction des aérosols sur les nuages (effet semi-direct) via la modification de leur dynamique, en raison de la modification du bilan énergétique du nuage. Ce problème est complexe et explique pourquoi l’évaluation quantitative des effets Twomey et semi-direct reste, parmi les différents forçages anthropiques connus, la plus incertaine. Elle est estimée entre 0 et –1.5 W m-2 (IPCC, 2001). La difficulté principale pour réduire cette incertitude provient de la complexité de tenir compte à la fois de l’action des aérosols sur les nuages et des rétroactions.
A la base de ces interactions aérosols/nuages, la prévision du comportement des particules en présence de la vapeur d’eau atmosphérique est complexe. Les conditions dans l’atmosphère ne permettent pas la formation homogène de gouttelettes d’eau liquide. Cette nucléation homogène demanderait en effet des sursaturations (pression partielle de vapeur d’eau en excès de la pression de vapeur saturante) de l’ordre de 200%. La condensation de la vapeur d’eau se fait donc principalement sur des noyaux de condensation et l’interaction entre la particule et l’eau est généralement décrite au travers de la loi empirique de Köhler (1936). Cette théorie montre que la quantité de vapeur d’eau condensée en surface des particules dépend de la taille des particules et de leur composition chimique ainsi que des conditions ambiantes d’humidité relative. Même en l’absence de nuage, une fraction des particules présentes dans l’atmosphère contient donc une proportion importante d’eau.
La loi de Köhler est décrite de la manière suivante :
Où ea: actual water vapour pressure; esat,w: saturation vapor pressure; Mw: molecular weight of
water; Ms: molecular weight of salt; υ: total number of ions into which the salt dissociates; φs:
−
−
=
)
(
2
exp
3 3 3 , , s w N N s w v s w a s w w sat ar
a
M
r
M
a
RT
M
e
e
ρ
ε
ρ
υφ
ρ
σ
osmotic coefficient of salt in solution; εv: volume fraction of soluble material in the aerosol
nucleus; rN: radius of dry aerosol nucleus; a: radius of humid aerosol particle; ρw: density of
water; σs,a: surface tension.
Lorsqu’une particule d’aérosol est en équilibre avec la vapeur d’eau atmosphérique, l’activité de l’eau condensée est égale à l’humidité de l’air corrigée par la courbure de la particule. Une particule atteindra donc une taille à l’équilibre qui dépendra de son diamètre “sec” (diamètre à humidité relative faible) et de sa composition chimique. Pour une taille donnée, une particule contenant une quantité plus importante de matériel soluble contiendra donc une quantité plus importante d’eau condensée. Ceci s’accompagne bien évidemment par un changement de taille et de masse des particules. La fraction massique de l’eau varie de quelques % à plusieurs dizaines de % voire beaucoup plus en présence de gouttelettes de nuages (Putaud et al., 2003). Les propriétés hygroscopiques des particules peuvent être caractérisées par l’augmentation de la taille de particules en fonction de l’humidité relative. Cette augmentation du diamètre est appelée le facteur de croissance hygroscopique (Hygroscopic Growth Factor, HGF) et correspond simplement au rapport des diamètres sec et humide. Pour des sels inorganiques purs, l’augmentation du diamètre est décrite par les courbes de Hanël (Hanël, 1976). La
Figure 1 montre, à titre d’exemple, la croissance hygroscopique des particules de diamètre initial de 100 nm, constituées de NaCl pur, en fonction de l’humidité relative (RH%).
Figure 1 : Changement du diamètre des particules de NaCl en fonction de l’humidité relative
observé durant un cycle d‘hydratation (cercle bleu) et de déshydratation (croix rouge) pour un diamètre initial de 100 nm. La courbe en noir représente la loi de Köhler théorique.
DRH ERH
Grâce à cette représentation de croissance hygroscopique, on peut attribuer pour chaque composé chimique un couple (Deliquescence Relative Humidity, DRH; Efflorescence Relative Humidity, ERH). Le DRH est l’humidité à laquelle le composé solide se transforme en gouttelette (pendant l’hydratation) et l’ERH est l’humidité à laquelle la gouttelette redevient un cristal de sel (pendant la déshydratation). La principale caractéristique de ce couple est que l’ERH est toujours inférieure au DRH à cause du phénomène d’hystérésis. On peut noter que la théorie de Köhler dans le cas d’une humidité relative inférieure à 100% (courbe noire, Figure 1) ne prévoit pas ce phénomène d’hystérésis ni les transitions cristal↔gouttelette.
La mesure expérimentale des facteurs de croissance hygroscopique montre une grande variabilité suivant l’origine des particules d’aérosols. La croissance hygroscopique mesurée en milieu marin montre généralement des valeurs correspondantes aux sels de mer classiques (HGF = 2.0-2.4) (Covert and Heintzenberg, 1989 ; Svenningsson et al., 1992 ; McMurry and Stolzenbourg, 1989 ; Zhang et al., 1993 ; Pitchford and McMurry, 1994 ; Kerminem, 1996 ; Swietlicki et al., 2000). En milieu urbain, les facteurs de croissance sont généralement beaucoup plus faibles (Massling et al., 2005 ; Rissler et al., 2005 ; Vestin et al., 2005). Ces mesures ont amené à formuler l’hypothèse que l’aérosol était composé d’une fraction active (sels inorganiques) régissant le comportement hygroscopique des particules. Cette hypothèse apparaît néanmoins trop simpliste.
Les aérosols atmosphériques ont en effet des compositions chimiques variées incluant à la fois des composés inorganiques et organiques, en mélange interne (mélange de composés chimiques mélangés dans une même particule) ou en mélange externe (mélange de particules de composition chimique différente). La fraction organique des particules est elle-même mal définie, notamment pour ses propriétés de solubilité. En théorie, la connaissance des propriétés physiques et chimiques des particules permet de prévoir leur croissance hygroscopique. Si ceci est avéré pour des particules inorganiques, ce n’est pas le cas pour des particules plus complexes contenant soit exclusivement des substances organiques de solubilité variables (Saxena et al., 1996), soit un mélange de substances organiques et inorganiques.
Puisqu’une fraction non négligeable de substances organiques se retrouve dans les systèmes nuageux (Fuzzi and Zappoli, 1996 ; Facchini et al., 1999 ; Raymond et Pandis, 2002,2003), on ne peut exclure que même des substances organiques peu solubles puissent servir de noyau de condensation de nuage et donc, en conditions de sous-saturation, montrer des facteurs de croissance significatifs (Saxena et al., 1995 ; Choi et Chan, 2002 ; Speer et al., 2003).
Facchini et al. (1999) ont montré, à partir d’échantillons de brouillard, qu’une décroissance de la tension de surface des aérosols, causée par la présence de composés organiques actifs à la surface, entraînerait une augmentation du nombre de gouttelettes formées associée à un forçage radiatif négatif de l’ordre de -1 W m-2. Nenes et al. (2002) ont montré que les "effets chimiques" (c'est-à-dire la dissolution de gaz solubles et de solutés partiellement solubles, la diminution de la tension de surface due à la présence de composés organiques dissous, et la modification du coefficient d’accommodation due à la formation d’un film organique à la surface des aérosols) sur le nombre de gouttelettes formées peuvent être du même ordre de grandeur que l’effet Twomey dû uniquement à l’augmentation du nombre d’aérosols. Plusieurs études en laboratoire, utilisant des chambres CCN seules ou associées à des DMA, ont cherché, récemment, à déterminer la capacité des aérosols organiques à former des gouttelettes (Broekhuizen et al., 2004 ; Hori et al., 2003 ; Shanz et al., 2003). Récemment,
Sellegri et al., (2003) ont montré que la capacité des aérosols organiques à servir de noyau de condensation était lié à leur propriétés thermiques (et donc indirectement à leur complexité structurelle). Rojas et al., (soumis) ont également mis en évidence qu’une simple thermo-désorption de l’aérosol, sans modification mesurable de la taille des particules, était susceptible, dans certaines conditions, de modifier de manière significative le spectre d’activation des CCNs. Les études effectuées sur différents sites montrent que les variations de l’hygroscopicité peuvent être, soit positives (augmentation du ratio CCN/CN) soit négatives suivant l’origine des masses d’air. Ces études concluent que la présence d’une espèce soluble en trace (sulfate d’ammonium par exemple) ou d’une espèce organique en trace active à la surface des aérosols étudiés, augmente la capacité à former des gouttelettes. La structure du mélange interne entre substances organiques et inorganiques, et notamment les propriétés de surface, pourraient donc jouer un rôle important dans la croissance hygroscopique des particules.
Cette complexité, que la loi de Köhler ne permet pas d’appréhender complètement, pourrait être à l’origine des désaccords dans les études de fermeture entre les mesures expérimentales et la théorie. A l’heure actuelle, les modèles de simulation de la formation des nuages ne permettent pas de prévoir la fraction des particules d’aérosols pouvant agir comme CCN (Snider et Brenguier, 2000). Celle-ci varie de 20 à 90% suivant la dynamique du nuage et les propriétés de la population d’aérosols (taille et composition chimique). En règle générale, la fraction CCN est plus importante pour des masses d’air propres que pour des masses d’air polluées alors que le spectre en taille des CCNs varie considérablement suivant les types de nuages (Hallberg et al., 1997 ; Hallberg et al., 1998 ; Bower et al., 2000 ; Geremy et al.,
2000). Les études in-situ montrent généralement la présence d’une population de particules “actives” (CCN) et d’une population de particules “non actives” restant dans la phase interstitielle du nuage mais aucune classification chimique claire de ces deux populations n’a pu être proposée jusqu’à présent. Il apparaît que, si la majorité des particules (en particulier celles d’origine anthropique) est, en théorie, susceptible de jouer le rôle de CCN, seule une fraction d’entre elles le sont effectivement dans les conditions naturelles. L’objectif principal de ce travail de thèse est donc de contribuer à mieux comprendre le lien entre la nature de l’aérosol et ses propriétés hygroscopiques et notamment, à mieux évaluer le rôle des propriétés de surface des aérosols.
La réalisation de cet objectif nécessite en premier lieu de travailler sur les méthodes instrumentales pour la mesure à la fois de la croissance hygroscopique et de certaines propriétés de surface des aérosols fins. La mesure du HGF est généralement obtenue par méthode d’analyse différentielle de mobilité en tandem (Tandem Differential Mobility Analysers , TDMA). Cette technique a été décrite à l’origine par Rader and McMurry en 1986 et le principe général de mesure est présenté sur la Figure 2.
Figure 2 : Schéma du Tandem-DMA
Les TDMA sont classiquement constitués de trois parties principales qui permettent la sélection des
particules, le conditionnement de l’aérosol
et la mesure de la distribution
granulométrique des particules conditionnées. Notre travail est organisé au travers du développement et de l’utilisation de systèmes TDMA.
Ces développements sont décrits en détail dans le chapitre relatif au développement instrumental (Chapitre I). La sélection des particules polydispersées se fait via un système DMPS (Differential Mobility Particle Sizer) dont le fonctionnement est décrit dans l’Appendix A.1. Les particules sont chargées à l’équilibre dans un neutraliseur (généralement une source radioactive) et sélectionnées en taille via un analyseur de mobilité différentielle DMA-1 (cf. Appendix A.2). Les particules chargées sont classées en fonction de leur mobilité
électrique. En sortie du DMA-1, le flux de particules quasi-monodispersées est dirigé en partie vers le premier compteur de particule CPC-1 (cf. Appendix A.3) pour connaître la concentration des particules classées initialement, et en partie vers l’unité de conditionnement de l’aérosol. Les DMAs sont la base essentielle des mesures granulométriques des particules fines. Dans la première section du chapitre I (chapitre I.1 : « Design, optimisation and evaluation of a Differential Mobility Analyser (DMA) » et Appendix A.4) de ce travail, nous décrirons comment les améliorations apportées aux DMAs commerciaux permettent d’augmenter de manière significative l’efficacité de transfert des colonnes DMA mais également d’améliorer la précision avec laquelle la colonne produit un flux monodimensionnel de particules.
L’unité de conditionnement est variable suivant le type d’étude entrepris. Elle permet de modifier la nature des particules en les plaçant par exemple en contact avec de l’air humide (H-TDMA) ou dans une enceinte chauffée à une certaine température (V-TDMA). La réponse de l’aérosol monodispersé à ce conditionnement permet d’en déterminer certaines propriétés. Les particules qui sortent de l’unité de conditionnement vont passer dans la troisième partie du système pour qu’on puisse mesurer la distribution en taille de l’aérosol modifié. Cette granulométrie résultante est déterminée avec un deuxième DMA (DMA-2) qui balaye une plage de diamètres des particules en combinaison avec un deuxième CPC (CPC-2) qui mesure la concentration des particules pour chaque canal. Les différents types de conditionnement utilisés dans cette étude sont donc le conditionnement thermique et le conditionnement humide. Les Figures 3 et 4 illustrent le comportement des particules lorsqu’on les conditionne en température et humidité, respectivement.
Figure 3 : Illustration de distributions granulométriques après conditionnement des particules exposées
à des températures élevées.
Figure 4 : Illustration de distributions granulométriques après conditionnement des particules exposées
à des humidités élevées.
Particules à T>25°C DMA-/CPC-2 DMA-/CPC-1 THERMIQUE CONDITIONNEMENT Diamètre initiale, D0 Particules à 25°C Particules à 90%RH DMA-/CPC-2 DMA-/CPC-1 CONDITIONNEMENT Diamètre initiale, D0 Particules à 10%RH Particules à 90%RH DMA-/CPC-2 DMA-/CPC-1 HUMIDE CONDITIONNEMENT Diamètre initiale, D0 Particules à 10%RH Particules à 90%RH DMA-/CPC-2 DMA-/CPC-1 CONDITIONNEMENT Diamètre initiale, D0 Particules à 10%RH Particules à 90%RH DMA-/CPC-2 DMA-/CPC-1 HUMIDE CONDITIONNEMENT Diamètre initiale, D0 Particules à 10%RH
Le conditionnement thermique utilisé dans ce travail (i.e. Volatility-TDMA) utilise une unité de conditionnement où l’aérosol quasi-monodispersé est conditionné à une température fixée (Chapitre I.2.1 et Appendix A.5). Le conditionnement humide a été développé dans le cadre d’une version combinée du conditionnement thermique et humide de l’aérosol (VH-TDMA), et qui permet d’humidifier les particules à une humidité fixée après thermo-désorption à une température fixée. A notre connaissance, ce couplage VH-TDMA n’a été mis en place que par l’équipe de Johnson à l’International Laboratory for Air Quality and Health, Queensland University of Technology, Brisbane, Australia (Johnson et al., 2003). Des développements similaires sont en cours au PSI (Paul Scherrer Institute) en Suisse.
Ces deux types de conditionnement ont été développés au laboratoire et sont décrits en détails dans les sections 2 (Chapitre I.2.1 : « Design and validation of a 6-Volatility Tandem Differential Mobility Analyser (V-TDMA)» et Appendix A.5) et 3 (Chapitre I.3.1 : « A Multi-TDMA to characterise relationship between thermal and hygroscopic properties of atmospheric aerosol particles » et Appendix A.5, A.6) où sont présentés en détails le principe de fonctionnement, les dessins techniques, les tests de validation et les mesures en laboratoire. En particulier, le H-TDMA du VH-TDMA a été inter-comparé aux autres systèmes existants en Europe dans le cadre du Réseau d’Excellence ACCENT.
La réponse de l’aérosol au conditionnement thermique et humide offre des perspectives intéressantes pour mieux comprendre le rôle de la nature complexe de l’aérosol sur leurs propriétés hygroscopiques. Les V-TDMAs ont été généralement utilisés pour déterminer la nature chimique des particules. Cette utilisation s’est néanmoins révélée problématique compte tenu de la complexité des propriétés thermiques. Nous avons, dans ce travail, utilisé la thermo-désorption comme élément de modification des propriétés de surface des particules en ne travaillant qu’avec des températures ne modifiant pas le spectre dimensionnel des particules.
Les résultats des campagnes de mesure effectuées avec le VH-TDMA sont présentés dans le chapitre II. Ces résultats sont présentés sous la forme de deux manuscrits, l’un concernant les mesures de croissance hygroscopique effectuées lors de diverses campagnes dans des milieux urbains, côtiers, et sur un site de troposphère libre (Chapitre II.1 : « Hygroscopic behaviour of aerosol particles in diverse environments »), l’autre concernant l’impact du conditionnement thermique des particules (et donc de l’évaporation de sa composante la plus volatile) sur les propriétés hygroscopiques (Chapitre II.2 : « The role of surface layers on particle
hygroscopic properties » et Chapitre II.3 : « Effect of surface modification on the hygroscopic properties of natural aerosol particles »).
Dans la conclusion de ce travail, le lecteur trouvera des éléments de prospectives à la fois concernant une version améliorée du système VH-TDMA mais également des propositions pour mieux contraindre les études effectuées lors de cette thèse.
C
HAPITRE
I.1
Differential Mobility Analyser
L’analyseur différentiel de Mobilité (DMA) est un élément fondamental pour la granulométrie des particules fines. Associé à un compteur de particules et à un neutraliseur, il permet très schématiquement de procéder à la mesure de la dimension des particules entre quelques nm et quelques centaines de nm. Il est bien sûr un élément essentiel de nos mesures de granulométrie tandem (V-TDMA et de H-TDMA).
Comme leur nom l’indique, chacun de ces analyseurs tandem est constitué d’une série de 2 DMA. Associé comme nous le faisons lors de campagnes expérimentales avec un simple granulomètre type DMPS / SMPS, et / où avec un granulomètre pour la fraction volatile (V-DMPS / V-SMPS), le nombre de colonnes DMA nécessaires à une caractérisation complète de l’aérosol lors d’une campagne de mesure est de l’ordre de 4 à 6. L’équipe instrumentale du LaMP participe parfois de manière simultanée à plusieurs campagnes expérimentales nécessitant par là même un nombre important de colonne.
Cet état de fait ainsi que le coût important d’une colonne DMA (15 k€) nous a poussé, comme la plupart des groupes Européens travaillant sur l’aérosol atmosphérique à procéder à la construction de nos propres colonnes DMA que nous avons entrepris sur la base du DMA TSI (Modèle 3081). Plus qu’une simple anode / cathode, les colonnes DMA sont complexes (Voir
Figure I.1.1) car elles nécessitent un contrôle extrêmement précis des flux d’air et d’aérosols et de leur mélange. Plutôt que de procéder à la copie du système TSI, nous avons, suivant les indications fournies par Chen, Pui et al., 1998, cherché à procéder à une amélioration du DMA TSI en redessinant en partie le système de mélange des flux d’air sec et d’aérosols, et le système de sortie d’air échantillonné.
Figure I.1.1 : Schéma du DMA construi au LaMP.
Ceci a demandé la modification d’un grand nombre de pièces par rapport au système original TSI. Nous avons également procédé à la construction de DMAs courts (non présenté dans ce chapitre) permettant une amélioration de la sélection de particules dans la gamme de taille < 50 nm.
Les modifications apportées au DMA font l’objet du Chapitre 1.1. Une description précise de ces modifications est rapportée ici ainsi que les procédures de validation à la fois via le logiciel Fluent et expérimentale. Les résultats montrent que les DMAs modifiés permettent à la fois un meilleur transfert de particules, notamment pour les particules fines en raison d’une diffusion turbulente limitée, et une meilleure précision dans la sélection d’un diamètre de mobilité donné à la fois par rapport au DMA TSI mais aussi par rapport au DMA type Vienna construit par nos collègues de l’université de Lund (Suède) et qui équipaient les premières versions de nos DMPSs. Ce chapitre fera l’objet d’un rapport OPGC.
Les DMAs sont désormais réalisés soit entièrement au laboratoire, soit, pour certaines pièces, auprès d’une entreprise de constructions mécaniques. Grâce à ces développements, le LaMP dispose désormais d’un savoir-faire fondamental pour l’étude de la granulométrie de l’aérosol. L’utilisation de nos DMAs nous permet de procéder simultanément à l’ensemble des mesures nécessaires à la caractérisation physique de l’aérosol. Nous maîtrisons l’ensemble de la construction de systèmes DMPS, SMPS et TDMA. Les récentes intercomparaisons de granulomètres montrent qu’il est en effet tout à fait nécessaire de comprendre, modifier et valider l’ensemble d’un système DMPS / SMPS pour obtenir une granulométrie fiable de l’aérosol, ce qui n’est pas le cas des systèmes commerciaux.
DESIGN, OPTIMISATON AND EVALUATION OF A
DIFFERENTIAL MOBILITY ANALYSER (DMA)
Abstract
Several features of a Differential Mobility Analyser (DMA) have been improved for measuring the size distribution of nanometer aerosol particles. The design is based on a cylindrical symmetry configuration (Knutson and Whitby, 1975) and is optimised by means on field fluid flow model calculation using the Computational Fluid Dynamics (CFD) Flow Modelling Software, FLUENT 6.1. Two important design features were included: a modified aerosol/sheath inlet (as suggested by Chen, Pui et al., 1998) and a modified aerosol exit. For reducing particle loss at the DMA base all bends were eliminated and to avoid flow and particles recirculation the inlet slit width is reduced and aerodynamically shaped. Numerical results are presented comparing the fluid flow and particles trajectories of the old and new inlet for different flow ratios. After numerical evaluation and construction, the performance of the DMA is evaluated using the Tandem DMA technique following the procedure suggested by Stolzenburg (1988). The transfer functions of the optimised DMA are determined experimentally for particle size range of 10-100 nm by using two identical DMAs with an analyser length of 44 cm. By comparing the experimental results obtained using the Tandem containing the new DMAs with the same experimental setup containing two identical “(Non Genuine) Vienna Type” DMAs, it is concluded that the re-designed features increase the performances of a DMA.
1. INTRODUCTION
Size classification of aerosol particles according to their electrical mobility using differential mobility analysers (DMAs) has become a standard technique for characterising aerosol physical properties. The accuracy of this thechnique concerning its resolution in time on particle size is superior related to most of the other technniques wich are typically used for aerosol studies of this particle size range (e.g. diffusion batteries, cascade impactors). Previously, DMAs often have been used in the field of aerosol analysis. Examples related to this work are the Differential Mobility Particle Sizer (i.e. DMPS) and the Tandem Differential Mobility
Analyser (i.e. TDMA) (Rader and McMurry, 1986). The differential mobility method,
first described by Hewitt (1957), is a powerful tool for the classification of
submicrometer aerosol particles. Work performed by Liu and Pui (1974), Knutson
and Whitby (1975), Stolzenburg and McMurry (1988) established this method for the generation of monodisperse particles and for the size selection for polydisperse aerosol particles. Recently their capabilities have been extended down to the so called ultra fine range (2 - 20 nm) and even approaching the size of molecular clusters (Reischl, 1991).
As a further development of the old designs there are at least four modern types of
DMAs available: TSI type (Knutson and Whitby, 1975), Vienna type (Reischl, 1991)
and two of the “radial” types, described by Mesbah et al., (1993) and Zhang and
Flagan (1996). The term DMA is almost exclusively used for the ones having a cylindrical symmetry. Additional versions of the instrument exist fabricated elsewhere according to more or less similar design and often made for specific purposes (Whang and Flagan, 1990; Wiedensohler et al., 1998; Collins et al., 1999).
The aim of this paper is to evaluate the performances of a modified TSI DMA type. The paper provides detailed designs of the new DMA features as well as simulations of the flows inside the modified DMA. Performances of the modified DMA column are then compared with conventional Vienna type DMA from built by Lund University (Sweden).
2. DMA OPERATION PRINCIPLES
The operation principle of a DMA has been extensively described in literature (Hewitt,1957; Pui, 1974;Knutson and Whitby, 1975; Stolzenburg and McMurry, 1988) and is shown in Figure A.1.1.
The DMA consists of a center electrode surrounded by a grounded outer concentric cylinder. A particle free “Sheath air” flow Qsh and an aerosol “Sample flow” Qs flow downward and axially between the two cylinders. Before entering the DMA, the aerosol particles are charged by passing through a bipolar diffusion charger (neutraliser), where a well-defined charge distribution is established. With a voltage applied to the center electrode, a narrow electrical mobility bandwidth of particles can be selected from the charged aerosol sample and drawn through a small exit slit at the base of the DMA. In the electrostatic field of the classifier, particles experience an electrostatic force and accelerate perpendicularly to their trajectories, until this force is balanced by the Stokes drag force.
Figure A.1.1: Schematic of the “Lund-Vienna Type” differential mobility
analyser. Aerosol Sample Air Q Sheath Air Q Mesh Center Electrode sh s monodisperse Aersosol Qa Exit Slit Q + Q - Qsh s a Housing
The magnitude of electrical mobility Zp is a measure for the ability of a particle to move in an electric field. It is expressed as (Knutson and Whitby, 1975):
p p c p
D
D
C
e
i
Z
⋅
⋅
⋅
⋅
=
µ
π
3
)
(
0 (1)where Dp= Mobility equivalent diameter
i = number of elementar charge (e0)
µ(T) = Air Viscosity
Cc(Dp,λ)= Cunningham Slip Correction Factor
Throughout this paper, when the diameter of the particles is mentioned, we refer to the concept of “mobility equivalent diameter”. Equation 1 is generally known to apply successfully to particle sizes down to at least Dp=5 nm. Particles with high electric
mobility deposit on the center rod upstream of the sampling slit. Those with low mobility are carried out with the main outlet flow. In between, there exists a narrow range of mobility for which the particles reach into the sampling slit and are carried out with the sampling flow. Only those particles whose electric mobility lies within a certain narrow range will reach the sampling flow. This range may be altered by adjusting the operating conditions of the mobility analyser.
An efficient formalism to describe the performance of a DMA is the concept of the DMA transfer function. Knutson and Whitby (1975) introduced the transfer function Ω as the probability that an aerosol particle which enters the mobility analyser via the aerosol inlet to leave via the sampling flow, for a given mobility Zp. Due to its nature as a “probability” function, the transfer function indicates how many particles of any distinct mobility entering the DMA will successfully go across the analyser column.
For cylindrical DMAs, Knutson and Whitby (1975) derived a transfer function of
triangular shape in the mobility space, illustrated in Figure A.1.2.
This simple model ignores particle diffusion inside the DMA. The centroid of the mobility band Zp* is given by:
⋅
⋅
⋅
+
−
⋅
=
int *ln
2
R
R
L
V
Q
Q
Q
Z
sh a s est pπ
(2)Figure A.1.2: Ideal DMA transfer function.
And the half-width of the mobility band, ∆Zp, is given by:
⋅
⋅
⋅
⋅
+
=
∆
intln
2
)
(
R
R
L
V
Q
Q
Z
s a est pπ
(3)The relative half-width is obtained by normalising ∆Zp with the midpoint mobility Zp *:
(
)
=
β
+
+
=
∆
)
(
* ex sh s a p pQ
Q
Q
Q
Z
Z
(4)Equation (4) shows that the relative half-width of the mobility band is controlled by the flow raytes. In normal use, the flows are selected such that β= 0.1.
The ratio of half-width at half-height (HWHH) to the mean particle size is used to characterise the operation of a DMA in terms of performances of the classifier
resolution measurements (Chen and Pui, 1998; Karlsson and Martinsson, 2003).
However, a number of experiments revealed that in the ultrafine size range (Dp<20 nm) the DMA transfer function deviate significantly from his ideal triangular shape (Kousaka et al, 1995; Zhang et al., 1995; Fissan et al., 1996; Reischl et al., 1997). Two principle effects of Brownian diffusion were identified to be responsible for this behaviour of the DMA. First, particles losses in connecting tubing, canalisations,
bends and inlets of the DMA decrease the overall area of the transfer function. Second, the broadening of particle trajectories inside the analyser column increases the half-width band of the transfer function. The latter effect was incorporated into the transfer function formalism by Stolzenburg (1988).
3. DESIGN MODIFICATIONS OF TSI DMA
As shown originally by Knutson and Whitby (1975), the size resolution of the DMA is proportional to the aerosol/sheath flow ratio in the classifying region. Therefore, DMAs have a good potential for high resolution measurement by operating at a small flow ratio. The resolution of the current TSI DMA is less than predicted for an aerosol/sheath flow ratio of 0.05 (i.e. β=1:20). As revealed by Chen and Pui (1997), there is a mismatch between the aerosol and sheath flow velocities at the wide inlet entrance slit of the DMA classifying region. This flow mismatch causes a flow recirculation pattern to develop in the immediate region of the entrance slit.
The mismatch condition worsens when the DMA is operated at low aerosol/sheath flow ratio for high sizing resolution measurements. It restricts the usable flow ratio range and limits the DMA resolution. Several causes contribute to this non-ideal performance of DMAs:
(a) Due to the wide opening of the aerosol entrance slit, it allows the electric field
to penetrate into the aerosol passage upstream of the entrance slit (Chen et
al., 1997). It is undesirable because this penetration results in inaccurate measurement of electrical mobility and, when combined with the flow recirculation pattern, it cause more aerosol deposition prior to entering the classifying region. The electric field distortion therefore makes accurate mobility determination very difficult. The wide slit width also makes it difficult to define the DMA characteristic length of the classifying region, L. The length is defined as the distance between the mid-plane of the mobility analyser entrance slit and sampling exit slit: the current TSI DMA length is close to 444 mm.
(b) The TSI-standard design has a high voltage Teflon insulator below the aerosol exit slit on the collector tube. The insulator charges up during voltage cycling and causes electrostatic deposition of classified, charged aerosol particles on the inside surface of the insulator tube.
(c) For particle size below 20 nm the effect of bends and elbows on particle
diffusion loss is significant (Wang et al., 2001): the bend placed after the
mono-dispersed aerosol exit slit in the current TSI DMA base increase this phenomenon.
The aim of this work was to re-design and optimise a DMA in terms of transmission efficiency and size resolution in particular in the small particle range (<20nm). In order to limit flow recirculation at the aerosol inlet slit and to minimize particle losses in the DMA, our work focussed in new designs to reduce the slit width, to aerodynamically shape the inlet and to reduce aerosol passage transport length and eliminate bends.
3.1 Modification of the aerosol flow entrance slit
In order to reduce the slit width of the existing TSI DMAs, the inlet cone length is
increased from 41.3 mm to 50.7 mm, detailed dimension are given in Figure A.1.3
and A.1.4.
Figure A.1.3: Drawing of the
original aerosol inlet cone.
Figure A.1.4: Drawing of the
modified aerosol inlet cone.
The increase of cone length to 9.4 mm allows to confine the flow by filling the open zone and to avoid electric field penetration into the upstream side of the entrance slit.
The original gap spacing between the entrance of the classifying region and the existing conical inlet is 10,5 mm. To aerodynamically shape the inlet the outer cylinder were modified: a 45° sloped wall is used to guide the aerosol gradually into
the classifying region. A consequence of the cone length modification, the overall
length of the column is reduced to 440 mm. Figure A.1.5 and A.1.6 shows the design of the aerosol entrance slit before and after the modification.
Figure A.1.5: Drawing of the original
aerosol/sheath DMA inlet. (gap=10.5 mm)
Figure A.1.6: Drawing of the modified
3.2 Modification of the DMA base
To reduce particle losses at the exit slit, the length of the insulator is shortened to a minimum for reducing charged particle deposition. The Teflon insulator is replaced with slightly conducting material (Kemetal®), which contributes to dissipate some of the electric charges built up on the insulator surface. In addition, the bend of the transport passage in the metal base is suppressed so that the mono-dispersed
aerosol exits the column in a straight way. The design of the modified aerosol DMA
base is shown in Figure A.1.7.
Figure A.1.7: Drawing of the modified DMA base.
Insulator Insulator
4. VALIDATION OF THE MODIFIED TSI DMA USING NUMERICAL
MODELING
Prior to the construction of the modified inlet, the performance of the original TSI DMA inlet and the modified one was evaluated using the Computational Fluid Dynamics (CFD) Flow Modelling Software, FLUENT 6.1. The computational domain consists of the aerosol transport passage starting from the exit of the aerosol plenum chamber and extending through the classifying region of the TSI DMA. The aerosol exit slit is not included.
Figure A.1.8a and A.1.8b shows the mesh distribution around the region where the aerosol flow and the sheath flow meet for the original and modified inlet.
Figure A.1.8a: Mesh
distribution around the region close to the original TSI DMA aerosol entrance slit.
Figure A.1.8b: Mesh
distribution around the region close to the modified TSI DMA aerosol entrance slit.
CENTER ROD INLET CONE OUTER TUBE OUTER TUBE CENTER ROD INLET CONE OUTER TUBE OUTER TUBE
Figure A.1.9a and A.1.9b shows the modelled velocity vector coloured by velocity magnitude (ms-1) in the region close to the entrance slit for aerosol/sheath flow ratio β = 1.0/10.0 (lmin-1
) / (lmin-1) both for original and modified inlet.
Figure A.1.9a:
Flow pattern for the region close to the aerosol entrance slit of TSI DMA at β=1.0/10.0
Figure A.1.9b:
Flow pattern for the region close to the aerosol entrance slit of modified DMA at β=1.0/10.0
A flow recirculation zone is predicted only for the conventional TSI DMA inlet, as shown in Figure A.1.9a. The modified inlet shows a good flow matching between the aerosol and sheath streams for β = 1.0/10.0 (lmin-1) / (lmin-1) and lower (i.e. 1.0/20, 0.5/20 and 0.3/20, not in this document).
The particles trajectories inside the original TSI DMA inlet have been modelled. The re-circulating particle vortex increases with decreasing aerosol/sheath flow ratio but is
not present when the modified inlet cone is used, as is clearly shown in Figure A.1.10a and A.1.10b for the same particle diameter and flow ratio.
Figure A.1.10a:
100 nm particle traces close to the aerosol entrance slit of TSI DMA at β=1.0/10.0
Figure A.1.10b:
100 nm particle traces close to the aerosol entrance slit of the modified inlet DMA at β=1.0/10.0
Clearly, recirculation will increase even more for the conventional TSI DMA inlet
when using lower aerosol/sheath flow ratio as is illustrated in Figure A.1.11a and
A.1.11b.
Figure A.1.11a:
Flow pattern for the region close to the aerosol entrance slit of TSI DMA at β=0.3/20
Figure A.1.11b:
Flow pattern for the region close to the aerosol entrance slit of modified DMA at β=0.3/20
We can therefore conclude that the modifications of the aerosol entrance slit greatly enhance the coherence of the aerosol flow and limits turbulent diffusion. The transfer efficiency as well as the size resolution of the DMA column are therefore potentially improved by these modification.
5. EXPERIMENTAL VALIDATION OF THE MODIFIED DMA
5.1. Tandem DMA arrangementsThe experimental determination of a DMA transfer function is often performed using a
Tandem DMA (TDMA) arrangement, as suggested by e.g., Stolzenburg (1988) and
Rader and McMurry (1986). The TDMA arrangement implies that similar DMAs are used in series. In this study, two different TDMA setups are operated with the specificities shown in Table A.1.1:
DMA Type Inner
radius Outer radius Effective length Qa DMA1 Qa DMA2 Qex=Qsh DMA1 Qex=Qsh DMA2 TDMA 1 Vienna type (Lund) 2.5 cm 3.3 cm 11.4 cm 2.0 lmin -1
1.0 lmin-1 13.5 lmin-1 6.75 lmin-1
TDMA 2 TSI type
modified 0.9375 cm 1.95 cm 44.0 cm 2.0 lmin
-1
1.0 lmin-1 13.5 lmin-1 6.75 lmin-1
Table A.1.1: TDMA specificities used in this work.
TDMA1 and TDMA2 setups were used to compare the real transfer function of the DMA built at Lund University (i.e. medium Vienna Type DMA) and the modified DMA in the size range 10 -150 nm. A schematic of this setup is shown in Figure A.1.12.
5.2. Particles generation
Two different aerosols species were generated using two different setups. The first arrangement, illustrated in Figure A.1.13, was used to measure aerosol particles in the size range 20 -150 nm.
Figure A.1.13: Schematic of aerosol generation setup to produce NaCl particles. Qa and Qd refer to
the gas flow of the atomizer and the additional dilution air flow, respectively.
A laboratory NaCl aerosol was produced by nebulising a 0.1 weight percent solution of NaCl and by clean water (18.2 MegaOhm Ultra Pure Water) with an atomiser (TSI Model 3670). After dispersion, the polydisperse NaCl aerosol is further mixed with sheath air for drying and dilution in a mixing chamber (100 l) to ensure a stable particle concentration during time. When approaching the sizes well below 20 nm another aerosols generation arrangement was necessary. We used a hot wire
generator (custom made) shown in Figure A.1.14.
Figure A.1.14: Schematic of the hot wire generator. The cover is Pirex
glass and the removable pure Cu-Zn wire have a spiral shape.
Constant Current Power Supply
Wire
Filtered Dry
Air Flow Aerosol Particles
Constant Current Power Supply
Wire
Filtered Dry
Air Flow Aerosol Particles
Dp dN/dlogDp Filter 3-way Valve manual Valve Dilution Unit Bipolar Charger
VTDMA
Atomizer Liquid Trap Qa Qd Sheath air INSTRUMENTThe primary output material of the heated pure Cu-Zn wire is assumed to consist of vapor phase oxides of Cu and Zn, presumably a mixture of CuO and ZnO, wich rapidly ends up in particulate phase due to high temperature gradients. However, for the matter of this study, the nature of the particles is irrilevant.
The total flow rate of clean air through the generator were varied in the range of 1-10
lmin-1 and the electric current through the wire was varied between 4 and 7 A,
depending on the particle size range and concentration needed.
As exemple, a particle size distribution from the hot wire generator and the atomiser generator are presented in Figure A.1.15a and A.1.15b, respectively.
10 100 1000 10000 100000 0 2 4 6 8 10 12 14 16 18 20 Dp [nm] d N /d lo g D p [ # /c c ]
Figure A.1.15a: Size
distribution from the wire generator (current 5 A, flow 3 lmin-1) measured by DMA and TSI Electrometer.
10 100 1000 10000 100000 0 20 40 60 80 100 120 140 160 180 200 Dp[nm] d N /d lo g D p [ # /c c ]
Figure A.1.15b: Size
distribution from the atomiser generator measured by DMA and TSI CPC 3010.
5.3. DMA size calibration with latex spheres
As discussed above, the certainty of the size selection of a DMA depends on the stability of flow rates, the geometry and the voltage supply which consists of the computer device in connection with the high voltage supply. For characterization of the size selection of the DMA, latex spheres with diameters of 100 and 300 nm suspended in distilled water have been nebulized using an atomizer (TSI 3076) for production of submicrometer aerosol particles.
After leaving the atomizer the particles were dried using a diffusion dryer tube, although it has been assumed that the particles have not taken up any water. It has been found that all particles were selected at grater diameters than expected. In Table A.1.2, the expected and the experimentally derived diameters are listed.
Expected diameter of latex spheres (nm)
Experimentally derived diameter with the TSI
Modified DMA (nm)
Deviation in %
100 107 7 300 304 4 Table A.1.2: Expected and experimentally derived diameters of latex spheres
using a TSI modified DMA.
As comparaison with previous study (Massling, 2002), in Table A.1.3 are
summarized the results of the same calibration test made with an Hauke Type DMA (i.e. similar geometry to the Lund Vienna Type DMA).
Expected diameter of latex spheres (nm)
Experimentally derived diameter with the TSI
Modified DMA (nm)
Deviation in %
100 118 18 248 268 8 Table A.1.3: Expected and experimentally derived diameters of latex spheres
using a Hauke Type DMA.
As shown in Table A.1.3 the deviation of sizing observed with the “Non genuine” Vienna Type DMA are nearly the double of the TSI DMA. A possible reason for the size discrepancy could be the different design and the poor coaxiality of central rod inside the column of the DMAs.
In Figure A.1.16, the number size distribution of the 100 nm latex spheres taken with a TSI Modified DMA is shown.
0 2000 4000 6000 8000 10 100 1000 Dp (nm) # /c c PSL 100 nm measured data points
Figure A.1.16: Particle number size distribution taken with a TSI Modified DMA without the
modified inlet cone of 100 nm latex spheres.
Obviously, the particles have been found at a value of 107 nm. All maxima found on the left side of the main maximum can be attributed to multiply charged particles (see Appendix A.1). The mean diameters of each peak show exactly the multiple value of electrical mobility of the main peak.
5.4. TDMA Comparison results
The comparison of the transfer functions for 15, 50 and 100 nm particle diameters for both the Vienna Type Lund TDMA arrangement and the TSI Type Modified TDMA arrangement are shown in Figure A.1.17. Identical flow ratio in the first DMA
(2.0 / 13.5 lmin-1 / lmin-1) and the second DMA (1.0 / 6.75 lmin-1 / lmin-1 ) are used for both TDMAs. Y-axis represents the count ratio between CPC2 and CPC1 (i.e. relative counts). 0 0.2 0.4 0.6 0.8 1 1.2 10 100 1000 Dp (nm) R e la ti v e c o u n ts Lund TDMA LaMP TDMA
Figure A.1.17: Transfer function comparison for Lund DMA and LaMP-DMA for 15, 50 and 100 nm
particle.
A significant improvement is clearly seen for the TSI Modified DMA as respect to Lund Vienna Type DMA. The improvement concerns both the detection sensitivity and transfer function width in particular for the 15 nm particles. It is seen that the resolution of the TSI Modified DMA is nearly ideal (with transfer function Half-Width of 0.15) down to 15 nm. The Lund Vienna Type DMA transfer function deviates significantly from the ideal condition. As it is seen in Figure A.1.17 the broadening of the transfer function width is higher than predicted by theory even for 100 nm diameter particle (with transfer function Half-Width of 0.2).
Because we do not have two original TSI DMAs for performing a comparison between modified TDMA and original TSI TDMA, an additional test was conducted to
investigate the impact of the modified aerosol inlet cone in the DMA. Figure A.1.18
shows results from a comparison between the two DMAs with and without the modified inlet cone for 10 nm particles.
0 0.05 0.1 0.15 0.2 0.25 0.3 7 8 9 10 11 12 13 14 Dp (nm) R e la ti v e c o u n ts without modification with modification
Figure A.1.18: Modified DMA transfer function comparison for 10 nm particle with the
standard inlet cone (“without”) and with the modified one (“with”).
This test confirms results obtained previously showing that the new inlet design permits higher resolution measurement than conventional TSI- or Vienna-type DMAs. The modifications permit a significant reduction of diffusion losses and limit the broadening effect of the transfer function width in the ultra-fine size range. This improved ability to select a precise particle size is not obtained at the expense of the DMA transfer efficiency. This is confirmed by a direct comparison of a DMPS spectrum, with an integrated counting performed using a CPC, given for the two DMAs with and without the modified inlet cone.
Figure A.1.19: Total CPC count vs integrated DMPS spectra with (red dot) and without (blue dot) the
modified DMA.
The experiment was performed using generated aerosols of dimension lower than the maximum scanning diameter of the DMPS (i.e. range=5 - 250 nm). Results are
shown in Figure A.1.19. Clearly, a very good agreement is found leading to the
conclusion that the modified DMA is well-suited for atmospheric aerosol size characterization. 7,0E+03 7,5E+03 8,0E+03 8,5E+03 9,0E+03
7,0E+03 7,5E+03 8,0E+03 8,5E+03 9,0E+03
CPC Tot
D
M
P
S
without long cone
7,0E+03 7,5E+03 8,0E+03 8,5E+03 9,0E+03
7,0E+03 7,5E+03 8,0E+03 8,5E+03 9,0E+03
CPC Tot
D
M
P
6. CONCLUSIONS
The particle classification using a DMA relies heavily on geometry and optimal designs of the DMA column as well as on the accurate control of all the air flows in the DMPS. In this context, the most important sources of error and, furthermore, deviations from the ideal transfer function shape for the “Non genuine” Vienna Type DMA (i.e. Lund DMA) could arise from:
(a) poor design and consequently mixing of the aerosol and sheath air flows inside the DMA analyser leading to irregularities (i.e. “humps” visible especially in Figure A.1.17 for 15 nm particles) in the transfer function.
(b) poor coaxiality of central rod inside the DMA column leading to irregularities in the electric field ( the central rod is not fixed at two extremities).
(c) furthermore, some minor errors are generated due to inaccuracies in the definition and measurement of the DMA dimensions as well as in the measurement of the DMA voltage for each mobility class.
We have validated in our study a newly-built Differential Mobility Analyser. After numerical evaluation and construction we have shown that the aerosol/sheath flow inlet modification permit a significant reduction of diffusion losses and limit the broadening effect of the transfer function width in the ultra-fine size range. It is concluded that the re-designed features increase the performances of a DMA.
ACKNOWLEDGMENTS
The authors would like to acknowledge the financial support of the CNRS National Program for Atmospheric Chemistry (PNCA), ADEME and Ministère de l’Ecologie et du développement durable under the PRIMEQUAL program, the scientific council of region Auvergne. P. Villani acknowledges financial support from CNRS and region Auvergne under the BDI program.
REFERENCES
Ankilov, A., Baklanov, A., Colhoun, M., Enderle, K. H., Gras, J., Julanov, Y., Kaller, D., Lindner, A., Lushnikov, A. A., Mavliev, R., McGovern, F., O’Connor, T. C., Podzimek, J., Preining, O., Reischl, R., Rudolf, R., Sem, G. J., Szymanski, W. W., Vrtala, A. E., Wagner, P. E., Winklmayr, W., Zagaynov, V. (2002). Particle size dependent response of aerosol counters. J. Atmos. Research. 62, 209-237.
Birmili, W., Stratmann, F., Wiedensohler, A., covert, D., Russell, L. M. (1997). Determination of Differential Mobility Analyser Transfer Functions using identical instruments in series. Aerosol Sci. and Techno. 27:215-223.
Chen, D. R., Pui, Y. H., Mulholland, W. and Fernandez, M. (1999). Design and testing of an aerosol/sheath inlet for high resolution measurements with a DMA. J. Aerosol Sci. 30 (8), 983-999.
Chen, D. R., Pui, Y. H., Hummes, D., Fissan, H., Quant, F. R. and Sem, G. J. (1998). Design and evaluation of a nanometer aerosol differential mobility analyser (Nano-DMA). J. Aerosol Sci. 29 (5/6), 497-509.
Collins, D. R., Nenes, A., Flagan, R. C. and Seinfeld, J. H. (2000). The scanning flow DMA. J. Aerosol Sci. 31 (10), 1129-1144.
Flagan, R. C. (1999). On differential mobility analyszer resolution. Aerosol Sci. and Technol. 30:556-570.
Flagan, R. C. (2004). Opposed migration aerosol classifier (OMAC). Aerosol Sci. and Technol. 38:890-899.
Jokinen, V. and Makela, M. (1997). Closed-loop arrangement with critical orifice for DMA sheath/excess flow system. J. Aerosol Sci. 28 (4), 643-648.
Karlsson, M. N. A., Frank, G. and Martinsson, B. G. (2000). Measurement of the differential mobility analyser transfer function. J. Aerosol Sci. 31 (S1), S23-S24.
Karlsson, M. N. A. and Martinsson, B. G. (2003). Method to measure and predict the transfer function size dependence of individual DMAs. J. Aerosol Sci. 34, 603-625.
Knutson, E. O. and Whitby, K. T. (1975). Aerosol classification by electric mobility: apparatus, theory, and applications. J. Aerosol Sci. 6, 443-451.
LaFranchi, B. W., Knight, M., Petrucci, G. A. (2003). Leaching as a source of residual particles from nebulization of deionized water. J. Aerosol Sci. 34, 1589-1594.
Le Bronec, E., Renoux, A., Boulaud, D. and Pourprix, M. (1998). Use of a radial flow mobility analyser to determine the mass and density of aerosol particles. J. Aerosol Sci. 29 (S1), S409-S410. Maisels, A., Kruis, F. E., Fissan, H. (2004). Coagulation in bipolar chargers. J. Aerosol Sci. 35,
1333-1345.
Mertes, S., Schroder, F. and Wiedensohler, A. (1995). The particle detection efficiency curve of the TSI-3010 CPC as a function of the temperature difference between saturator and condenser. Aerosol Sci. and Technol. 23:257-261.
Reischl, G. P., Makela, J. M., Necid, J. (1997). Performance of Vienna type differential mobility analyser at 1.2-20 nanometer. Aerosol Sci. and Technol. 27:651-672.
Scheibel, H. G. and Porstendörfer, J. (1983). Generation of monodisperse Ag- and NaCl-aerosols with particle diameters between 2 and 300 nm. J. Aerosol Sci. 14, 113-126.
Stolzenburg, M. R. and McMurry, P. H. (1988). TDMAFIT Users' Manual. Minneapolis, Minnesota Stratmann, F., Orsini, D. and Kauffeldt, T. (1997). Inversion algorithm for TDMA measurements. EAC
1997, Hamburg. J. Aerosol Sci. S701-S702.
Stratmann, F.,Kauffeldt, T., Hummes, D. and Fissan, H. (1997). Differential electrical mobility analysis: a theoretical study. J. Aerosol Sci. and technol. 26,368-383.
Wang, S. C. and Flagan, R. C. (1990). Scanning electrical mobility spectrometer. Aerosol Sci. and Technol. 13:230-240.
Wiedensohler, A. (1988). An approximation of the bipolar charge distribution for particles in the submicron size range. J. Aerosol Sci. 3, 387-389.
C
HAPITRE
I.2
Volatility Tandem Differential Mobility Analyser
La mesure des propriétés volatiles de l’aérosol a été initiée au LaMP à la suite des travaux de
Sellegri et al. (2003) montrant que les composés organiques les moins volatiles étaient également les mieux lessivés par les gouttelettes de nuages. Ceci avait motivé la construction d’un analyseur différentiel de mobilité tandem pour la mesure de la volatilité des particules (V-TDMA) dont la première version a été achevée dans le cadre de la thèse de Régis Dupuy (Dupuy, 2003) et de mon DEA (Villani, 2003).
L’objectif du V-TDMA était de pouvoir procéder à une analyse des fractions volatiles en ligne, en particulier derrière un système d’impacteur virtuel à contre-flux (CVI : counter flow virtual impactor). Le principe du V-TDMA se base sur le fait que la température de volatilisation d’une particule d’aérosol dépend de sa composition chimique. Lorsqu’une population d’aérosols est chauffée, une partie de ses composants retourne à l’état gazeux. La volatilisation d’une fraction ou de la totalité de ses composants correspond à une perte en masse de la phase aérosol au profit de la phase gazeuse et affecte la granulométrie de l’aérosol, d’où l’intérêt du couplage volatilité / granulométrie. La température à laquelle se produit cette volatilisation donne donc une indication sur la nature chimique des particules. La nature chimique des particules pouvant évoluer en fonction de leur taille, l’information sur la température de volatilité doit être accessible sur toute la gamme de taille des aérosols. Cette technique a permis de montrer que la plupart des particules de taille inférieure à 1 µm sont dominées par le sulfate (Clarke, 1987 ; Pinnick, 1993 ; Rood, 1987). Le V-TDMA a été utilisé pour étudier les composés volatiles à base de sulfate à des températures de 250°C (Covert and Heintzenberg, 1993) et pour identifier la fraction d’acide sulfurique des aérosols avec une température de 120°C (Orsini et al., 1999). La première partie de ma thèse a donc consisté au développement d’une version améliorée du V-TDMA ainsi qu’à sa validation. C’est l’objet du chapitre I.2 de ce travail de thèse.
L’analyseur de volatilité / granulométrie se compose schématiquement de deux parties distinctes. La première partie concerne la mesure des particules et comprend les deux DMAs décrit dans le chapitre précédent, et leurs systèmes d’acquisition / contrôle, le neutraliseur de charge (Appendix A.1) ainsi que les deux compteurs de particules (Appendix A.2). La seconde partie est constituée par le système de thermo-désorption (Appendix A.5). Le V-TDMA est illustré sur la Figure I.2.1.
Figure I.1.2: V-TDMA
Le chapitre suivant décrit en détails le système V-TDMA, les procédures de contrôle et d’inversion des données, la détermination de la fonction de transfert des particules et les tests de validation de l’appareil. Ce chapitre fait l’objet d’une publication en révision à Aerosol Research and Technology.
19” Rack PC Electronique d’acquisition 6 Thermo-desorber CPC DMA Electro-vannes de distribution 19” Rack PC Electronique d’acquisition 6 Thermo-desorber CPC DMA Electro-vannes de distribution
DESIGN AND VALIDATION OF A 6-VOLATILITY
TANDEM DIFFERENTIAL MOBILITY ANALYSER
(V-TDMA)
P. Villani1, D. Picard1, N. Marchand1, *, K. Sellegri1, P.Laj1
1
Laboratoire de Météorologie Physique ,CNRS, Université Blaise Pascal, Aubière, France
*
ABSTRACT
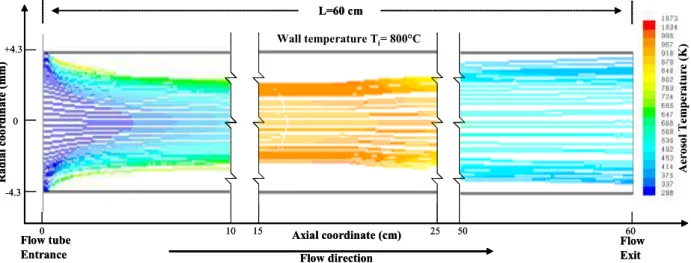
A volatility tandem differential mobility analyzer (V-TDMA) was developed to allow fast field measurement of the volatile fraction of atmospheric aerosol particles in the particle size range 20-650 nm. In this V-TDMA the volatile compounds are evaporated by heating the aerosol to a temperature between 25°C and 300°C. The heating unit is equipped with six symmetric columns kept at different temperatures that allow the heating temperature to be rapidly changed so that a higher temporal resolution can be achieved compared to a regular V-TDMA. This work first focuses on the design and calibration of the heating units for the conditioning of a selected aerosol sample while minimizing sample losses due to thermophoresis and diffusion. The design was based on the modeling of the profiles of temperature and velocity and the behavior of a monodisperse aerosol in the heating units, using Computational Fluid Dynamics (CFD) Flow Modeling Software, FLUENT 6.1. This allowed for initial estimations of the heater dimensions and also calculation of the minimum length of heating tube needed to completely evaporate the aerosol particles at high temperature with sufficient residence time, as well as to cool the aerosol sample down to ambient temperature. Next, the aerosol heating rate and aerosol deposition losses within the flow tube were estimated, and re-condensation of volatilized compounds evaluated. Then the V-TDMA was calibrated and tested in the laboratory to determine the transfer efficiency, and finally, atmospheric aerosols were analyzed, with the first results presented here. This work emphasizes the need for better standardization of thermo-desorbing units for atmospheric aerosol studies.
1. Introduction
In recent years, much attention has been directed towards understanding the effect of aerosols on a variety of processes in the earth’s atmosphere. Physical properties such as aerosol total number concentration, number size distribution and the chemical composition of submicron atmospheric aerosol particles are key parameters controlling the direct and indirect radiative forcing of the climate by
aerosols (IPCC, 2001). These particles affect the radiation budget directly by
scattering and absorbing incoming solar radiation, and indirectly through their ability
to modify cloud microphysics and albedo (IPCC, 2001). There has been an
increasing need for size-resolved measurement of the chemical behavior of fine atmospheric aerosols. Many techniques for the determination of aerosol chemical composition and structure are currently used for atmospheric studies.
Analyses of particle thermal properties are based on the fact that most components present in aerosols are volatile at a characteristic temperature. When temperature increases, a fraction of the chemical constituents of an aerosol particle volatilizes resulting in a change in both number concentration (when a particle is totally volatilised) and size. From the temperature at which complete or partial volatilization takes place, the chemical composition and the degree of mixing within the population can be estimated.
The most common airborne volatility methods to determine aerosol composition are based on the principle of passing the aerosol through a conditioning tube where the specific chemical components are evaporated at predefined temperatures (O’Dowd et al., 1992; Jennings et al., 1994 and 1997; Burtscher et al.,
2001). To determine the corresponding refractory fraction, the residual size
distribution is measured with either an optical particle counter or a scanning mobility particle sizer, and is then compared to the initial distribution. To separate the volatile from the non-volatile compounds (e.g., elemental carbon, crustal material, sea salt), most of these measurements are made at temperatures below 300°C. To infer the fraction of elemental carbon, measurements are made between 800°C–1000°C,
however, they require complex instrumentation and an inert atmosphere (Jennings
Tandem Differential Mobility Analyzer (TDMA) provides information on particle composition and size, in almost real time, and hence offers a powerful advantage over many other methods that require longer time-integration. Classically, TDMAs are
used to characterise either hygroscopic properties (Humidity-TDMA) (Rader et al.
(1986) or thermal properties of atmospheric particles (Volatility-TDMA) (Orsini et al. (1998)).
In this work, we present the development of a new Volatility-TDMA (V-TDMA) system constructed to measure the size-resolved volatile behavior of aerosols in the size range 20 < Dp < 550 nm with fast time-integration at temperature up to 300°C. In
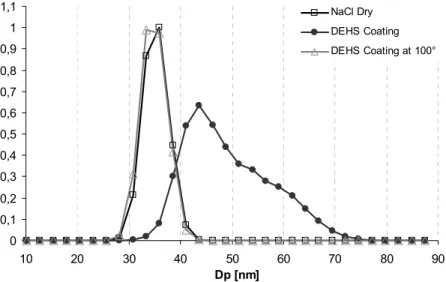
this paper, a detailed technical description of this newly-built V-TDMA is presented together with an accurate evaluation of the different artifacts associated with V-TDMA operations. The first measurements performed are presented in addition to the potential application of V-TDMA techniques to study the role of particle coating.
2. Instrument design
2.1 TDMA system
2.1.1 Conception of the TDMA
The TDMA system, shown in Figure A.2.1, is based on two DMAs assembled in
series (i.e. Vienna Type DMA, inner radius =2.5 cm, outer radius =3.3 cm, length =28 cm, Aerosol-Related Atmospheric Research Lund University, Swietlicki et al., 2002) in order to study aerosol properties as a function of the selected particle size. All aerosol tubes in the TDMA are of stainless steel with inner and outer diameters of 4 and 6.35 mm, respectively. In order to avoid particle losses, the tube lengths and number of bends were minimized. A laminar flow is maintained through all sampling lines (Re<2000).
The system can be broken down into three main steps:
• Step 1 consists of particle selection from the polydisperse aerosol
sample source using the first differential mobility analyser (DMA 1). In this step the aerosol first enters a silica gel diffusion dryer to dry the particles down to RH<15%.
The dry aerosol is then charged with a bipolar diffusion charger (63Ni) and enters
DMA1. A voltage V1 is set to select a narrow mobility bandwidth aerosol from the polydisperse aerosol source. The narrow size range is defined by the transfer function of the differential mobility analyser (DMA) (Knutson and Whitby (1975)). The monodisperse sample aerosol flow Qs exiting DMA1 is split into two paths: one half of the sample is directed to step 2 and the other to the first condensation particle counter (CPC1, TSI Model 3010). CPC1 is used to continuously monitor the concentration of the DMA1-selected aerosol (i.e. the concentration of the aerosol sent to step 2).
• In step 2, the aerosol is heated to predefined temperatures in one of the
six parallel heating columns. If the aerosol sample is volatile at the given temperature, the conditioning process could alter the mobility distribution, so a measurement of residual particle number size distribution is required.
• In step 3 the second DMA (DMA2), in series with a second
condensation particle counter (CPC2, TSI Model 3010), scans 24 channels in a stepping mode (i.e. DMPS) to determine the new conditioned mobility distribution. One measurement of one particle diameter for each conditioning temperature takes about 8 min.
2.1.2 Sheath Airflow System
The DMAs are operated at flow rates (sample flow/sheath air flow) of 2.0/13.5 lmin-1 (β=0.15, DMA1) and 1.0/6.75 lmin-1 (β=0.15, DMA2). Air flow is arranged in a closed re-circulating loop. The sheath air is treated with diffusion dryers and two total filters are placed in both sheath lines and excess-flow lines to remove particles and protect mass-flow meters and needle valves. Apart from the stability of the flows, operating the DMAs in a closed-loop arrangement also has the advantage of being relatively simple and robust for field campaign measurements. Another critical point is that the pump works at a temperature of approximately 50°C. Outgassing material from inside