HAL Id: hal-02410305
https://hal.archives-ouvertes.fr/hal-02410305
Submitted on 13 Dec 2019
HAL is a multi-disciplinary open access
archive for the deposit and dissemination of
sci-entific research documents, whether they are
pub-lished or not. The documents may come from
teaching and research institutions in France or
abroad, or from public or private research centers.
L’archive ouverte pluridisciplinaire HAL, est
destinée au dépôt et à la diffusion de documents
scientifiques de niveau recherche, publiés ou non,
émanant des établissements d’enseignement et de
recherche français ou étrangers, des laboratoires
publics ou privés.
Tonal Noise Prediction of a Modern Turbofan Engine
with Large Upstream and Downstream Distortion
Majd Daroukh, Stéphane Moreau, Nicolas Gourdain, Jean-François Boussuge,
Claude Sensiau
To cite this version:
Majd Daroukh, Stéphane Moreau, Nicolas Gourdain, Jean-François Boussuge, Claude Sensiau. Tonal
Noise Prediction of a Modern Turbofan Engine with Large Upstream and Downstream Distortion.
17th International Symposium on Transport Phenomena and Dynamics of Rotating Machinery
(IS-ROMAC2017), Dec 2017, Maui, United States. �hal-02410305�
Tonal Noise Prediction of a Modern Turbofan Engine
with Large Upstream and Downstream Distortion
Majd Daroukh
12*, St´ephane Moreau
3, Nicolas Gourdain
4, Jean-Franc
¸ois Boussuge
1, Claude Sensiau
2S Y M P OS IA ON ROTATING M A C H I N E R Y ISROMAC 2017 International Symposium on Transport Phenomena and Dynamics of Rotating Machinery Maui, Hawaii December 16-21, 2017 Abstract
Ultra High Bypass Ratio (UHBR) engines are designed as compact as possible and are characterized by a short asymmetric air inlet and heterogeneous Outlet Guide Vanes (OGVs). The flow close to the fan is therefore circumferentially non-uniform (or distorted) and the resulting noise might be impacted. This is studied here at take-off conditions by means of a simulation of the Unsteady Reynolds-Averaged Navier-Stokes (URANS) equations of a full-annulus fan stage. The model includes an asymmetric air inlet, a fan, an heterogeneous OGV row and homogeneous Inlet Guide Vanes (IGVs). Direct acoustic predictions are given for both inlet and aft noise. A filtering procedure based on a modal decomposition is applied for the aft noise analysis. The noise mechanisms that are generally considered (i.e. the interaction of fan-blade wakes with OGVs and the fan self-noise) are shown to be impacted by the distortion. In addition, new sources caused by the interaction of the stationnary distortion with the fan blades appear and contribute to the inlet noise.
Keywords
Fan tonal noise — Inlet distortion — Heterogeneous OGVs – Direct approach
1CFD Team, CERFACS, Toulouse, France
2Aerodynamics and Acoustics Department, Safran Aircraft Engines, Moissy-Cramayel, France
3Mechanical Engineering Department, Universit´e de Sherbrooke, Sherbrooke, Canada
4Department of Aerodynamics, Energetics and Propulsion, ISAE, Toulouse, France
*Corresponding author: daroukh@cerfacs.fr
INTRODUCTION
Fuel consumption and noise reduction triggers the evolution of aircraft engines towards Ultra High Bypass Ratio (UHBR) architectures. To limit the weight and drag of these engines, the nacelles are designed as compact as possible and are char-acterized by a short air inlet and heterogeneous Outlet Guide Vanes (OGVs) with integrated pylon. These geometry evo-lutions introduce an important flow inhomogeneity, called distortion, close to the fan. This distortion interacts with the rotating fan and creates acoustic sources on the blades [1]. Most studies conducted so far neglected these sources because they were not important in conventional engine ar-chitectures. Two noise mechanisms were therefore generally considered: the interaction of fan-blade wakes with the OGVs [2] and the fan-self noise (essentially the fan-blade shocks) at transonic regime [3]. However, with the high levels of distortion expected in UHBR engines, the sources caused by the distortion might also contribute to the noise.
Their contribution started to be studied recently by the community and the complexity of the studies has been in-creased step by step. Holewa et al. [4] studied the impact of the bifurcations (or pylon) on the fan tonal noise by means of a quasi-3D numerical simulation of a fan and OGVs with struts and bifurcations. They found that the noise generated by the distortion-fan interaction was negligible compared with the one generated by the wakes-OGVs interaction. How-ever, they highlighted the influence of the potential effect of the bifurcations on the latter. This last point was also
studied by Bonneau et al. [5] and Roger & Caule [6] who explained the unexpected emergence of the Blade Passing Frequency (BPF) by the invalidity of Tyler & Sofrin’s rule [7] in the presence of an azimuthal heterogeneity. In contrast with the study of Holewa et al. [4], Oishi et al. [8] worked on a fan-OGV-bifurcation configuration in 3D and found that the sources caused by distortion play a major role on the fan tonal noise at high subsonic and transonic regimes. The addition of an asymmetric air inlet was investigated by Sturm et al. [9] and Conte et al. [10] who evaluated the noise caused by an inflow distortion on low-speed fans thanks to analytical models and numerical simulations. In the fields of turbofan, Winkler et al. [11] and Doherty & Namgoong [12] used a numerical approach to predict the noise caused by an asymmetric air inlet. They were able to determine the far-field sound, but they could not draw any conclusion on its contribution to the fan tonal noise because the OGVs were not included.
The originality of the present study is to account for all the fan tonal noise sources in one single simulation by con-sidering a whole fan module with asymmetric air inlet, fan and OGVs including struts and pylon. Such configurations started to be studied only very recently by Sanjos´e et al. [13] and Winkler et al. [14]. The configuration chosen here is a modern turbofan with hard-walled ducts and preliminary studies were done on coarse meshes at cutback conditions using hybrid acoustic predictions [15] and at all certification points (approach, cutback and sideline) using direct ones [16].
Tonal Noise Prediction of a Modern Turbofan Engine with Large Upstream and Downstream Distortion — 2/9
Both studies have highlighted the influence of the distortion on the inlet noise. In the latter study, the aft noise could not be deduced because no proper filtering procedure was used. The sideline point with asymmetric inlet is further analyzed here on a finer mesh and with a new filtering procedure. The study is limited to noise estimates at the BPF which is the most important one but it can be easily extended to its first (2BPF) and second harmonic (3BPF). A brief description of the engine model and numerical setup is first given in Sec. 1. The main flow characteristics are highlighted in Sec. 2 and inlet and aft noise are finally studied in Sec. 3.
1. ENGINE MODEL AND NUMERICAL SETUP
1.1 Engine model
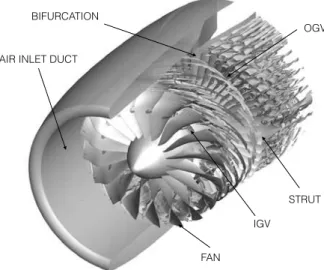
A typical full-annulus turbofan composed of an air inlet duct, a fan, OGVs and Inlet Guide Vanes (IGVs) is chosen in this work and is represented in Fig. 1. The fan has 18 identical blades and there are 93 identical IGVs and 48 non-identical OGVs, including two structural bifurcations (the pylon) at 6 and 12 o’clock and two struts at 3 and 9 o’clock. The inlet is asymmetric and has been designed for the purpose of the study to generate a level of distortion typical of the ones expected for UHBR engines. The sideline operating point is studied in this paper and the corresponding relative tip Mach number is around 1.1. The fan is therefore transonic and shocks are expected to propagate in the inlet.
FAN
OGV
IGV AIR INLET DUCT
STRUT BIFURCATION
Figure 1.Overview of the engine model
1.2 Numerical setup
The URANS equations are solved using ONERA’s CFD solver elsA which is based on a cell-centered finite volume approach on a structured multi-block grid [17]. Wilcox k − ω two-equation model is used to determine the turbulent quantities [18]. Spatial discretization is done with Roe’s scheme (third order accuracy) [19, 20] and the implicit backward Euler scheme with Dual Time Step (DTS) sub-iteration algorithm is used for the temporal one (second order accuracy). One blade passage is described by 200 time steps, leading to a
total of 3600 time steps per rotation. A classical injection boundary condition (total pressure, total enthalpy and flow direction) is used at the inlet. A massflow condition is im-posed at the exit of the primary flux (downstream of the IGVs) while a radial equilibrium with a valve law is used at the exit of the secondary flux (downstream of the OGVs). Sliding non-conformal interfaces are used between the rotat-ing parts (fan) and the fixed parts (air inlet, IGVs and OGVs). The whole mesh is composed of 570 millions of cells and has been done in order to have at least 20 points per wave-length at the 2BPF (necessary to propagate acoustic waves correctly). The main characteristics of the mesh are given in
Tab. 1 with Ntotthe total number of points, Nrthe number
of points in the radial direction, Nθ the number of points in
the azimuthal direction, Ngapthe number of points in the tip
gap and Nx/λ+1BPFthe number of points per wavelength for
acoustic waves propagating upstream at the BPF.
Ntot Nr Nθ Ngap Nx/λ+
1BPF
570 M 200 1800 37 40
Table 1.Mesh characteristics
Since the boundary conditions are reflective, stretching zones have been added at the inlet and the outlets of the do-main. The same strategy with the same numerical tools and parameters was successfully used by Bonneau et al. [5] and one-dimensional test cases have validated the parameters used for the stretching (i.e. expansion ratio and final cell size) [21]. A schematic view of the computational domain in the meridional plane is given in Fig. 2.
AIR INLET DUCT FAN
IGV OGV
STRETCHING ZONES
Figure 2.Schematic view of the computational domain
To converge the blade and vane unsteady loadings (which are representative of the acoustic sources), 7 rotations were needed on a coarse mesh and 3 rotations were needed on the fine mesh. The simulation was run on 1200 processors with a total computational cost of about 1 million CPU hours.
2. MAIN FLOW CHARACTERISTICS
2.1 Basic flow patterns
To provide a global idea of the flow topology in the present configuration, an instantaneous map of normalized axial ve-locity extracted close to the casing (at 95% of channel height) is given in Fig. 3.
Figure 3.Instantaneous contour map of normalized axial velocity at h/H=95%
The field highlights both the fan-blade shocks that prop-agate in the inlet, the fan-blade wakes impacting the OGVs and the OGV wakes. The strut wake crosses the wake of its neighboring vane, which stresses the important inhomogene-ity of the OGVs. The azimuthal inhomogeneinhomogene-ity of the flow is clearly observed and is discussed below.
2.2 Distortion
In the present configuration, the distortion comes from two contributions: the potential effect of the OGVs (including the pylon) and the inlet asymmetry. Both contributions are shown here by performing axial cuts of the mean flow up-stream of the OGVs and the fan in Figs. 4 and 5 respectively.
Figure 4.Normalized mean axial velocity upstream of the
OGVs
Upstream of the OGVs, the flow velocity is reduced be-cause of the different obstacles (pylon and struts). There are four zones of reduced velocity: in the order of importance, at 12 o’clock (big bifurcation), at 6 o’clock (small bifurcation)
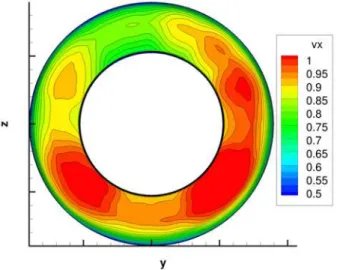
Figure 5.Normalized mean axial velocity upstream of the
fan
and at 3 and 9 o’clock (struts). The potential effect of the clas-sical OGVs (the 44 other vanes) is not visible. Right upstream of the fan, the inlet distortion is also observed. Close to the shroud, the normalized axial velocity presents a minimum value at the top and the trend is inverted close to the hub. These distortions are much more severe than previously re-ported by Sanjos´e et al. in the NASA ANCF configuration [13]. However, as found by Sanjos´e et al., it is worth noting that the circumferential inhomogeneity of the mean flow can be characterized by low-order modes only [13].
This distortion can be quantified at different axial posi-tions x and channel heights h/H using the Circumferential Distortion Coefficient (CDC) defined by:
C DC (x, h/H ) =
Maxθ[M (x, h/H, θ)] − Minθ[M (x, h/H, θ)]
Meanθ[M (x, h/H, θ)]
, (1)
where M (x, h/H, θ) is the Mach number at position (x, h/H,
θ) and Maxθ[.], Minθ[.] and Meanθ[.] stand for the
az-imuthal maximum, minimum and mean values respectively. This coefficient is computed at 25%, 50%, 75% and 95% of channel height and normalized results are given in Fig. 6.
The most important distortion comes from the potential effect of the structural pylon but decreases quickly while going upstream. The axial evolution of this part of the dis-tortion is relatively similar for all radii. Another region of high distortion appears right upstream of the fan because of the inlet asymmetry. It is further emphasized close the tip (at 95% of channel height) where the CDC is almost 5 times higher than the one computed downstream of the fan.
2.3 Fan-blade wakes
A brief analysis of the fan-blade wakes is now given because they are responsible for noise when interacting with the
Tonal Noise Prediction of a Modern Turbofan Engine with Large Upstream and Downstream Distortion — 4/9 0 0.2 0.4 0.6 0.8 1
xhub xfan xnoz xogv
Normalized CDC
Axial position
FAN OGV
Figure 6.Evolution of the CDC along the machine
rotational axis at different channel height: h/H=25%,
h/H=50%, h/H=75%, h/H=95%
OGVs. The evolution of the velocity deficit during two blade passages is given in Fig. 7 for two probes. The probes are located close to the OGVs leading edge and close to the tip (at 95% of vane height). They correspond to two azimuthal
positions θ1 = −π and θ2= π/3. The probes are spaced by
2π/3(equivalent to the space between 6 blades or 16 vanes)
so that they are supposed to see the passage of fan-blade wakes at the same time.
-0.03 -0.025 -0.02 -0.015 -0.01 -0.005 0 0 1 2
Normalized velocity deficit
Blade passing period
Figure 7.Time variation of the normalized velocity deficit
upstream of the OGVs at 95% of vane height: position
θ1, position θ2
The difference between the two curves is dramatic, both in terms of amplitude (factor around 2) and in terms of shape
(almost sinusoidal shape at θ1contrary to θ2). In an
homoge-neous configuration, those wakes should be identical. The differences observed here are attributed to the heterogenity of the OGV row and the inlet asymmetry. The azimuthal heterogeneity of the wakes shown here is observed along the whole span. This is evidenced in Fig. 8 whichs gives the circumferential evolution of the maximum value of the velocity deficit for different channel heights.
0.01 0.02 0.03 0.04 0.05 0.06 0.07 0.08 0.09 -π -π/2 0 π/2 π
Normalized maximum velocity deficit
Azimuthal position
Figure 8.Azimuthal variation of the maximum velocity
deficit at different channel height: h/H=25%,
h/H=50%, h/H=75%, h/H=95%
The inhomogeneity of the wakes is observed at all vane heights: the levels vary by about 50%, 30%, 15% and 150% at 25%, 50%, 75% and 95% of vane height respectively. There are no similarities between the different curves and the region of highest velocity deficits is different for each channel height. One possible explanation of the heterogeneity of the wakes is the modification of the angle of attack of the flow upstream of the fan that results from the distortion. The stator acoustic response is therefore far from being close to the one of an homogeneous stator because of both the heterogeneity of the geometry and the one of the impinging wakes.
2.4 Fan-blade shocks
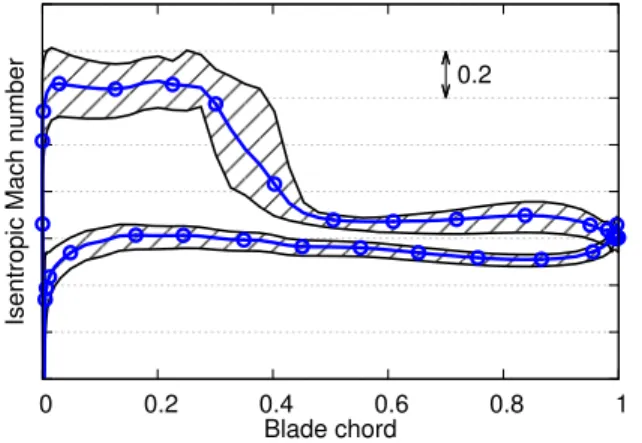
At sideline operating conditions, shocks also develop on the suction side of the blades and propagate in the inlet. Since the distortion is high in the fan-tip region, the shocks may be impacted. This is evaluated here by plotting the isentropic Mach number distribution over one fan blade. Since all blades are identical and equally spaced, they all have the same dis-tribution. It is represented at h/H = 95% in Fig. 9. The distribution varies during the rotation of the fan and both the mean distribution and the lower and upper envelopes are given.
The variation of the isentropic Mach number distribution, shown by the area between the lower and upper envelopes, during the rotation is remarkable. The shock position moves approximately from 30% to 40% of the chord and the shock strength from 0.5 to 0.7 (almost 40% of variation). The shocks that propagate upstream will therefore be different depending on the azimuthal position at which they are generated. The mean distribution is relatively smooth in the shock region because of the averaging procedure. A much more localized jump is observed in instantaneous distributions.
0 0.2 0.4 0.6 0.8 1
Isentropic Mach number
Blade chord 0.2
Figure 9.Isentropic Mach number distribution over one fan
blade at h/H = 95%: mean distribution,
envelope
3. ACOUSTIC ANALYSIS
3.1 Inlet noise
All sources are shown to be impacted by the distortion and the purpose here is to estimate the effect on both inlet and aft noise. For the sake of brevity, the noise at the BPF only (dominant frequency) is analyzed in this article but similar results are obtained at the 2BPF. Inlet noise is first studied be-cause it does not require any filtering procedure. A temporal Fourier transform has been performed during the simula-tion using the co-processing capabilities of Antares [22]. The mean field and the field at the BPF are therefore available in the whole domain, except in the rotor part. With M0, ρ0, a0 the time-averaged Mach number, density and speed of sound
respectively and pBPFand uBPFthe pressure and axial velocity
fluctuations at the BPF, the intensity IBPF(x) at the BPF at point x can be evaluated using Cantrell & Hart’s formulation [23, 24]: IBPF(x) = (1 + M0(x)2)pBPF(x)u∗BPF(x) + M0(x) ρ0(x)a0(x) |pBPF(x)|2 + ρ0(x)a0(x) M0(x)|uBPF(x)|2. (2)
The sign∗denotes the complex conjugate. The intensity is
computed in the whole domain and the acoustic power is then obtained by integrating it at different axial positions. The power evaluated in the inlet plane is shown by the blue line in Fig. 10. In order to provide a deeper analysis of the results, the contribution of the different azimuthal modes is shown by the blue bars. The levels of these bars are obtained after isolating each mode from the others by performing an azimuthal Fourier transform and its inverse. The power asso-ciated with each mode is then evaluated using Eq. (2). The range is specified to cover only 40 dB in order to focus only on the most important modes.
The rotor-locked mode (m = −18) is the most impor-tant mode and can be associated to self-noise [1]. The other
-24 -18 -12 -6 0 6 12 18 24
Acoustic power
Azimuthal mode order
5 dB
Figure 10.Acoustic power carried by the azimuthal modes
and total acoustic power in the inlet plane: total
power, mode power
modes that appear to be dominant are the modes around it, and especially the modes m = −17 and m = −19 which are respectively 3 dB and 7 dB lower than the mode m = −18. These modes are probably linked to the interaction of the fan with the distortion [1], but can also be caused by scattering of the rotor-locked mode because of propagation effects in a distorted flow. To dissociate both contributions, the evo-lution of the power associated with the six most important modes is plotted in the inlet duct in Fig. 11.
xinl xhub xfan
Acoustic power
Axial position 10 dB
FAN
Figure 11.Evolution of the total power and the power
associated with the six most important modes in the inlet
duct: total power, m = −18, m = −17,
m = −19, m = −16, m = −20,
m = −15
All the modes have their most important levels in the source plane (right upstream of the fan) which means that they are generated by the fan. These modes are therefore caused by distortion-fan interaction, except the rotor-locked one which is mainly due to the shocks. Since the distortion is essentially composed of low-order harmonics, the modes that are far from the rotor-locked mode have very low levels. But
Tonal Noise Prediction of a Modern Turbofan Engine with Large Upstream and Downstream Distortion — 6/9
the scattering of the rotor-locked mode on its neighbouring modes m = −17 and m = −16 is also observed from the middle of the inlet duct to the inlet plane (increase of these mode powers while going usptream). This can be seen as the effect of distortion on the shock propagation [12]. Since the OGV row is heterogeneous, the wakes-OGVs interaction noise is expected to be distributed over all modes [5, 15]. Since no other modes than the ones close to the rotor-locked mode is observed, the wakes-OGVs interaction mechanism is not expected to impact the inlet noise.
3.2 Hydrodynamic/acoustic splitting
The goal is now to repeat the same analysis for the aft noise. However, hydrodynamic perturbations are present down-stream of the OGVs and they are known to dominate the fluctuations that are extracted from the simulations. A filter-ing procedure must therefore be applied. A new technique has been tested in this study and the way it is used is de-scribed below.
At each section, the field at the BPF (static pressure and axial velocity, which are used in Eq. (2)) is decomposed into duct modes using the local duct radii. For example, the
pressure at the BPF pBPFat point (x, r, θ) can be written:
pBPF(x, r, θ) = +∞ X m=−∞ +∞ X n=0 pm n(x)ψm n(x, r, θ), (3)
where ψm n(x, r, θ)is the duct eigenfunction of azimuthal
order m and radial order n:
ψm n(x, r, θ) =
[Am n(x) Jm(αm n(x)r ) + Bm n(x)Ym(αm n(x)r )] e−i mθ.
(4)
Jmand Ymare the Bessel functions of order m of the first and
second kinds respectively and Am n, Bm nand αm nare duct
coefficients determined from the boundary conditions at hub
and shroud. The pressure modal coefficient pm n(x)is
ob-tained from the simulations by a projection of the azimuthal
Fourier components pm(x, r )over Bessel’s functions:
pm n(x) = 2π Γm n Z Rt Rh pm(x, r ) [Am n(x) Jm(αm n(x)r ) + Bm n(x)Ym(αm n(x)r )] r dr, (5)
with Γm n the norm of the duct eigenfunction ψm n, Rhand
Rtthe hub and tip radii respectively.
This decomposition relates to Rienstra’s theory in which
each mode is characterized by its axial wavenumber γ±m n
[25], with + and - standing for the upstream and downstream propagation respectively. It should be noted that this theory is only valid in a slowly varying annular duct without bifur-cation. It has been shown that the presence of a bifurcation
leads to the generation of standing modes instead of rotat-ing modes [5]. To make the analysis easier, the bifurcation will not be considered explicitly in the model. However, the acoustic field should still be correctly described with the clas-sical decomposition given by Eqs. (3), (4) and (5) because a standing mode can always be seen as the superposition of a co-rotating mode and a counter-rotating mode of the same amplitude. Because the bifurcation is expected to have an impact essentially on the angular phase of the modes, the fil-tering proposed below, which is based on axial wavenumber considerations, makes sense even in the bifurcated duct.
To apply the filtering, the axial evolution of each mode is analyzed. The purpose is to extract only what is propagated
downstream with the theoretical wavenumber γ−
m ni.e. the
acoustic part of the fluctuations (upstream waves are not expected in the outlet duct since stretching zones have been
used). However, the acoustic axial wavenumber γm n− varies
along the duct so that a range of acoustic wavenumbers is de-fined in pratice for each mode. Extracting precisely the acous-tic fluctuations using a classical Discrete Fourier Transform (DFT) is difficult without an exact knowledge of the acoustic axial wavenumber because the signal window will not be necessary a multiple of the acoustic axial wavelength. To overpass this limit, a Dynamic Mode Decomposition (DMD) [26], which does not require any prior knowledge of the sig-nal frequencies to capture them precisely, is used instead of the DFT. Still, filtering by accounting for what is strictly in the range of defined acoustic wavenumbers is too restrictive and several modes that are theoretically cut-on reach zero. This can be explained by the fact that this range of acoustic wavenumbers is valid only for flows that are purely axial and that are homogeneous in the radial and the azimuthal directions (assumptions in Rienstra’s theory). To mitigate these tight constraints linked to the hypothesis of the theory, a tolerance must be included. This choice is important and must be done based on a quantitative criterion. Both the the-oretical convective wavenumber (defined with the velocity integrated over the section) and the acoustic wavenumber are known. It is therefore easy to choose the tolerance so that there is no overlapping. In the results presented here, the axially-averaged convective wavenumber and acoustic wavenumber are computed for each mode. If a wavenumber found by the DMD is closer to the convective wavenumber than to the acoustic wavenumber, then it is removed from the mode evolution. The procedure is illustrated on one duct mode (m = 6, n = 0) in Figs. 12 and 13 which show the wavenumbers found by the DMD and the axial evolution of the mode respectively. The pressure is normalized by an ar-bitrary value and the axial wavenumber is normalized by the
convection wavenumber (kc = ω/U0with ω the pulsation
and U0the mean axial speed of the flow).
The hydrodynamic fluctuations (characterized by the nor-malized wavenumber near 1 or the fast axial variations) are of higher amplitude than the acoustic ones (characterized by
0 0.005 0.01 0.015 0.02 0.025 0.03 0.035 -1 -0.5 0 0.5 1 1.5 2
Normalized pressure amplitude
Normalized axial wavenumber
Figure 12.Axial wavenumbers of the pressure coefficient
associated with the mode (m = 6, n = 0) at the BPF:
initial signal, filtered signal
-0.06 -0.04 -0.02 0 0.02 0.04 0.06 xogv xstr xout
Normalized pressure fluctuations
Axial position
OGV
Figure 13.Axial evolution of the pressure coefficient
associated with the mode (m = 6, n = 0) at the BPF:
initial signal, filtered signal
the smaller wavenumbers or the low axial variations) in this case. These hydrodynamic fluctuations have been completely removed by the filtering. It is worth noting that the filtering has been applied only downstream of the struts to avoid hav-ing important geometry evolution and this is why the filtered signals are shorter than the initial ones. When accounting for all the modes found by the DMD for the reconstruction, it can be shown that the initial signal is correctly recovered. The filtered velocity can be obtained using the same pro-cedure but it can also be determined from the filtered pressure using the theoretical relationship
u−m n(x) =
λ−m n
ρ0a0
p−m n(x), (6)
where λ−m ndepends on the duct geometry and the mean flow.
Both methods give identical results even it is not shown here for the sake of brievety. The procedure is repeated for each mode and the total field is reconstructed. The acoustic power is finally evaluated before and after applying this procedure
and the results are given in Fig. 14.
xogv xstr xout
Acoustic power
Axial position
5 dB
OGV
Figure 14.Evolution of the acoustic power in the outlet
duct: without filtering, with filtering
The filtered power is almost constant in the outlet duct which gives confidence in the procedure (even if it is not a validation in itself). The total level is reduced by almost 30 dB when removing the hydrodynamic fluctuations and preliminary comparisons with semi-analytical results based on Rienstra’s model for slowly-varying duct already show good agreement [21].
3.3 Aft noise
After applying the filtering technique, the total noise in the outlet plane and the contribution of the different azimuthal modes are computed in a similar way as for the inlet noise. Results are given in Fig. 15, where the only cut-on Tyler & Sofrin mode (m = −18) has been highlighted.
-24 -18 -12 -6 0 6 12 18 24
Acoustic power
Azimuthal mode order
5 dB
Figure 15.Acoustic power carried by the azimuthal modes
and total acoustic power in the outlet plane: total
power, mode power, Tyler & Sofrin mode
power
The distribution is very different from the one in the inlet plane. The noise is no more carried by the modes close to the
Tonal Noise Prediction of a Modern Turbofan Engine with Large Upstream and Downstream Distortion — 8/9
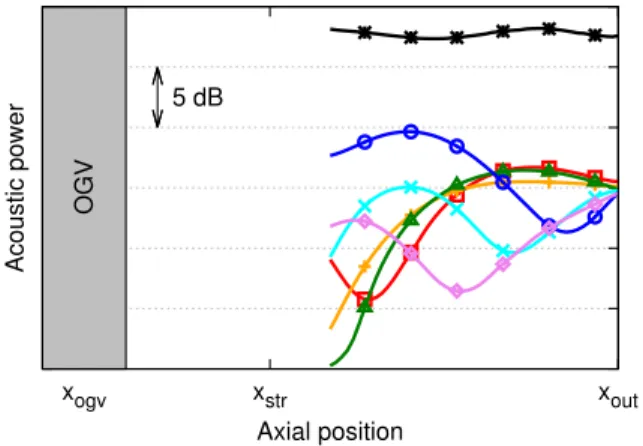
rotor-locked mode but is rather distributed over all cut-on modes (from m = −20 to m = 20). These modes are there-fore likely linked to wakes-OGVs interaction. This result, which differs from the inlet noise one, can be explained by the swirling flow in the interstage. Because of the swirl, the cut-on/cut-off transition is indeed shifted towards counter-rotating modes and the co-counter-rotating modes of high absolute orders (typically the ones caused by self-noise and distortion-fan interaction noise) are therefore cut-off. It is worth noting that in such heterogeneous configuration, the wakes-OGVs interaction is not carried by the Tyler & Sofrin mode only. The other modes show power levels similar or even higher than the one of the Tyler & Sofrin mode. If the OGV was homogeneous and the flow was free of distortion, only the highlighted mode (m = −18) would have emerged, but with a different level. The six most important modes m = 14, m = 16, m = −15, m = 11, m = −13 and m = 5 are further analyzed in Fig. 16 where their associated power is plotted along the outlet duct.
xogv xstr xout
Acoustic power
Axial position 5 dB
OGV
Figure 16.Evolution of the total power and the power
associated with the six most important modes in the outlet
duct: total power, m = 14, m = 16,
m = −15, m = 11, m = −13, m = 5
Important axial variations of the power carried by the different modes is observed for all modes (up to 17 dB for m = −15), even if the total power remains approximately constant. It indicates important modal scattering that can be caused by axial variations of the mean flow and duct radii [27], the presence of the pylon [28] or the distorted flow [29].
CONCLUSION
The prediction of the tonal noise of a complete fan module has been investigated in this paper. The model includes both a completely heterogeneous OGVs (with struts and pylon) and an asymmetric inlet duct which generates a level of distortion typical of the one expected in UHBR engines. Full-annulus URANS simulations have been performed at sideline oper-ating conditions and aerodynamic and acoustic results have been presented.
At transonic regime, the fan tonal noise is generally as-sumed to be dominated by the interaction of the fan-blades wakes with the OGVs and the fan-self noise (essentially the shocks). Both mechanisms are shown to be impacted by the distortion that comes from both the potential effect of the py-lon and the inlet asymmetry. Indeed, an important azimuthal inhomogeneity of the wakes was evidenced and makes the acoustic response of the stator completely heterogeneous. In addition, the shocks on the blades were shown to move along the chord and to change in amplitude during the rotation of the fan. The noise associated with each mechanism is therefore expected to be impacted.
In addition to these classically considered noise sources, new sources caused by the interaction of the fan with the dis-tortion were shown to contribute to the inlet noise. The latter results of the contribution of the self-noise (essentially caused by the shocks) that is described by the rotor-locked mode and the distortion-fan interaction noise that is described by the modes around the rotor-locked mode. The modal scattering of the rotor-locked mode into its neighbouring modes has also been evidenced in the inlet and can be seen as the effect of distortion on the shock propagation.
The aft noise has also been investigated after successfully applying a filtering procedure based on a modal decompo-sition. Despite the presence of distortion, this noise is still dominated by the interaction of the fan-blade wakes with the OGVs. This is essentially due to the swirling flow in the interstage which shifts the cut-on/cut-off transition towards counter-rotating modes. Because of the heterogeneity of the stator geometry and the wakes, this noise source is no more described by the classical Tyler & Sofrin’s modes but is rather distributed over all cut-on modes.
ACKNOWLEDGMENTS
The authors are thankful to Safran Aircraft Engines for hav-ing funded this study, to ONERA for licenshav-ing CERFACS to use the code elsA and to Marc Montagnac from CERFACS for his help in the preparation of the numerical simulations. This work was performed using HPC resources from GENCI - [CCRT/CINES/IDRIS] (Grant 2016-[x20162a6074]).
REFERENCES
[1] N. Peake and A.B. Parry. Modern Challenges Facing
Turbomachinery Aeroacoustics. Annual Review of Fluid Mechanics, 44(1):227–248, 2012.
[2] J. De Laborderie and S. Moreau. Prediction of tonal
ducted fan noise. Journal of Sound and Vibration,
372:105–132, 2016.
[3] E. Envia, A.G. Wilson, and D.L. Huff. Fan Noise: A
Chal-lenge to CAA. International Journal of Computational Fluid Dynamics, 18(6):471–480, 2004.
[4] A. Holewa, C. Weckm¨uller, and S. Gu´erin. Impact of By-pass Duct Bifurcations on Fan Noise. In 18th AIAA/CEAS Aeroacoustics Conference, 2012.
[5] V. Bonneau, C. Polacsek, R. Barrier, S. Lewy, J.-M. Roux,
and Y. Gervais. Tonal Noise Prediction of a Turbofan with Heterogeneous Stator and Bifurcations. AIAA Jour-nal, 53(11):3354–3369, 2015.
[6] M. Roger and P. Caule. Assessment of the effect of
stator inhomogeneity on rotor-stator tonal noise. In 15th International Symposium on Transport Phenomena and Dynamics of Rotating Machinery, 2014.
[7] J.M. Tyler and T.G. Sofrin. Axial flow compressor noise
studies. Society of Automotive Engineers Transactions, 70:309–332, 1962.
[8] T. Oishi, S. Kusuda, H. Kodama, M. Namba, and
J. Kazawa. Behaviors of Fan Tone Noise Under the Influ-ence of Circumferentially Non-Uniform Steady Pressure Perturbation. In 19th AIAA/CEAS Aeroacoustics Confer-ence, 2013.
[9] M. Sturm, M. Sanjos´e, S. Moreau, and T. Carolus.
Appli-cation of Analytical Noise Models Using Numerical and Experimental Fan Data. In 11th European Conference on Turbomachinery, Fluid Dynamics and Thermodynamics, 2015.
[10] F. Conte, M. Roger, S. Moreau, M. Sanjos´e, and P. Caule.
Modeling of Installation Effects on the Noise from. In 17th AIAA/CEAS Aeroacoustics Conference, 2011.
[11] J. Winkler, C.A. Reimann, R.A. Reba, and J. Gilson.
Tur-bofan Inlet Distortion Noise Prediction with a Hybrid CFD-CAA Approach. In 20th AIAA/CEAS Aeroacoustics Conference, 2014.
[12] M. Doherty and H. Namgoong. Impact of Turbofan
Intake Distortion on Fan Noise Propagation and Gen-eration. In 22nd AIAA/CEAS Aeroacoustics Conference, 2016.
[13] M. Sanjos´e, S. Moreau, M. Pestana, and M. Roger.
Ef-fect of weak Outlet-Guide-Vane heterogeneity on rotor-stator tonal noise. AIAA Journal, 2017.
[14] J. Winkler, C.A. Reimann, C.D. Gumke, A.A. Ali, and
R.A. Reba. Inlet and Aft Tonal Noise Predictions of a Full-Scale Turbofan Engine with Bifurcation and Inlet Distortion. In 23rd AIAA/CEAS Aeroacoustics Conference, 2017.
[15] M. Daroukh, S. Moreau, N. Gourdain, J.F. Boussuge, and
C. Sensiau. Effect of Distortion on Turbofan Tonal Noise at Cutback with Hybrid Methods. International Journal of Turbomachinery, Propulsion and Power, 2(3):16, 2017.
[16] M. Daroukh, N. Gourdain, S. Moreau, J.F. Boussuge, and
C. Sensiau. Impact of inlet distortion on fan tonal noise. In 12th European Conference on Turbomachinery Fluid dynamics & Thermodynamics, 2017.
[17] L. Cambier, S. Heib, and S. Plot. The Onera elsA CFD
soft-ware: input from research and feedback from industry. Mechanics & Industry, 14(3):159–174, 2013.
[18] D.C. Wilcox. Reassessment of the Scale-Determining
Equation for Advanced Turbulence Models. AIAA Jour-nal, 26(11):1299–1310, 1988.
[19] P.L. Roe. Approximate Riemann Solvers, Parameter
Vec-tors, and Difference Schemes. Journal of Computational Physics, 43:357–372, 1981.
[20] B. van Leer. Towards the ultimate conservative
dif-ference scheme V: a second order sequel to Godunov’ method. Journal of Computational Physics, 32:101–136, 1979.
[21] M. Daroukh. Effects of distortion on modern turbofan
tonal noise. PhD thesis, Institut National Polytechnique de Toulouse and Universit´e de Sherbrooke, 2017.
[22] Antares Development Team. Antares Documentation
Release 1.9.0, 2012–2017.
[23] R. H. Cantrell and R. W. Hart. Interaction between Sound
and Flow in Acoustic Cavities: Mass, Momentum, and Energy Considerations. The Journal of the Acoustical Society of America, 36(4):697–706, 1964.
[24] S. Lewy, C. Polacsek, and R. Barrier. Analytical and
nu-merical prediction of harmonic sound power in the inlet of aero-engines with emphasis on transonic rotation speeds. Journal of Sound and Vibration, 333:7165–7182, 2014.
[25] S.W. Rienstra and A. Hirschberg. An Introduction to
Acoustics. Technische Universiteit Eindhoven, 2016.
[26] P.J. Schmid. Dynamic mode decomposition of
numeri-cal and experimental data. Journal of Fluid Mechanics, 656(July 2010):5–28, 2010.
[27] A. F. Smith, N. C. Ovenden, and R. I. Bowles. Flow and
geometry induced scattering of high frequency acoustic duct modes. Wave Motion, 49(1):109–124, 2012.
[28] S. Redonnet and Y. Druon. Computational
Aeroacous-tics of Aft Fan Noises Characterizing a Realistic Coaxial Engine. AIAA Journal, 50(5):1029–1046, 2012.
[29] R.J. Astley, R. Sugimoto, G. Gabard, E. Norde, E.J. Grift,
and M. Bocquier. The Effect of Steady Flow
Distor-tion on Noise PropagaDistor-tion in Turbofan Intake. In
20th AIAA/CEAS Aeroacoustics Conference, number June, 2014.