HAL Id: hal-00079843
https://hal-insu.archives-ouvertes.fr/hal-00079843
Submitted on 13 Jun 2006HAL is a multi-disciplinary open access archive for the deposit and dissemination of sci-entific research documents, whether they are pub-lished or not. The documents may come from teaching and research institutions in France or abroad, or from public or private research centers.
L’archive ouverte pluridisciplinaire HAL, est destinée au dépôt et à la diffusion de documents scientifiques de niveau recherche, publiés ou non, émanant des établissements d’enseignement et de recherche français ou étrangers, des laboratoires publics ou privés.
A model of sulphur solubility for hydrous mafic melts:
application to the determination of magmatic fluid
compositions of Italian volcanoes
Bruno Scaillet, Michel Pichavant
To cite this version:
Bruno Scaillet, Michel Pichavant. A model of sulphur solubility for hydrous mafic melts: application to the determination of magmatic fluid compositions of Italian volcanoes. Annals of Geophysics, Istituto Nazionale di Geofisica e Vulcanologia (INGV), 2005, 48, pp.(4-5), 671-698. �hal-00079843�
A model of sulphur solubility for hydrous mafic
melts: application to the determination of
magmatic fluid compositions of Italian volcanoes
Bruno Scaillet and Michel Pichavant
ISTO-CNRS, UMR 6613, Orléans, France
Abstract
We present an empirical model of sulphur solubility that allows us to calculate f S2 if P,
T, fO2 and the melt composition, including H2O and S, are known. The model is
calibrated against three main experimental data bases consisting in both dry and hydrous silicate melts. Its prime goal is to calculate the f S2 of hydrous basalts that currently lack experimental constraints of their sulphur solubility behaviour. Application of the model to Stromboli, Vesuvius, Vulcano and Etna eruptive products shows that the primitive magmas found at these volcanoes record f S2 in the range 0.1-1 bar. In contrast, at all volcanoes the magmatic evolution is marked by dramatic variations in f S2 that spreads over up to 9 orders of magnitude. The f S2 can either increase during differentiation or decrease during decompression to shallow reservoirs, and seems to be related to closed versus open conduit conditions, respectively. The calculated f S2 shows that the Italian magmas are undersaturated in a FeS melt, except during closed conduit conditions, in which case differentiation may eventually reach conditions of sulphide melt saturation. The knowledge of f S2, fO2 and fH2O allows us to calculate the fluid phase composition coexisting with magmas at depth in the C-O-H-S system. Calculated fluids show a wide range in composition, with CO2 mole fractions of up to 0.97. Except at shallow levels, the fluid phase is generally dominated by CO2 and H2O species, the mole fractions of SO2 and H2S rarely exceeding 0.05 each. The comparison between calculated fluid compositions and volcanic gases shows that such an approach should provide constraints on both the depth and mode of degassing, as well as on the amount of free fluid in magma reservoirs. Under the assumption of a single step separation of the gas phase in a closed-system condition, the application to Stromboli and Etna suggests that the main reservoirs feeding the eruptions and persistent volcanic plumes at these volcanoes might contain as much as 5 wt% of a free fluid phase. Consideration of the magma budget needed to balance the amounts of volatiles emitted in the light of these results shows that the amount of nonerupted magma could be overestimated by as much as one order of magnitude.
Key words sulphur – hydrous basalts – volcanic
gas – Italy
1. Introduction
The determination of the composition of the fluids that coexist with magmas at depth requires 1) a good definition of the magma pre-eruptive conditions (P, T, fO2, fS2, fH2O) and 2) solubility models for the main volatile species. The combination of these two sets of information allows us to calculate the fluid composition through the consideration of
fluid-melt equilibria (e.g., Scaillet and Evans, 1999). For any volatile species dissolved in a silicate melt that is saturated in a fluid, equilibrium conditions demand that the fugacity
fi of species i in the melt equals its fugacity in the fluid. For water we have therefore
The relationships between fugacity (or activity) and concentration in silicate melts have been established mainly for H2O and CO2 for a wide range of melt compositions (e.g., Dixon et al., 1995; Papale, 1997; Zhang, 1999). Once the fugacity of a given volatile species has been determined, its partial pressure, Pi, can be determined via the simple eq. (1.2)
where γi is the fugacity coefficient of species I in the fluid. In the system C-O-H, the other main species to be considered is CO2, except if fO2 is significantly below FMQ, in which case reduced species such as H2, CO, and CH4 can be present as well (see Holloway, 1977). Therefore, considering that H2O and CO2 are the main volatile species in the fluid, we have the following equations :
Since the fluid can be treated as a binary H2OCO2 system, we have also the constraint,
Xi being the mole fraction of species i in the fluid
Recalling that Pi XiPfluid, eqs. (1.3) to (1.5) can be solved simultaneously to calculate both PH2O and PCO2 and thus Pfluid since by definition
What is calculated through this approach is thus the pressure at which the melt becomes saturated in a fluid phase and the composition of this fluid. This method offers thus the possibility to constrain both the minimum pressure of magma reservoir and the fluid composition that is likely to escape this reservoir during an eruptive process. Obviously those two information are of considerable interest for the assessment of volcanic hazards. This approach was first applied using modern solubility models for H2O and CO2 by Anderson et al. (1989) to the Bishop tuff eruption. Since then, several petrological studies have estimated the pressure depth at which magmas become
fluid-saturated, assuming that the fluid phase is a binary H2O-CO2 mixture (e.g., Roggensack et al., 1997). Most arc magmas are, however, notoriously rich in sulphur. Over the last 15 years, several melt inclusions studies have shown that the pre-eruptive melt sulphur content of arc basalts is equal to, or even higher than, the amount of dissolved CO2 (e.g., Roggensack et al., 1997; Marianelli et al., 1995, 1999). This shows that sulphur bearing volatile species must be incorporated into the above approach for a more complete description of fluid-melt equilibria. The nature and proportion of S-bearing species, mostly H2S and SO2, strongly depend on fO2, as for C-S-bearing species (see Holloway, 1977; Symonds et al., 1994). Unlike C-species, however, the redox range in which the H2S/SO2 ratio varies is exactly within the redox range recorded by most arc-magmas (i.e. NNO to NNO2). This fO2 sensitivity introduces an additional complication in the approach outlined above, since the role of fO2 on volatile speciation must be explicitly taken into account. The calculation of the pressure for fluid saturation of a magma saturated in a C-O-H-S fluid at an fO2 equal to or higher than NNO will require to solve the following equation :
if the contribution of CO, CH4, H2, S2, and O2 partial pressures are ignored, which is a valid approximation under the redox conditions considered here (fO2 NNO). The SO2 and H2S species abundances are controlled by the following equilibria:
which show that what is needed to calculate Sbearing species fugacities is fS2 or one over the three S-bearing species fugacities (assuming that both fO2 and fH2 are known, which are two quantities generally known or obtainable if the pre-eruptive conditions are determined in magmas). The preceding section shows that there is a need for a solubility model for S in silicate melts. Up to recently, there was only one such a model (Wallace and Carmichael, 1992) which was calibrated for dry basalts and fO2 below NNO, using mostly the experimental data of Haughton et al. (1974). Clemente et al. (2004) have developed both a thermodynamic and an empirical sulphur solubility model for hydrous rhyolitic compositions. In the intermediate composition range, that is between basalt and rhyolite, only a few studies have been carried out at one bar (e.g., Katsura and Nagashima, 1974) and even fewer at high pressure (Carroll and Rutherford, 1987; Luhr, 1990; Carroll and Webster, 1994). Of the work done at high pressure, only that of Luhr (1990) provides sulphur solubility data obtained under known fS2 estimated from either Fe-FeS equilibria or equilibrium assemblages involving anhydrite. Clearly, it is this mid-compositional range of hydrous mafic to intermediate magmas that still lacks experimental coverage, and this is unfortunate because most of arc magmas belong to this category. Moretti et al. (2003) devised a general solubility model that should be applicable to a wide range of silicate melt compositions, including those hydrous.
However, although based on a rigorous, as well as promising, thermodynamic description of melt-fluid equilibria, the current version of the model is quite complex to implement and is presently restricted to conditions of melt undersaturation with respect to a Fe-S-O sulphide melt. In the present paper, we follow a more pragmatical approach and derive an empirical solubility model by considering the existing experimental database on geologically relevant silicate liquids. We have deliberately ignored the wealth of data existing in the metallurgical literature, since 1) it is exclusively based on dry compositions, 2) it concerns silicate melt compositions far outside the compositional spectrum displayed by terrestrial magmas, and 3) it covers temperatures greater than those typical of Earth’s magmatism. Our first target is to build a model that allows us to compute the fS2 of basaltic to intermediate hydrous melts, using as input parameters P,
T, fO2 and melt composition. Although we believe that the model described below
retrieves the correct order of magnitude in terms of fS2, we envision it as an intermediate step that should help define future experimental strategies to obtain high pressure solubility data onto which more rigorous thermodynamic approaches, such as that of Moretti et al. (2003), will be calibrated. The second target of this report is the application of this model to Italian volcanoes for which there exists a combined data set of pre-eruption H2O, CO2 and S concentrations, in addition to other intensive parameters (T and fO2). We considered Stromboli, Vesuvius, Vulcano and Etna volcanoes, for which there are melt inclusion constraints on pre- to syn-eruptive volatile abundances. We calculated the equilibrium fluid composition corresponding to the depth at which the melt inclusion were saturated in fluid. The rationale here is clear : to constrain fluid compositions from depth to near surface conditions and compare it with the observed gas composition measured at the exit (see Scaillet and Pichavant, 2003). The combination of the two sets of data (calculation and observation) should allow a better use of volcanic gases as monitoring tools during on-going volcanic crisis.
2. An empirical model for hydrous basaltic melts
We attempted to devise a general empirical model in which the different effects of ƒO2, ƒS2 and T on the melt sulphur content, as well as the melt composition, are explicitly taken into account. Several equations were tested and the following was found to give satisfactory results
where S is the total sulphur concentration in ppm, P the pressure in bar, T the temperature in °C, NNO and FFS are the referenced fO2 and fS2 as explained below, Wi represents the weight % of oxide i, and a, b, c, d, e, f and gi are fitted parameters listed in table I. The summa tion is carried over all major oxides, including FeO, Fe2O3, OH- and H2O. The Fe2+ /Fe3+ ratios of experimental glasses were calculated using the empirical model of Kilinc et al. (1984), whereas the water contribution was split into hydroxyl and molecular water using the method of Zhang (1999). The third order polynomial function is necessary to reproduce the dissymmetrical inverted bell-shaped pattern (e.g., Katsura and Nagashima, 1974), while the crossed
fO2- fS2 term is needed to take into account the effect of varying fS2 on the relationship
between fO2 and S in melt (see Clemente et al. 2004). Using mole fractions instead of weight% oxides, or any other intensive parameters (i.e. fH2 in lieu of fO2), does not improve the quality of the fit. Similarly, to account for the compositional dependence various norm projections were tested including the CIPW norm, but none was found to decrease the residuals. As for fO2, which is referenced to the NNO solid buffer, we have referenced fS2 to the irontroilite solid buffer (Fe-FeS or FFS) such that
in which the f S2 of the Fe-FeS buffer is given by (Froese and Gunter, 1976)
We derived a set of fitted a ... gi parameters for eq. (2.1) by linear regression considering the data bases of Luhr (1990), O’Neill and Mavrogenes (2002), Katsura and Nagashima (1974) on rhyodacite melts, in addition to those of Clemente et al. (2004). As stated above, although the existing experimental database is considerably larger, we restricted the regression procedure to the above studies for the following reasons : first, all works were specifically aimed at exploring the behaviour of sulphur in geological melts and are thus of direct relevance to magmatic contexts; second, they were carried out within P-T- fO2- fS2- fH2O conditions that closely approach those under which natural magmas evolve; third, use of the complete database is not warranted since much of it concerns slags or synthetic silicate melts of metallurgical, rather than geological, interest. Because our model is empirical, including this database will have the undesirable but unavoidable consequence that one atmosphere data overwhelmingly dominate over those obtained at high pressure and thus that the fitted parameters be biased toward anhydrous compositions. Preliminary fitting procedures used the database of Haughton et al. (1974). However, the extensive work of O’Neill and Mavrogenes (2002) on dry mafic melts at one bar has shown that a substantial part of the experimental database gathered by Haughton et al. (1974) does not obey expected thermodynamic relationships, and for this reason we have not included this work in our database. The selected database consists therefore of 64 hydrous rhyolitic compositions (Clemente et al. (2004) plus three charges of Scaillet et al. (1998) for which fS2 has been measured using the same technique than in Clemente et al. (2004)), 72 hydrous rhyolite-andesite compositions (Luhr, 1990), 333 dry mafic to ultramafic compositions (O’Neill and Mavrogenes, 2002), and 5 dry rhyodacite compositions of Katsura and Nagashima (1974). There is therefore a 30/70 repartition between hydrous and dry compositions. The experiments of Luhr (1990) and Clemente et al. (2004) are the only ones in which both fO2 and fS2 are known for hydrous compositions, and cover an fO2 range between NNO−1 up to NNO3, a total pressure of 100-400 MPa, a temperature 800-1000°C, for melt water contents up to 8 wt%, the melt compositions spanning a SiO2 range of 57-80 wt% on an anhydrous basis. The experiments of Katsura and Nagashima (1974) were included in the regression in an effort to constrain the sulphur solubility in silicic compositions under dry, i.e. low pressure, conditions. The database of O’Neill and Mavrogenes was chosen among others (e.g., Buchanan and Nolan, 1979; apart from that of Haughton et al., 1974, for the reason given above) because of its systematic variation of melt composition at constant fO2 and fS2, which allows a better evaluation of the compositional dependence of sulphur solubility (i.e. the gi terms in eq. (2.1)). The fitted parameters are listed in table I.
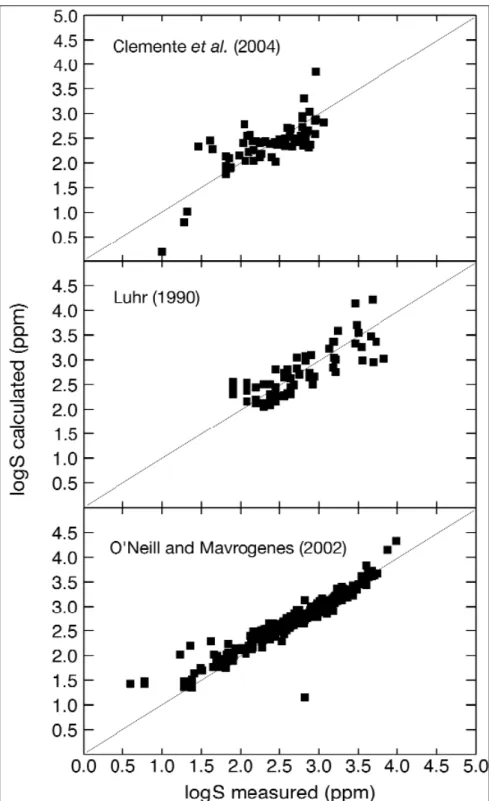
Fig. 1a-c. Comparison between measured and calculated melt sulphur concentrations
for the three main experimental data sub set used to calibrate the empirical model (eq. (2.1), see text). a) rhyolitic compositions (Clemente et al., 2004; Scaillet et al., 1998; Katsura and Nagashima, 1978); b) intermediate compositions (Lurh, 1990); c) basaltic composition (O’Neill and Mavrogenes, 2002).
Figure 1a-c shows that the model reproduces observed sulphur concentrations of the whole data set over more than 3 orders of magnitude (10-11900 ppm), with no apparent systematic divergence from the 1/1 correlation line within any of the three main data subsets, except in the low concentration range. Considering that the database covers a wide compositional range (SiO2 ranging from 35 to 80 wt%), as well as widely differing
P-T-fluid fugacities conditions, the agreement between observed and calculated sulphur
concentrations is considered satisfactory. In terms of fS2, the model reproduces measured fS2 within an average of 0.65 log unit, over more than 15 log units when normalised to the FFS solid buffer. Inspection of fig. 1a-c shows nevertheless that hydrous melts are not as well reproduced by the model, which is a reflection of the difficulty in accurately controlling fS2 in high pressure experiments, since there is no buffering technique which allows to measure fS2 with a precision similar to that of fO2 or
fH2. Given that there exist solubility models for rhyolite compositions (Clemente et al.,
2003) and for dry mafic melts (e.g., Wallace and Carmichael, 1992; O’Neill and Mavrogenes, 2002), this empirical model is intended primarily to be used for melt compositions currently lacking experimental constraints, that is, hydrous mafic melts. Equation (2.1) is merely a convenient mathematical way to describe the interdependence between the various parameters that control the sulphur solubility in silicate melts. As such the fitted parameters have clearly no thermodynamical meaning. Yet, it is useful to consider at this stage the individual effect of some of the parameters on the calculated fS2 (or sulphur solubility) to appreciate their relative importance on sulphur behaviour in hydrous magmas. All parameters with a positive value increase the sulphur solubility, when everything else is kept constant. For instance at constant fO2,
fS2, P and melt composition, a temperature increase produces an increase in melt
sulphur content. The same is true for P which suggests that, in hydrous systems, an increase in pressure increases the sulphur solubility, a trend opposite to that found for dry mafic melts saturated in an immiscible sulphide liquid (see Mavrogenes and O’Neill, 1999). Of the melt components, only SiO2, Al2O3 and K2O have negative signs. Although this is as expected for SiO2 and Al2O3 because both components increase the degree of melt polymerisation, and thus they decrease its capacity to exchange sulphur ions with free oxygens, the negative sign found for K2O is more surprising since this element is often positively correlated with melt sulphur content (see Métrich and Clocchiatti, 1996). Whether this effect is real or is merely a reflection of a compositional bias in the database cannot be solved in the present study. The large value found for Fe2O3 may indicate preferential association of oxidized sulfur groups with Fe3+ melt components but we stress that in the database, oxidized melts are mostly intermediate to silicic compositions with a low bulk FeO and thus a relatively low Fe2O3 content. Experiments performed on iron-rich basalts have been mostly performed at low fO2, and the behaviour of sulphur in dry oxidized basalt still demands experimental investigations. A last aspect of interest concerns the role of water. Both molecular H2O and hydroxyl group have strong positive values which suggests that addition of water to a silicate melt held at constant P-T- fO2- fS2 conditions significantly increases its melt sulphur content. We note, however, that because high pressure experiments are also those that are hydrous in the database, correctly discriminating the effects of pressure and water content on sulphur solubility is not yet possible. Overall the empirical model can be considered as calibrated in the pressure range 1-4000 bar, temperature range
800-1400°C, melt water content range 0-10 wt%, fO2 range NNO−2 to NNO3, and melt sulphur contents 50-10000 ppm. Melt compositions not yet considered and to which the model should be applied with caution are evolved alkali-rich magmas, such as phonolites and peralkaline rhyolites.
3. Calculation of fluid phase composition
To calculate the fluid phase composition we follow the same approach as Scaillet and Pichavant (2003) who determined the fluid compositions of a number of intermediate to silicic arc magmas. They also attempted to constrain the fluid phase of some hydrous arc basalts, using a simplified version of the Wallace and Carmichael (1992) model. The calculations were performed considering that the fluid composition can be described in the C-O-H-S system. We thus ignore the contribution of halogens, in particular F and Cl, although we recognise that those species may play an important role in the evolution of magmatic fluids (see Carroll and Webster, 1994), especially in alkali-rich magmas (e.g., Métrich, 1990; Webster and De Vivo, 2002). The species considered are H2O, H2, CO2, CO, CH4, H2S, SO2, S2 and O2. To calculate the fluid compositions we use as input parameters, fO2, fS2 and fH2O. The thermodynamic model of water solubility for basalt of Dixon et al. (1995) is used to calculate fH2O from the measured melt H2O content. The fO2 is constrained from petrological studies (i.e., spinel-olivinemelt equilibria; Ballhaus et al., 1991) or sulphur speciation (e.g., Métrich and Clocchiatti, 1996). The fS2 is calculated from eq. (2.1). At any fixed P and T, fixing fO2, fS2 and fH2O allows us to calculate the fugacities of all remaining species. For pressures below 5 kbar, we use the Modified Redlich Kwong equation of state (see Holloway, 1977; Flowers, 1979) with mixing rules as given by Ferry and Baumgartner (1987). At higher pressure, we use the corresponding state equation of Shi and Saxena (1992) and Saxena and Fei (1987) to calculate the fugacities of pure species. The fugacities of the species in the fluid mixture were derived using the Lewis and Randall rule: the fugacity coefficient of species i in the mixture equals that of pure species i at the same P and T. Because the fluid pressure is unknown, the calculation must be done iteratively. The following procedure was adopted. We first fix P, T, and calculate the corresponding fH2O and fS2 from melt inclusion data. This results in a fCO2 which is used to calculate the equilibrium CO2 content of the melt, using the solubility model of Dixon et al. (1995). This CO2 content is then compared to that measured in the melt inclusion and if the difference between observed and calculated values exceeds 10 ppm, the calculation is performed again at a different pressure until the test is fullfilled. Because P variations affect both fS2 and
fH2O for a given set of TfO2- melt composition values, tests are also performed on the
difference between observed and calculated values in melt S and H2O contents. The pressures of fluid saturation listed below reproduce observed H2O, CO2 and S melt contents to ±0.01 wt%, 10 ppm, 1 ppm, respectively. For alkali-rich basalts, we corrected for the alkali effect using the following method which is based on the approach of Dixon (1997) to evaluate the increase in CO2 solubility resulting from an increase in melt alkalinity. For a given calculated fCO2, we first determine the melt CO2 content using the solubility model of Dixon et al. (1995) which is calibrated on MORB composition. This amount of CO2 is then adjusted using the following empirical fit:
where CO2-MORB is the CO2 content of a MORB melt at P and T (in ppm) calculated using the model of Dixon et al. (1995), and Π is a compositional parameter devised by Dixon (1997) to evaluate the effect of metal cations on CO2 solubility, and is equal to
where the Si, Al … are cationic fractions, and Fe2+ is computed from total iron expressed as FeOtot (only Fe2+ in Dixon, 1997). Equation (3.1) was derived by linear regression of solubility data (see Holloway and Blank, 1994; Dixon, 1997) obtained at 1 kbar and 1200°C on MORB tholeiite, Kilauea tholeiite, basanite and leucitite melts which encompass a Π range of 0.47 (MORB) to 2.35 (leucitite). Equation (3.1) back calculates experimental solubility data with an average standard deviation of 80 ppm at 1 kbar. Inspection of experimental data shows that in fact the CO2 solubility of mafic melts is constant within analytical uncertainties for Π in the range 0.47-0.79, so that we have applied eq. (3.1) only to melt compositions having a Π value higher than 0.8. Although the correction factor is likely to vary with pressure and temperature, we have applied eq. (3.1) at all P and T since there are not enough data to properly evaluate this effect over a large range of P-T conditions. We note, in addition, that the compositions used to derive eq. (3.1) are significantly less alkali-rich than some of the basalts erupted at Italian volcanoes: in particular, the tephrites of Vesuvius have K2O contents almost twice higher than that of the most alkali-rich composition used to derive eq. (3.1). The strong correlation observed in experimental mafic melts between K2O and CO2 content (fig. 2) suggests that K2O may have a decisive role on CO2 solubility in mafic melts perhaps far outweighing that of other metal cations. Simple extrapolation of the trend shown on fig. 2 would imply that CO2 solubility in a tephrite with 5 wt% K2O at 1 kb and 1200°C could be nearly ten times that of MORB or 3000-4000 ppm, while application of the method of Dixon (1997) with Π = 1 predicts a much smaller increase in CO2 solubility (from ca. 500 ppm for a MORB to 724 ppm for a tephrite). In support of this enhanced CO2 solubility are the phase equilibria of Trigila and De Benedetti (1993), which have shown that addition of CO2 to dry tephrite at 2 kbar depresses the liquidus temperatures of pyroxene, leucite and plagioclase by 50-75°C with estimated CO2 concentrations in melt in excess of 1 wt% (see also Freda et al.,1997, for similar findings on phonotephritic magmas of the Alban Hills). A freezing point depression effect in a
given silicate-CO2 system implies a significant solubility of CO2 in the melt. Although such a potassium effect on CO2 solubility cannot be rigorously modeled at present, the above observations suggest that the pressures of fluid saturation calculated here could be largely overestimated for mafic melt compositions that contain significantly more K2O than the rock melts so far investigated in experimental studies on CO2 solubility. In summary we believe that mafic melts moderately enriched in K2O relative to MORB can have their CO2 solubility, and thus their pressure of fluid saturation, correctly estimated (to within 0.5 kbar) by the method explained above. This is the case for most of the mafic magmas erupted at Etna, Stromboli and Vulcano. In contrast, there exists the possibility that the pressures of fluid saturation calculated in this work for K2O-rich mafic magmas such as Vesuvius tephrites, are largely overestimated, perhaps by as much as several kilobars. This indicates that there is an urgent need of experimental constraints on CO2 solubility in alkali-rich basalts.
Fig. 2. Correlation between dissolved CO2 and the K2O content of experimental basaltic
melts used to determine the solubility of CO2 at 1000 bar and 1200°C. See Dixon (1997) for the source of data. Vesuvius tephrites, between 4 and 5 wt% K2O, could have CO2 solubilities close, or in excess, to 4000 ppm, or nearly 10 times more than MOR basalts (ca. 500 ppm under these conditions).
4. Source of data
In this section we briefly review the present status of knowledge on pre-eruptive H2O-CO2-S melt concentrations as well as of P-T-fO2 of the different volcanoes considered. We are primarily interested in works where those three volatiles have been determined (e.g., Marianelli et al., 1999; Métrich et al., 2001). However, we also considered melt inclusion data sets lacking CO2 determination but for which both H2O and S are known (e.g., Marianelli et al., 1995; Métrich et al., 1993; Cioni et al., 1995).
Although the lack of CO2 constraints prevents the calculation of the pressure of fluid saturation and fluid composition, H2O and S abundances can still be used to infer fS2, provided there are T- fO2 constraints. In such a case, the pressure for calculation in eq. (2.1) is that corresponding to the H2O solubility. While this pressure is clearly a minimum, in terms of fS2 calculation the error introduced by this uncertainty is minor, compared to that due to fO2: a pressure increase of 4 kbar decreases the calculated log
fS2 by 0.5 log unit. In the following, we focus primarily on mafic primitive melts, since it is
the injection of mafic fresh magmas that is more likely to re-awaken or trigger a new explosive event, as illustrated by the April 5th, 2003 event at Stromboli.
4.1. Stromboli
We restricted our calculations to melt inclusions analysed by Métrich et al. (2001), who studied the products of paroxysmic eruptions such as that of the August 23, 1998 explosion, during which crystal-rich scoria and highly vesicular yellow pumices were erupted. The first type of rock is interpreted to represent quenched fragments of a crystal-rich degassed magma that was resident in a very shallow magma chamber. This reservoir was intercepted by a rising batch of crystal-poor and volatilerich magma, now represented by the yellow pumice. Melt inclusion constraints on volatile abundances were obtained on both type of magmas, giving pressure for fluid saturation up to 4kbar for the volatile-rich yellow pumice (Métrich et al., 2001; Bertagnini et al., 2003). Temperature constraints come from melt inclusion homogeneisation during heating stage experiments which indicate that the yellow pumice was at 1125-1140°C, whereas the crystal-rich scoria was at a slightly lower temperatures of 1100-1125°C. The pre-eruptive temperature for the yellow pumice has been confirmed by recent phase equilibrium work (Di Carlo et al., 2004). Here we use temperatures of 1140 and 1100°C for the pumice and scoria rocks, respectively. The redox state of Stromboli magmas was inferred through the determination of sulphur speciation (Métrich and Clocchiatti, 1996; Métrich et al., 2002) which yields an average fO2 of NNO+0.95. For the calculation of fluid phase corresponding to the scoria or degassed magmas, we assumed that the pre-eruptive melt contained 40-50 ppm CO2, since this species could not be detected by FTIR in scoria melt inclusions.
4.2. Vesuvius
For Vesuvius there is a large body of data on melt inclusion chemistry (e.g., Vagelli et
al., 1992, 1993; Cioni et al., 1995, 1998; Marianelli et al., 1995, 1999; Belkin et al., 1998;
Lima et al., 1999; Signorelli and Capaccioni, 1999; Signorelli et al., 1999; Cioni, 2000; Raia et al., 2000; Webster et al., 2001), but for Stromboli only recently has the CO2 in melt inclusions been determined using micro beam techniques (Marianelli et al., 1999; Signorelli et al., 1999; Cioni, 2000). We did not consider works done on felsic phonolites, however, since eq. (2.1) is not yet calibrated for these compositions. To minimise errors arising from differences in sulphur and water determinations between different research groups, we used only the data sets of Cioni et al. (1995), and Marianelli et al. (1995, 1999) in which at least both S and H2O were determined using the same instrument and analytical procedure. Most of the analysed inclusions correspond to primitive melts for which heating stages experiments give homogenisation temperatures of ca. 1100-1150°C (e.g., Cioni et al., 1995; Marianelli et al., 1995). For melt inclusions lacking such information, temperatures were determined using the CaO in melt geothermometer of
Cioni et al. (1998). The redox state is known indirectly from sulphur speciation determination either on bulk rocks, lava or pumices (Marini et al., 1998), or in melt inclusions (Métrich et al., 2002), both yielding an fO2 of ca. NNO+1.2.
4.3. Vulcano
Melt inclusions of Vulcano magmas have been analysed by Clocchiatti et al. (1994a,b) and Gioncada et al. (1998). The latter work showed that the CO2 content of primitive melt inclusions is below the FTIR detection limit, which yields a maximum CO2 content of about 50 ppm. The storage conditions of the reservoir that fed the 1888-1890 eruption, during which rhyolite to trachytic magmas were ejected, were inferred by Clocchiatti et al. (1994a) to be: a pressure depth of 80 MPa, melt water contents in the range 1-1.5 wt%, and temperatures between 1000-1100°C. This shallow reservoir is inferred to be connected to a deeper one where intermediate and mafic magmas reside. These are assumed to be equivalent to primitive melt inclusions in La Sommata basalts, whose homogeneisation temperature is 1180±20°C (Gioncada et al., 1998). The depth of the felsic upper reservoir provides an upper bound for the mafic part, which is estimated to lie at 70-110 MPa (Gioncada et al., 1998). Measured melt water contents of the least differentiated magmas (La Sommata melt inclusions) are in the range 2.1-3.8 wt%, that is they are higher than their potential felsic derivatives (Clocchiatti et al., 1994a; Gioncada et al., 1998), suggesting an open system behaviour with respect to volatiles (Clocchiatti et al., 1994b). A similar observation can be made for sulphur which reaches maximum values of 2872 ppm in the most mafic melts analysed (Clocchiatti et
al., 1994b). The redox state of mafic magmas has been inferred from sulphur speciation
to be at NNO + 0.72 (Métrich and Clocchiatti, 1996; Métrich et al., 2002). To calculate the fluid phase compositions we used the melt inclusions analyses reported by Clocchiatti et al. (1994a) assuming that they all contained ca. 40-50 ppm dissolved CO2. Thus, the calculated fluid compositions correspond to the maximum CO2 content that can be expected at Vulcano given the available melt inclusion constraints. In addition, we calculated the fS2 corresponding to melt inclusions of Clocchiatti et al. (1994b), by assuming that mafic melts have a pre-eruptive water content of 1 wt%, whereas that of more felsic compositions (shoshonite to latite-rhyolites) has been set at 1 wt%.
4.4. Etna
Unlike the three previous volcanoes, there are currently no published combined sets of pre-eruptive H2O-CO2-S contents of Etnean mafic melts. Existing melt inclusion studies have analysed either S and Cl (e.g., Clocchiatti and Métrich, 1984), H2O and S (Métrich
et al., 1993), CO2 (Métrich and Mosbah, 1988), or S and Cl (Kamenetsky and
Clocchiatti, 1996) but none has determined the concentration of those volatiles collectively in single melt inclusions. A literature survey shows that only the alkali basalt erupted in 1892 (Mt. Maletto), which is among the most primitive basalts yet erupted on Etna (Armienti et al., 1988), has had its preeruptive volatile content determined in full, albeit not necessarily on the same melt inclusions (Métrich and Mosbah, 1988 for CO2; and Métrich et al., 1993, for H2O and S). There are thus surprisingly very few constraints on the volatile concentrations that could be used to determine fluid saturation pressures of Etnaean magmas, either past or present. Therefore, we adopted a different strategy relative to the three other volcanoes. We performed thermodynamic calculations at various pressures, assuming that a fluid phase is present, using available
H2O and S melt concentrations coupled to petrological T and fO2 constraints. The pressure range over which calculations were performed is derived from geophysical and petrological constraints, as summarised in the next sections. The melt water contents of alkali basalts of Etna have been determined to be in the range 1-2.3 wt% (Trigila et al., 1990; Métrich et al., 1993), the higher value being regarded as the pristine pre-eruptive melt water content, based on phase equilibrium constraints (Métrich and Rutherford, 1998). Geochemical modelling has shown that these alkali basalts can be derived by 12-13 wt% of olivine fractionation from a picritic basalt (Armienti et al., 1988), which therefore suggests that the water content of primary magmas at Etna is close to 0.8-2 wt%, assuming closed system fractionation. As stated above, only melt inclusions of the 1892 eruption have had their CO2 content determined, with an average value of 588 ppm (Métrich and Mosbah, 1988). This value is considered as a minimum because of the occurrence of carbonate crystals in the quenched melt inclusions (Métrich and Mosbah, 1988). Additional evidence for magmatic CO2 comes from its occurrence in the volcanic plume or in diffuse soil emanations (e.g., Allard et al., 1991; Bruno et al., 2001), and from the study of fluid inclusions associated to melt inclusions in lava phenocrysts or ultramafic nodules (Clocchiatti and Métrich, 1984; Sobolev et al., 1991; Frezzotti et al., 1991; Clocchiatti et al., 1992). Such fluid inclusions generally belong either to a low (H2O-CO2 or CO2) or a high (CO2) density population. The high density inclusions yield maximum entrapment pressures of 6-7 kbar of a nearly pure CO2 fluid (Clocchiatti et al., 1992), whereas the low one yields pressures in the range 1-3 kbar (Clocchiatti and Métrich, 1984; Sobolev et al., 1991; Frezzotti et al., 1991). These observations suggest that any fluid phase coexisting with magma at depth must be CO2-rich. For sulphur there is a considerable amount of analytical data (e.g., Métrich and Clocchiatti, 1989; Métrich et al., 1993), the highest concentration recorded in melt inclusions being 3800 ppm (as quoted in Clocchiatti et al., 1992), though most have sulphur contents in the range 2500-3500 ppm (Clocchiatti and Métrich, 1984; Métrich and Clocchiatti, 1989, 1996). Generally the sulphur-rich melt inclusions are enclosed in the most magnesian olivines and they do not coexist with immiscible sulphide liquids (Métrich and Clocchiatti, 1989), while sulphur-poor inclusions hosted by Fe-rich olivine are occasionally saturated in a Cu-rich sulphide melt (Métrich and Clocchiatti, 1989). Petrological, geochemical, and geophysical evidence (e.g., Armienti et al., 1988; Bonaccorso, 1996, 2001; Tanguy
et al., 1997; Murru et al., 1999) all points to the probable existence of a large deep
reservoir beneath the volcano at a pressure depth range of 7-10 kbar, in which most of the primitive Etnaean magmas stagnate and fractionate to hawaiites (or trachybasalts). Such hawaiites constitute the bulk of the magmas outpoured over the last 300000 years. Similarly, geophysical, geodetic, geochemical, melt/fluid inclusions, and phase equilibrium constraints, suggest that there are at least two additional shallow reservoirs feeding historical as well as on-going eruptions that lie at a pressure depth of about 1 and 3-4 kbar (e.g., Sobolev et al., 1991; Bonnacorso, 1996; Métrich and Rutherford, 1998; Murru et al., 1999; Caracausi et al., 2003). Temperatures of magma extrusion for the recent period have been estimated from a variety of approaches including direct measurement of lava flow (Tanguy et al., 1997), melt inclusion homogeneisation (e.g., Sobolev et al., 1991; Clocchiatti et al., 1992) and thermodynamical and phase equilibrium constraints (Trigila et al., 1990; Métrich and Rutherford, 1998) and all fall within a T range of 1070-1100°C. Temperatures of primitive alkali magmas stored at 7-10 kbar are estimated to be around 1200°C (Kamenetsky and Clocchiatti, 1996).
Redox conditions of Etnean basalts have been determined either through spinel-olivineorthopyroxene equilibria (e.g., Kamenetsky and Clocchiatti, 1996) or via the determination of sulphur speciation in glass inclusions (Métrich and Clocchiatti, 1996). The latter approach gives an fO2 corresponding to NNO+0.35. The fO2 retrieved from spinel bearing assemblages in primitive melt inclusions from Mt. Maletto alkali basalt encompasses a range NNO up to NNO1, but we note that the fO2 calculated for another similar alkali basalt (Mt. Spagnolo) falls between NNO+1 to NNO+2, suggesting possibly more oxidizing conditions than those adopted here. Sato and Moore (1973) made intrinsic fO2 (and f S2) measurements in gas streams from two hornito vents during the 1970 eruption and they found an fO2 of NNO−0.45, which Gerlach (1980) showed to be compatible with the restored gas compositions measured by Huntingdon (1973) during the same event. In summary, because of the lack of confident pre-eruptive CO2 determinations, thermodynamic calculations of fluid composition coexisting with Etnaean mafic magmas were performed in the pressure range 400-10000 bar, in keeping with the petrological and geophysical constraints summarised above. Temperatures were either 1150°C (1 wt% H2O) or 1130°C (2.23 wt% H2O), based on melt inclusion heating stage experiments (Métrich and Clocchiatti, 1996). We considered melts water contents of 1 and 2.23 wt% (Métrich et al., 1993) and melt sulphur contents of 1000-3400 ppm, with melt compositions as reported by Métrich et al. (1993). We explored fO2 conditions from NNO−0.45 to NNO+0.35, to ascertain the effect of fO2 on both fS2 and fluid composition.
5. Trends in fS2 and sulphide saturation
In all subsequent diagrams we use the ratio CaO/Al2O3 as a differentiation index to illustrate variations in fS2. The sulphide saturation is computed from the following equilibrium:
using thermodynamic data for liquid FeO and FeS as given in O’Neill and Mavrogenes (2002). For all melt compositions we assume that 90% of iron is FeO, and we use an activity coefficient for FeO of 1.4 (O’Neill and Mavrogenes, 2002). Given the relatively high redox state of the magmas, there may be less Fe2+ than the assumed value and thus the activity of FeS calculated (aFeS) here should be considered as maximum values. The calculated aFeS corresponds to pure FeS, however. Saturation in a sulphide liquid could arise if other components are present in solution, such as Cu or Ni. 5.1. Stromboli
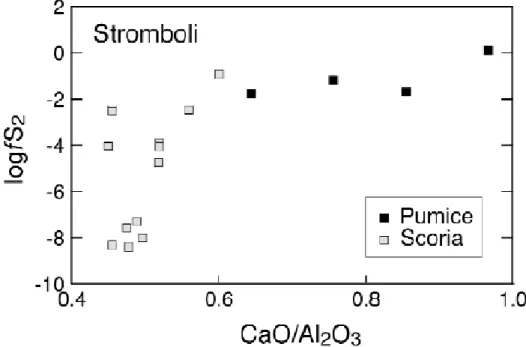
In fig. 3, two trends in fS2 can be distinguished; MI of pumices define a flat trend with
fS2 values in the range 0.01 to 1 bar, the most primitive melt having the highest fS2. The
pumice trend joins that defined by the scoria MI, which is much more steep and spreads over nine orders of magnitude fS2 at a nearly constant CaO/Al2O3 ratio. This spread in
inclusions, since melt compositions in scoria, including water content, varies little (Métrich et al., 2001). The huge spread records the progressive degassing in sulphur of the magma that is stored in the shallow reservoir. The very steep slope indicates that degassing operates with little chemical modification of the environment. Inclusions in the scoria displaying the highest fS2 may represent remnants of deep magma batches that intrude the upper reservoir or record incipient degassing of the deep magma batches during uprise. Melt inclusions in pumices were trapped at depths exceeding 3 kbar (see below). The fS2 variations in this deeper reservoir appear to be much more restricted. The slight decrease observed corresponds to either selective loss of sulphur or, and more probably, to an increase in melt water content during fractionation, since water decrease fS2 at a given melt sulphur content (see eq. (2.1)). The calculated aFeS ranges from 0.1 down to 0.0001 (fig.4), suggesting that mafic melts at Stromboli are far from reaching sulphide saturation. Removal of sulphur via sulphide disposal during fractionation is therefore probably not an efficient process at Stromboli.
Fig. 3. Evolution of fS2 with CaO/Al2O3 ratio of Stromboli magmas. Because of massive
clinopyroxene crystallisation in those magmas, fractionation is marked by a continuous decrease in the CaO/Al2O3 ratio. The fS2 is calculated from melt inclusion data (Métrich
et al., 2001) and eq. (2.1) (see text). Pumice corresponds to magma emitted during
paroxysmal events whereas scoria represents magmas erupted during Strombolian type eruptions.
Fig. 4. Calculated activities of liquid FeS plotted versus the CaO/Al2O3 ratio for the four
volcanoes considered (see text for explanations). Note that almost all magmas are below saturation conditions with an immiscible sulphide liquid.
5.2. Vesuvius
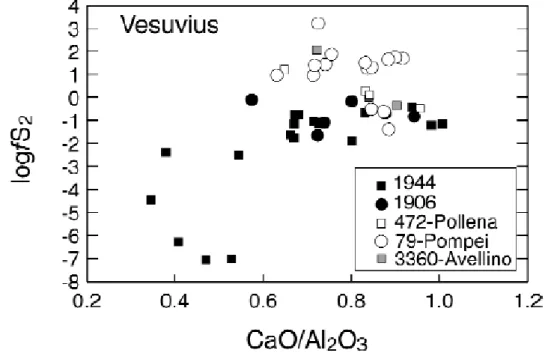
The data on Vesuvius are shown in fig. 5, being distinguished by the year of eruption. Two main trends emerge. The first corresponds to the 1906-1944 eruptions, whereas the second corresponds to the Pollena-Pompei-Avellino events. The 1906-1944 trend is somewhat analogous to the Stromboli in that less differentiated MI have higher and broadly constant fS2 which, below a CaO/Al2O3 ratio of 0.7, sharply decrease down to a logfS2 of –7. In contrast, MI analysed in Pollena-Pompei-Avellino define a broad trend of increasing fS2 as fractionation proceeds, although for the Pompei MI a significant scatter is apparent, reaching values of fS2 in excess of 100 bar. It is interesting to note that the first trend corresponds to events which characterise open conduit conditions, with semi- persistent Strombolian activity, as opposed to the other events which typify the establishment of a closed system following obstruction of the conduit during a long repose time preceding Plinian to sub-Plinian eruptions (e.g., Civetta et al., 1991; Civetta and Santacroce, 1992; Cioni et al., 1998). On this basis, the trend of decreasing fS2 can be interpreted as reflecting continuous loss of sulphur (and other volatiles) during magma uprise and emission to the surface (open conduit), in a way similar to that seen at Stromboli, whereas that of increasing fS2 reflects a closed system in which sulphur has perhaps a dominant incompatible behaviour (its concentrations in the melt and fluid increase). As for Stromboli, all but one calculated aFeS are significantly below unity (fig.
4) which again suggests that conditions for sulphide saturation are not reached in Vesuvius magmas, although they tend to approach it under closed conduit conditions. This may be one reason for the observed increase in fS2 during differentiation.
Fig. 5. Evolution of fS2 with CaO/Al2O3 ratio of Vesuvius magmas. The fS2 is
calculated from melt inclusion data (Cioni et al., 1995; Marianelli et al., 1995, 1999) and eq. (2.1) (see text). Different symbols correspond to the main eruptive events. The Pollena, Pompei and Avellino eruptions correspond to closed conduit conditions, while the 1944 and 1906 events are characteristic of open conduit conditions.
5.3. Vulcano
The Vulcano data define two distinct groups (fig. 6); one corresponding to the most mafic MI (basaltic compositions) which cluster at fS2 around 0.1 bar, and the second that corresponds to more evolved MI (shoshonitic to rhyolite compositions) that span values of fS2 between several bars down to 10−8 bar, defining a trend negatively correlated with the CaO/Al2O3 ratio (that is fS2 increases with differentiation). This second trend is similar to that observed for the Pollena-Pompei-Avellino magmas discussed above. However, there is a significant gap between mafic and felsic magmas and it is unclear from the data whether this gap is real or if the fS2 of the two groups overlap at a CaO/Al2O3 ratio of around 1. If this were true, then mafic melts must evolve towards lower fS2 during fractionation. This hypothetical decrease could represent decompression of volatile-rich magmas during open conduit conditions, such as at Stromboli. Thereafter, once the partially degassed mafic batches have been emplaced at shallow level they further fractionate under closed system conditions during which fS2 increases. Alternatively, the two groups may represent different levels of magma fractionation, one deep (both high and constant CaO/Al2O3 ratio and fS2) and one
shallow (increasing fS2 with fractionation). The aFeS calculated are in general much lower than unity (aFeS 0.01), but they do increase with fractionation such that the most felsic magmas may approach FeS saturation (fig. 4).
Fig. 6. Evolution of fS2 with CaO/Al2O3 ratio of Vulcano magmas. The fS2 is calculated
from melt inclusion data (Clocchiatti et al., 1994a,b; Gioncada et al., 1998) and eq. (2.1) (see text). Note that the most primitive melts (high CaO/Al2O3 ratio) cluster at around
fS2 of 0.1 bar, whereas the rest of melts defines a negative trend of increasing fS2 with
Fig. 7. Evolution of fS2 with CaO/Al2O3 ratio of Etna magmas. The fS2 is calculated
from melt inclusion data (Métrich et al., 1993) and eq. (2.1) (see text). 5.4. Etna
The Etna data (fig. 7) do not define any obvious trend, but this is largely due to the low number of MI analysed so far. The most primitive MI again have fS2 in the range 0.1 to 1 bar, as observed for the other volcanoes. The calculated aFeS values are the highest of the four volcanoes, ranging from 0.1 up to 0.95, or close to FeS saturation (fig. 4).
6. Composition of fluids
The compositions of fluids calculated for MI with known H2O, S and CO2 contents are listed in table II together with input fH2, fS2 and fH2O and the corresponding pressure of fluid saturation. In all cases, the computed mole fraction of CH4 is several orders of magnitude lower than that of either CO2 or CO, and this species is not considered further in this work.
6.1. Stromboli
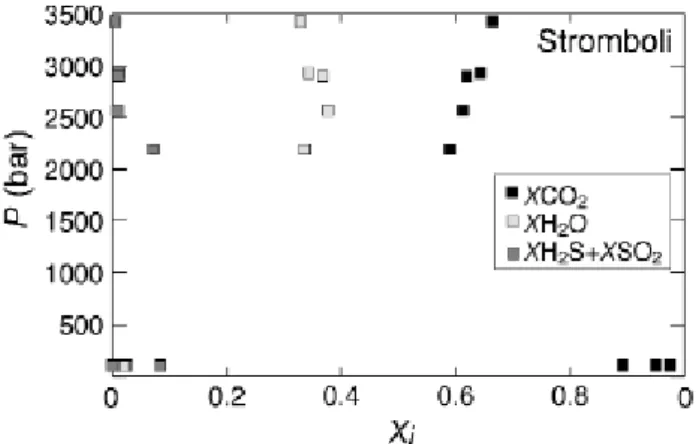
The pressures of fluid saturation of the MI in pumices range from 2100 bar to near 3500 bar (table II, fig. 8), i.e. they are comparable to those calculated by Métrich et al. (2001) and Bertagnini et al. (2003), despite the fact that sulphur bearing species were not taken into account in these works. This is due to the fact that, although melt sulphur contents are relatively high, the corresponding fS2, and thus the molar abundances of S-bearing species, remain low. In the calculated examples, the mole fractions of SO2H2S never exceeds 0.1 (fig. 8). The mole fraction of H2O remains relatively constant, at about 0.3, while that of CO2 slightly increases with pressure, exceeding 0.6 at near 3500 bar. The fluid coexisting with MI in scoria, calculated with the assumption of 50 ppm CO2
dissolved, corresponds to entrapement pressures of 100 bar, which is equivalent to a depth beneath the crater of ca. 300 m, ie similar to previous estimates (e.g., Harris and Stevenson, 1997). Given that the central part of the volcano is permanently flushed with CO2-rich gases, as remote sensing of the volcanic plume indicates (Allard et al., 1994), it is unlikely that magmas stored in the shallow reservoir are CO2-free. Therefore the 50 ppm threshold appears to a be a limiting condition which corresponds to the maximum possible pressure depth at which the upper reservoir that feeds the typical Strombolian activity is lying. Deeper conditions will inevitably produce MI with detectable CO2 contents with the FTIR method. Under these conditions it appears that the fluid phase is extremely rich in CO2, with XCO2 in excess of 0.9 (fig. 8). In contrast, the water content of the shallow magmatic fluid is very low being even lower than SO2 in some instances. Figure 9 shows the evolution of both H2O//SO2tot and CO2/SO2tot (SO2tot=SO2+H2S) mole ratios with pressure. MI of pumices define a broad positive trend in both ratios, whose extrapolation to near surface conditions corresponds to gases with H2O/SO2tot and CO2/SO2tot ratios between 0.1 and 1. Such ratios are at the lower end of the range displayed by fluids coexisting with scoria MI. In these, the H2O/SO2tot can exceed 10 while the CO2/SO2tot can go over 1000. Clearly such a large spread is chiefly due to the variable contents of sulphur dissolved in MI in scoria. The fact that the pumice MI trend intersects the lower end of the scoria trend suggests that this ratio range of 0.1-1 represents the fluid compositions of magmas just injected in the upper reservoir, which have not yet undergone extensive volatile degassing associated to normal Strombolian activity.
Fig. 8. Composition of fluids in equilibrium with melt inclusions from scoria and pumice
(Métrich et al., 2001). Xi is the mole fraction of species i. Symbols plotting at 100 bar correspond to melt inclusions in scoria, all other to melt inclusions in pumice. The compositions of fluids in scoria were calculated assuming a maximum CO2 content of 50 ppm.
Fig. 9. Pressure evolution of H2O/SO2tot and CO2//SO2tot mole ratios of fluids in
equilibrium with melt inclusion of Stromboli melt inclusions. The thick grey continuous and dashed lines represent average C/S and H/S ratio measured on a hot fumerole or within the dilute plume at Stromboli (Allard et al., 1994).
6.2. Vesuvius
The mole fractions of CO2, H2O and SO2tot of the 1944 eruption are plotted against pressures of fluid saturation on fig. 10. Calculated pressures range from slightly below 1000 bar to over 6500 bar, being again similar to those calculated by Marianelli et al. (1999). There is no clear trend with pressure, but it is interesting to note that even relatively low pressure MI yield fluid compositions very rich in CO2. In all computed
examples, the SO2 and H2S mole fractions remain below 0.05, whereas the mole fraction of H2O ranges betwen 0.2 up to 0.4. The H2O/SO2tot and CO2/SO2tot mole ratios decrease with pressure down to values of about 20 and 50, respectively, at 3000 bar (fig. 11), and then increase again with further pressure decrease. The second part of the evolution remains hypothetical, however, since it is based on a single MI datum at 900 bar.
Fig. 10. Composition of fluids in equilibrium with melt inclusions of the 1944 Vesuvius
eruption (Marianelli et al., 1999). Xi is the mole fraction of species i. Note the rather constant fluid composition over the pressure interval.
Fig. 11. Pressure evolution of H2O/SO2tot and CO2/ /SO2tot mole ratios of fluids in
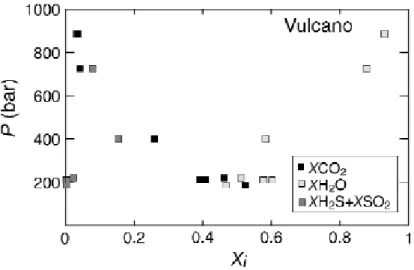
Fig. 12. Composition of fluids in equilibrium with melt inclusions of Vulcano magmas
(Clocchiatti et al., 1994a,b; Gioncada et al., 1998). Xi is the mole fraction of species i. Fluid compositions have been calculated assuming that the melt inclusions contain 50 ppm dissolved CO2. This gives maximum CO2 contents of the fluid. Note the continuous evolution of the fluid composition with pressure.
Fig. 13. Pressure evolution of H2O/SO2tot and CO2/ /SO2tot mole ratios of fluids in
equilibrium with melt inclusions of Vulcano magmas. 6.3. Vulcano
The fluid composition of Vulcano magmas is shown in fig. 12. Given the lack of detectable CO2, and the generally low melt H2O contents (<3 wt%), the calculated pressures for fluid saturation are low compared to Stromboli and Vesuvius, ranging from
900 down to 200 bar, in agreement with previous findings (Clocchiatti et al., 1994a; Gioncada et al., 1998). The data set shows a regular variation of fluid composition as pressure decreases. Between 900 and 200 bar, the mole fraction of H2O decreases continuously, from over 0.9 down to 0.5, being paralleled by a concomitant increase in CO2. The mole fraction of SO2tot first increases up to 400 bar, where it reaches a value of 0.15, and then decreases down to 0.05 at 200 bar. The evolution of the H2O/CO2tot and CO2//SO2tot mole ratios with pressure is shown on fig. 13. The H2O/CO2tot decreases continuously with pressure, reaching values of 1 at 200 bar. In contrast, the CO2/SO2tot ratio increases with decreasing pressures, from 1 at 900 bar up to 400 at 200 bar: note that this ratio displays considerable variation at 200 bar, as observed for Stromboli. This reflects variable depletion of sulphur during shallow level degassing of the magmas
6.4. Etna
Figure 14 shows the evolution of the mole fractions of H2O, CO2 and Stot with pressure calculated for melt water contents of 1 and 2.23 wt%, fO2 at NNO0.35, and melt sulphur contents of 3300-3400 ppm. We stress again that calculations assume the presence of a fluid phase in the entire pressure range. In both cases, the fluid composition is dominated by CO2 at pressures higher than 2000 bar. At pressures higher than 7000 bar, the fluid consists of more than 90% of CO2. For instance at 10000 bar, the calculated fluid composition corresponding to 1 wt% dissolved H2O has a mole fraction of CO2 of 0.97, that is the fluid is nearly pure CO2, in agreement with fluid inclusion constraints on primitive Etna basalts (Clocchiatti et al., 1992). Under such conditions the calculated CO2 content of the basalt melt is 0.85 wt% (table II). It is only below 1000 bar (2.23 wt% H2O) or 400 bar (1 wt% H2O) that CO2 is lower than H2O. For water-rich conditions, the mole fraction of H2O always exceeds that of SO2tot, while at a melt H2O content of 1 wt%, SO2tot equals or even exceeds H2O at pressures lower than 500 bar. The difference in fluid composition arising from different melt H2O contents is illustrated on fig. 15 where the mole fraction of H2O is plotted against that of CO2. Note that the mole fractions plotted correspond to actual value that take into account the sulphur species, whose total mole fraction reach values in excess of 0.44 (fig.14a,b, table II). This is why all the data plot below the mixing line corresponding to a binary H2O-CO2. Clearly, the amount of dissolved water significantly affects the fluid composition: at 500 bar the calculated mole fraction of H2O varies from 0.92 for a melt H2O content of 2.2 wt%, down to 0.22 for a melt H2O content of 1 wt%. However, the effect of melt H2O content vanishes at high pressure, so that at or above 7000 bar, the calculated fluid compositions for the two melt water contents diverge by less than 0.05 in their mole fraction of H2O. Variation in fO2 in the range considered, does not strongly affect the fluid compositions, apart from the SO2/H2S ratio. In contrast, a lower sulphur content of the melt (that is lower fS2) obviously decreases significantly the abundances of sulphur bearing species and, by implication, increases the CO2/SO2 ratio (table II).
Fig. 14a,b. Evolution of the mole fractions of H2O, CO2 and H2S+SO2 with pressure
calculated for melt water contents of 1 (a) and 2.23 (b) wt%, fO2 at NNO0.35, and melt sulphur contents of 3300-3400 ppm, corresponding to primitive Etnaean magmas. Xi is the mole fraction of species i.
Fig. 15. Evolution of the mole fraction of H2O against that of CO2 calculated for melt
water contents of 1 and 2.23 wt%, fO2 at NNO+0.35, and melt sulphur contents of 3300-3400 ppm, corresponding to primitive Etnaean magmas. The mole fractions correspond to actual values, that take into account the sulphur species, whose total mole fraction reach values in excess of 0.44 (fig. 14a,b, table II). This is why all the data plot below a mixing line corresponding to a binary H2O-CO2. Dashed lines represent isobaric conditions calculated for different melt water contents.
Fig. 16. Pressure evolution of the H2O/CO2 and CO2/SO2tot mole ratios for melts
having either 1 or 2.23 wt% dissolved H2O and 3300-3400 ppm of dissolved sulphur at NNO+0.35.
Figure 16 shows the dramatic effect that pressure exerts on the H2O/CO2 and CO2/SO2tot mole ratios. The H2O/CO2 ratio increases from 0.00.1 at 10000 bar to 1-100 at 400-500 bar, whereas the CO2/SO2tot decreases within this pressure interval from 1000 at 10000 bar down to 0.8-0.1 at 400-500 bar. The variation in melt water contents affects the H2O/CO2 ratio more than the CO2/SO2tot one, and the latter should be more accurate if used for barometric purposes (i.e. depth of main stage of volatile exsolution, see below).
7. Comparison with volcanic gases
The comparison with volcanic gases can be only made for Stromboli, Vulcano and Etna, since hot fumaroles or volcanic plumes have not been emitted at Vesuvius since its last eruption in 1944.
7.1. Stromboli
For Stromboli, direct sampling of fumeroles in the vent is prevented by hazardous access (Allard et al., 1994). The hottest fumerole sampled had a temperature of 410°C which is 700°C lower than the estimated temperature of magma last equilibration in the shallow reservoir. This fumerole has a H2O/SO2 mole ratio of 11 and a CO2/SO2 ratio of 19. Both ratios fall within the range calculated for magmatic fluids in the shallow reservoir (fig. 9) and are thus compatible with an origin from such a depth. The average ratio of CO2/SO2 in the dilute plume is 11, which fits also with a shallow reservoir origin, being at the lower end of the calculated fluid composition at 100 bar. The above reasoning, however, implicitly assumes that the volcanic plume composition is dominated by the composition of fluids at depth, and ignores the possible contribution of the melt degassing during ascent from the deep/shallow reservoirs to the surface. In other words, it assumes that the volcanic plume (or hot fumeroles) is fed by bubbles that escape the magma at a certain depth, reaching the surface unmodified (equivalent to a single step degassing at depth under closed system conditions). In the present case, this depth could lie anywhere between 100 and 3000 bar, since in this pressure range magmatic fluids having a CO2/SO2 ratio of 10 can be produced. Although such a scenario can apply to a magma intrusion at rest, like during periods of quiescent degassing with no magma emission, this is unlikely to happen in a decompressing magma body, in view of the exceedingly low melt viscosity of hydrous basalts that should allow volatiles degassing, and continuous melt-fluid re-equilibration, even on the short time scales characteristic of Strombolian eruptions. We have thus calculated the bulk fluid composition arising from meltfluid contribution, for various melt/fluid ratios, assuming that the melt can fully degass upon eruption or ascent (see also Scaillet and Pichavant, 2003). Figure 17 shows the results in terms of CO2/SO2 mole ratios, which is a ratio typically measured in volcanic plumes (Allard et al., 1994). Also shown are the CO2/SO2 mole ratios of the melt and fluid phases. Excluding kinetic effects, any fluid vented at Stromboli must lie between these two poles. As shown on fig. 17, if the deep magma contains 0.1 wt%, the resulting bulk fluid has a CO2/SO2 ratio of 1, ie significantly lower than the average one measured in the plume (11). In contrast, if the magma at depth contains 4 wt% fluid, then the resulting CO2/SO2 ratio is similar to that measured, with an average at 11. Higher fluid contents at depth would further increase the ratio: a fluid content of 10 wt% would give a CO2/SO2 ratio of 22.
We thus suggest that in order to produce a volcanic plume with a CO2/SO2 ratio of 11, the main magma reservoir must be fluid-saturated with a fluid amount of ca. 4 wt%. Petrological and geophysical data (see Francalanci et al., 1989) suggest the existence of a large reservoir at 10-14 km depth, in agreement with MI constraints (Métrich et al., 2001; Bertagnini et al., 2003), in which the magmas injected in the shallow reservoir are produced. On this basis, it is probable that such a reservoir is the major source of volatile emissions at Stromboli (Bertagnini et al., 2003). Thus, the above analysis suggests that such a reservoir must contain a significant amount of free fluid in order to reconcile observations (volcanic plume composition, MI volatile contents) and the thermodynamic constraints (this work) on fluid composition. The total volatile content of Strombolian magmas can be estimated using the fluid composition calculated in this work, the amount of volatiles dissolved in the melt (Métrich et al., 2001) and assuming a fluid content of 4 wt%. This gives the following range (corresponding to different volatile contents of MI in pumice): H2Otot: 2.86-3.45 wt%; CO2tot: 2.94-3.46 wt%; SO2tot: 0.29-0.90 wt% (or 1450-4500 ppm sulphur). The H2O and S values are close to those analysed in MI, which is due to the fact that the concentrations of both volatiles are comparable in melt and fluid. In contrast, the bulk CO2 content is more than one order of magnitude higher than that dissolved in MI (0.089-0.169 wt%), which is due to the CO2-rich character (XCO2>0.6) of the fluid phase at Stromboli. The very high bulk CO2 content suggests that even the most primitive magmas at Stromboli, i.e. those generated at mantle pressures, are fluid-saturated as well.
Fig. 17. Effect of the amount of fluid in the reservoir on the final fluid compositions
(resulting from the contribution of volatiles from the melt and fluid, melt+fluid), expressed in terms of the CO2/SO2tot mole ratio (see text), for Stromboli magmas. The compositions of fluid and melt phases are shown as closed symbols. A fluid amount of 0.1 wt% in the deep reservoir results in a final fluid having a CO2/SO2tot ratio of 1, whereas an amount of 4 wt% results in a final CO2/SO2tot mole ratio of 10, similar to that measured in the volcanic plume of Stromboli (thick grey line, from Allard et al., 1994).
7.2. Vulcano
The geochemistry of volcanic fumeroles at Vulcano has been extensively discussed and modelled using various approaches and chemical tracers (e.g., Capasso et al., 1994, 2001; Chiodini et al., 1995; Todesco, 1997; Nuccio et al., 1999; Giggenbach et al., 2001; Nuccio and Paonita, 2001; Di Liberto et al., 2002; Diliberto et al., 2002; Paonita et al., 2002). There is a general agreement that the fumerole compositions at Vulcano result from mixing between a magmatic source and a boiling hydrothermal system. Here we focus on the highest temperature fumeroles, in which the magmatic signature is less likely to be affected by such a mixing. The hottest fumeroles reached a temperature of near 700°C, and consisted in 85-90% H2O, 5-15% CO2 with minor amounts of sulphur, in the order of 3 % (Capasso et al., 1994), having an fO2 of NNO1 or very close to that inferred from sulphur speciation (NNO0.72). Although quite variable, the measured CO2/SO2 mole ratio is ca. 10 (e.g., Giggenbach et al., 2001), or similar to that of Stromboli. If taken at face value, the 9/1 ratio of H2O/CO2 suggests an origin of such fluids from a reservoir located at 800-900 bar (fig. 12), since lower pressure would correspond to higher mole fraction of CO2. It must be remembered, however, that this is based on the assumption that MI at Vulcano have a maximum of 50 ppm dissolved CO2. Clearly, lower dissolved CO2 would allow water-rich fluids to be produced at lower pressures. However, geochemical modelling (Nuccio et al., 1999) has shown that the hydrothermal contribution is quite high even in the hottest fumeroles (up to 30%), which implies that the H2O mole fraction of fumeroles are probably maximum values. Similarly, if the CO2/SO2 ratio is used to infer the depth of fluid exsolution, then a pressure of 200-300 bar is retrieved (fig. 13), but again, lower CO2 in MI would decrease this estimate. On the other hand, magmatic gas scrubbing by aquifers is known to strongly deplete magmatic gases of their SO2 (Symonds et al., 2001) which indicates that the sulphur content of fumeroles are minimum values. This will counteract the effect due to an overestimation of CO2 in MI, leading to an increase in the CO2/SO2 ratio. As for Stromboli, the above comparison ignores the melt contribution to the volatile budget and that due to decompression or to crystallisation. However, compared to Stromboli, a proper evaluation of this contribution is hampered by the compositional variability of erupted magmas at Vulcano (e.g., Clocchiatti et al., 1994a). That is, the evaluation of melt contribution depends on whether the upper reservoir stores rhyolite or some more mafic composition. If for instance, we assume that the main degassing magmatic source is rhyolite melt, then a fluid amount of 0.5 wt% in the shallow reservoir would be needed in order to release a fluid with appropriate mole ratios of H2O/CO2 and CO2/SO2. Clearly, however, the uncertainty concerning the chemical nature of the plumbing system, coupled with the lack of precise CO2 determination in MI, prevent us obtaining robust constraints on bulk volatile compositions and their possible depth of exsolution. To these sources of error must be added the hydrothermal contribution, that modifies to various extents the composition of magmatic fluids (Nuccio et al., 1999). We must therefore await for more precise data on CO2 content in MI before doing any conclusive statement.
7.3. Etna