MIT-D15
DEUTERIUM CONCENTRATION BY
CHEMICALLY-REFLUXED AMMONIA-HYDROGEN EXCHANGE
SUPPLEMENTARY REPORTS
by
M. Benedict, E.A. Mason, E.R. Chow, J.S. Baron
June 1969
FOR
E.I. DUPONT DE NEMOURS & COMPANY UNDER
U.S. ATOMIC ENERGY COMMISSION SUBCONTRACT AX-210280
Department of Nuclear Engineering Massachusetts Institute of Technology
Cambridge, Massachusetts 02139
AECL PROPRIETARY DOCUMENT
Notice: This document contains information obtained from Atomic Energy of Canada Limited, designated AECL PROPRIETARY. Documents so designated are made available to the USAEC pursuant to the Memorandum of Understanding executed June 7, 1960, for distribution
restricted to the USAEC or its contractors. No other distribution is to be made without permission of AECL which may be secured by requesting specific clearance from the
Scientific Representative, USAEC, Chalk River Liaison Office, Chalk River, Ontario.
MIT-Dl5
DEUTERIUM CONCENTRATION BY
CHEMICALLY-REFLUXED AMMONIA-HYDROGEN EXCHANGE
SUPPLEMENTARY REPORTS
by
M. Benedict, E.A. Mason, E.R. Chow, J.S. Baron
June 1969
for
E.I. duPont de Nemours & Company under
U.S. Atomic Energy Commission Subcontract AX-210280
(MIT DSR-70672)
Department of Nuclear Engineering Massachusetts Institute of Technology
Cambridge, Massachusetts 02139
Table of Contents
Page
Introductory Note I-1
Supplement A
Liquid-Vapor Equilibrium in the System NH 3-H 2-N2
1. Introduction A-1
2. Results
2.1 Liquid Phase A-1
2.2 Vapor Phase A-2
3. Sources of Data A-3
4. Procedure for Correlating Data
4.1 Henry's Law Constants A-4
4.2 Ammonia Content of Vapor A-5
5. Bibliography A-19
Supplement B
Enthalpies of Hydrogen, Nitrogen, and Ammonia to 14000F and from 0 to 200 Atmospheres
1. General Information A. Introduction B-1 B. Manner of Reporting B-1 C. Use of Graphs B-2 II Hydrogen Enthalpies A. Preparation of Curves B-5
B. Enthalpy of Hydrogen Graphs B-8
III Nitrogen Enthalpies
Page B. Extrapolation to Higher Pressures B-13
C. Preparation and Use of Nitrogen Graphs B-17
D. Enthalpy of Nitrogen Graphs B-18
IV Ammonia Enthalpies
A. List of Correlated Data B-24 B. Transposing Data to Report Basis B-24
C. Obtaining the Zero Pressure Line B-26
D. Plotting the Saturated Vapor and
Liquid Lines B-30
E. Use of the Beatlie--Bridgeman Equation
of State B-34
F. Completion of Superheated Curves by
Grahl's Data B-38
G. Enthalpy of Compressed Liquid Ammonia B-41 H. Construction of the Ammonia Graphs B-44 I. Enthalpy of Ammonia Graphs B-45
V. Bibliography B-59
Supplement C
Thermodynamic Equilibria for Ammonia Synthesis and Cracking
1. Introduction C-1
2. Sources of Information C-1
3. Calculation of Equilibrium Constants C-2
4. Calculation of Equilibrium Ammonia
Mole Fraction C-3
Page Supplement D
Prediction of Plate Efficiency in the Hydrogea Deuterium--Ammonia Exchange Reaction
I. Introduction D-1.
II. Effect of a Chemical Reaction on the Mass Transfer Rate
A. General Theory D-1
B. Determination of 0 for the
HD(l)-NH 3(1) Exchange Reaction D-3
III. Efficiency Correlation
A. Literature Survey D-8
B. Modification of the A.I.Ch.E.
Correlation D-8
IV. Absorption System Design
A. Choice of Operating Conditions D-18
B. Physical and Phase Properties D-20 C. Determination of Flow Rates in
Exchange Towers D-21
D. Tray Characteristics D-22
E. Evaluation of the Efficiency Prediction and Comparison with
Experiment D- 23
V. Conclusions D-26
Page Supplement E
Analysis of Stirred Contactors for Gas-Liquid Exchange Reactors
1. Introduction E-1
2. Proposed Model E-2
3. Mass Transfer with Chemical Reaction
3.1 Model E-6
3.2 Solution E-6
3.3 Determination of E-10
3.4 Bubble Gas Distribution Function E-11
4. Possible Design Numbers E-13
5. References E-14
Supplement F
Chemically Ref luxed Water-Hydrogen Sulfide Exchange Process
1. Process Description F-1
2. Survey of Possible Metal Sulfide-Oxide Pairs F-3 3. Evaluation of- Energy Requirements F-21
List of Tables Page Supplement A Table 1. Table 2. Table 3. Table 4. Table 5. Table 6.
Values of Henry's Law Constants: Liquid Phase Data From LeFrancois and Vaniscotti
Values of Henry's Law Constants:
Liquid Phase Data From Larson and Black Sample Computations for Henry's Law Constants at 0.0 0C For Three Pressures Ammonia Content of Vapor Expressed As
YNHfr. Data From LeFrancois and Vaniscotti Ammonia. Content of Vapor Expressed as
YNH3 r. Data From Larson and Black Ammonia Content of Vapor Expressed Ab
YNH3Y. Data from Michels, et. al. Supplement B
Table 1. Comparison of Hydrogen Enthalpies From Canadian Graphs and From NBS Circular 564 Table 2. Values of Nitrogen Enthalpies Based On
Absolute Zero Temperature
Table 3. Extrapolation to Higher Pressures at 4220F. An Illustration of the Method of Second Differences
Table 4. Nitrogen Enthalpies Extrapolated For
A-7 A-8 A-9 A- 10 A-11 A-12 B-6 B-11 B-13 Higher Pressures B-15
Table 5. Ammonia Enthalpies at Zero Pressure, From Ammonia Tables
Table 6. Ammonia Enthalpies at Zero Pressure, From Tsoiman Equation
Table 7. Ammonia Enthalpies for Saturated Vapor and Liquid Lines, from Ammonia Tables Table 8. Saturated Vapor Line Up to Critical
Point, from Grahl's Thesis
Table 9. Saturated Liquid Line Up to Critical Point, from Grahl's Thesis
Table 10. Superheated Ammonia Enthalpies, from the Beattie-Bridgeman Equation of State Table 11. Superheated Ammonia Enthalpies, from
Grahl's Thesis: 1200 to 3000 psia
200 to 1000 psia
Table 12. Correction Term for Compressed Liquid Ammonia
Supplement C
Table 1. Ideal Gas Equilibrium Constant K Table 2. Values of K or Constant Relating
Fugacity Coefficients
Table
3.
Values of K or Constant Relating Mole Fractions of ComponentsTable 4. Values of yNH , Equilibrium Ammonia 3 Mole Fraction C-5 C-5 C-6
C-6
Page B-27 B-29 B-31 B-33 B-33 B-37 B-39 B-40 B-43Page Supplement D
Table I. Proposed Operating Conditions of
Reference Design D-18
Table II Design Data for Exchange Tower D-20
Table III Inlet and Exit Compositions In
Exchange Tower D-21
Table IV Physical Characteristics of Proposed
Tray Design D-23
Table V Exchange Tower Operating Parameters D-23
Supplement F
Table 1 Equilibrium Constant for Reaction
IMO + H2 S M1Sn+ F-5,6
List of Figures Page Supplement A. Figure 1. Figure 2. Figure 3. Figure 4. Figure 5. Figure 6.
Henry's Law Constant of H2 in Liquid
NH3 vs. Temperature toC
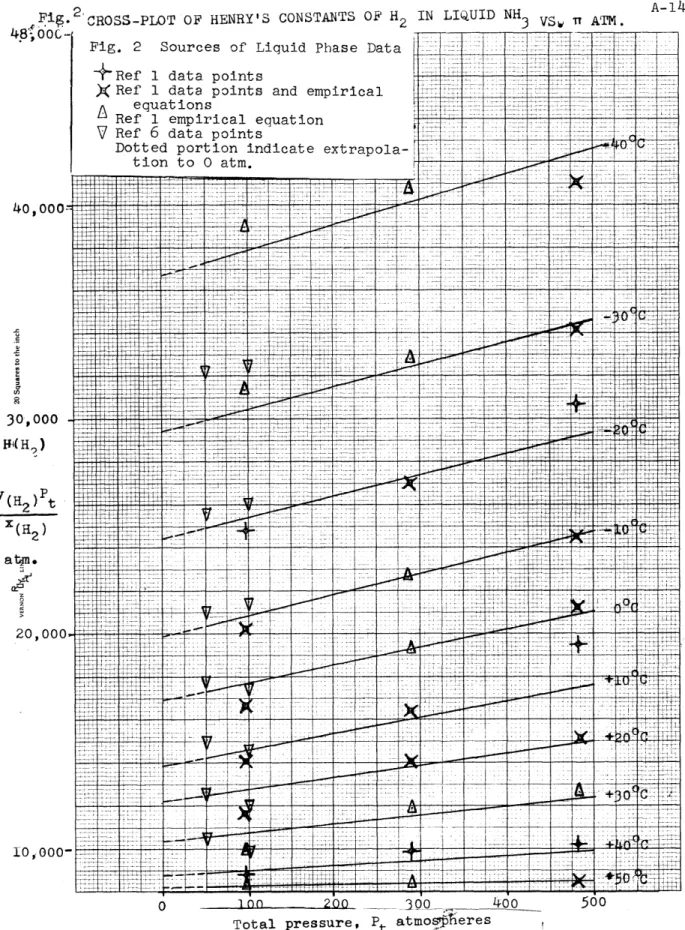
Cross-plot of Henry's Constants of H2 in Liquid NH3 vs . TT Atm.
Henry's Law Constant of N2 in Liquid
NH3 vs. Temperature toC
Cross-Plot of Henry's Constants of N2 in Liquid NH3 vs. r Atm.
Ammonia Content of Vapor yNH VS.
l/T OK~
Cross-Plot of Ammonia Vapor yNH 3 vs. 7 Atm. Supplement Figure 1-1 Figure 1-2 Figure 1-3 Figure 1-4 Figure 1-5 Figure 1-6 Figure 1-7 Figure 1-8 Figure 1-9 B Enthalpy of Hydrogen Enthalpy of Hydrogen Enthalpy of Nitrogen: Enthalpy of Nitrogen: Enthalpy of Nitrogen: Enthalpy of Nitrogen: Enthalpy of Nitrogen: Enthalpy of Nitrogen: Enthalpy of Ammonia First Index: -100 to -80 to 2000F 100 to 4200F 400 to 720'F 700 to 9800F 960 to 1280 1240 to 1560 F 700F F A- 13 A- 14 A- 15 A- 16 A- 17 A- 18 B-8 B-9 B-18 B-19 B-20 B-21 B-22 B-23 B- 45
Page Figure 1-10 Enthalpy of Ammonia
Second Index: 6000F to 10000F B-46 Figure 1-11 Enthalpy of Ammonia
Third Index: 1000 to 14000F B-47 Figure 1-12 Enthalpy of Ammonia
Graph I: -Liquid Phase, 180 to 3400F B-48 Figure 1-13 Enthalpy of Ammonia
Graph II: Critical Region, 180 to 3800F B-49
Figure 1-14 Enthalpy of Ammonia
Graph III: Saturated Vapor Region,
-100 to 1800F B-50
Figure 1-15 Enthalpy of Ammonia
Graph IV: Vapor Phase, 180 to 4600F B-51
Figure
1-16
Enthalpy of AmmoniaGraph V: Vapor Phase, 140 to 4600F B-52 Figure 1-17 Enthalpy of Ammonia
Graph VI: Vapor Phase, 340 to 6200F B-53 Figure
1-18
Enthalpy of AmmoniaGraph VII: Vapor Phase, 460 to 7000F B-54 Figure 1-19 Enthalpy of Ammonia
Graph VIII: Vapor Phase, 680 to 8800F B-55 Figure 1-20 Enthalpy of Ammonia
Graph IX: Vapor Phase, 800 to 10800F B-5C Figure 1-21 Enthalpy of Ammonia
Figure 1-22 Enthalpy of Ammonia
Graph XI: Vapor Phase, 1200 to 1400 F
Supplement C Figure 1. Supplement D Figure 1. Supplement E Figure 1. Equilibrium Ammonia
Mole Fraction yNH' vs. t, 0F
Tray Model In Vapor Terms
Spherical Gas-Liquid Model Supplement F
Figure 1. Chemically Refluxed Water-Hydrogen Sulfide Exchange Process
Page B-58 C-7 D- 1 5a E- 15 F-9
I-1
INTRODUCTORY NOTE
The six topical reports contained in this volume supple-ment the final report (1) of a research project whose
ob-jective was to evaluate the use of chemical reflux in processes for deuterium extraction. The studies were carried out by the Department of Nuclear Engineering at the Massachusetts Institute of Technology for the U. S. Atomic Energy Commission under a subcontract from the E. I. duPont de Nemours & Company.
Major emphasis during the two years of study was given to the design and evaluation of a process employing chemical reflux in the ammonia-hydrogen exchange system. Basic
thermodynamic information relating to the system NH3 - H2 - N2
was developed for this purpose and is presented in Supplements
A, B, and C. Methods were developed for estimating the
transfer efficiency of plate-type and stirred-type contactors for the exchange of hydrogen and deuterium in the gas-liquid
system of synthesis gas and liquid ammonia; these methods are presented in Supplements D and E. The information in these five supplements was used in developing the process design for the overall deuterium extraction plant discussed
in the final report.
The results of a brief survey of chemical reflux in the water-hydrogen sulfide process for deuterium extraction are presented in Supplement F.
(1) M. Benedict, E.A. Mason, E.R. Chow, and J.S. Baron,
"Deuterium Concentration by Chemically-Refluxed Ammonia Hydrogen Exchange," Department of Nuclear Engineering, M.I.T., Cambridge, Mass., (June 1969) MIT-D14.
A-1
SUPPLEMENT A
LIQUID-VAPOR EQUILIBRIUM IN SYSTEM NH3 - H2 - N2
1. Introduction
Under subcontract No. AX 210280 with E. I. du Pont de Nemours and Company, MIT has started study of the
ammonia-hydrogen exchange process for concentrating deuterium for du Pont and the U. S. Atomic Energy Commission. Exchange tower design calculations for this process require accurate phase equilibrium data for a system whose gas phase consists
of hydrogen and nitrogen in 3 to 1 molar ratio plus ammonia vapor and whose liquid phase consists of hydrogen and nitrogen dissolved in liquid ammonia. This memorandum correlates
experimental data on liquid-vapor equilibria for this system and presents it in a form convenient for use in tower
calcu-lations. The principal experimental investigators whose measurements were correlated are
Larson and Black, 1925 (References 5 and 6)
Michels, et. al., 1950, 1959 (References 3 and 4) and Lefrancois and Vaniscotti, 1960 (References 1 and 2)
2. Results
2.1 Liquid Phase. - Liquid phase compositions have been reported as Henry's law constants for hydrogen H and nitrogen HN. The Henry's law constant is defined as
Hi
A-2
where yi = mole fraction of hydrogen or nitrogen in vapor x i= mole fraction of corresponding component in liquid
7 = total pressure
graphical correlations of these constants are presented in the following figures:
Figure - Number
Variable Range at Constant H2 N2
Temp. -40 to +500C Pressure 1
3
Pressure 0 to 500 atm Temp. 2 4
original data points and their sources are indicated by the different symbols on the figures. Curves correlating the data have been drawn through the points in such a way as to provide a regular family. By providing plots against both pressures and temperatures, interpolation to intermediate values of these variables has been facilitated.
2.2 Vapor Phase. - Vapor phase compositions have been reported in terms of y N3v, where yNH3 is the equilibrium
mole fraction of ammonia in the vapor phase and 7 is the total pressure. Figure 5 is a plot of yNH 3 T vs 1/T at constant
3
pressure, on semilog paper. Experimental points fall on essentially straight lines as would be expected from the
Clapeyron equation. The range of pressures is from 50 to 600 atm, and the range of temperature is from -50 to +500C. Figure 6
A-3
is a plot of yNH 7 vs pressure at constant temperature on
3
semilog paper. This was used primarily to interpolate experi-mcntal data taken at irregular pressures to the even pressures plotted in Figure 5.
3. Sources of Data
Lefrancois and Vaniscotti reported gas solubilities in liquid ammonia from -50 to +500C at three pressures - 100, 300,
and 500 kg/cm 2, giving at the same time empirical equations
of gas solubilities as functions of temperature. In another report,2 these two men reported on ammonia vaporization into a mixture of synthesis gas from -70 to +600C at 300 and 500
kg/cm , also giving an empirical equation based on their data. Earlier, Michels, Skelton and Dumoulin 3,4 gave data on gas solubilities and ammonia vaporization at pressures ranging from 25 to 800 atmospheres and temperatures from -30.0 to
121.80C, although not at regular increments of either parameter. They summarized their data in the form of pressure-NII3 mole fraction and temperature-NH3 mole fraction diagrams.
Much earlier yet, Larson and Black experimentally obtained ammonia concentrations in the vapor phase at 50,
100, 300, 600, 1000 atmospheres total pressure at various temperatures from -22.0 to 18.700. 5 At about the same time, they reported on synthesis gas solubility in liquid ammonia at
50, 100, and 150 atmospheres total pressure for the same
A-4
4. Procedure for Correlating Data
4.1 Henry's Law Constants. - By virtue of being the
most regular and exhaustive, the data of Lefrancois and
Vaniscotti have been invariably admitted as the most reliable of the three. At 300 and 500 kg/cm 2, Henry's law constants for both hydrogen and nitrogen have been calculated based entirely on either their. data points or their empirical
equations. At 100 kg/cm 2, concentrations in the liquid phase were obtained directly from Lefrancois' data, but the
corrections in the vapor phase due to ammonia vaporization had to be obtained from the vapor phase correlation of all three sets of data. Table 1 lists the values of Henry's law constants at these three pressures for temperatures from
50 to -500C.
For purposes of comparison and of extending the results into the lower pressure region, calculations were made at
100 and 50 atmospheres based on Larson and Black's liquid
phase concentrations. Results are listed in Table 2. Vapor phase corrections again were taken from an over-all correlation. Then, by plotting the Henry's law constants at 50 atm,
290.3 atm (300 kg/cm 2), and 483.9 atm (500 kg/cm 2) with
temperature as parameter on the H vs 7r graphs, straight lines
were obtained that gave values at intermediate pressures. (Figures 2 and 4).
A-5
Now, on the H vs t graphs (Figures 1 and 3) isobars at 290.3, and 483.9 atm gave smooth curves for both hydrogen and nitrogen. In the case of nitrogen, extra isobars at
50 atm and 96.78 atm (100 kg/cm 2) were drawn; and for hydrogen, an extra isobar at 100 atm was included. By using the
H vs 7 lines, values at 0.200, and 400 atm at various tempera-tures were read off and plotted on the H vs t curves. These cross-plotted values are connected by dotted lines on the H vs t0C graph.
Henry's law constants at other temperatures and pressures within the range covered may be obtained by the same technique of interpolation and cross-plotting. A brief examination of the H vs 7r straight lines shows that the ultimate guide in fitting the lines was that the slope should gradually decrease for increasing temperatures. The regularity of the lines had to be upheld. In fact, straight lines were drawn only because the scarcity of the data could justify no other curve.
Table 3 illustrates how Henry's law constants are calculated, showing at the same time the sources from which the necessary information has been obtained.
4.2 Ammonia Content of Vapor. - Figure 5 is a semilog plot of yH vs K . Here again, Lefrancois and Vaniscotti's data at 290.3 atm (300 kg/cm2) and 483.9 atm (500 kg/cm2)
served as guides. At these two pressures, data points listed under Table 4 yielded straight lines when plotted on Figure 5.
A-6
Larson and Black5 provided a few points at 50, 100, and 600 atm, listed in Table 5. Their data pointshowever, did not cover a considerable temperature range. So to extend the
50, 100, and 600 atm isobars on Figure 5 throughout the temperature range, more points were obtained by means of a cross-plot of y Tr vs Tr atmospheres (Figure 6).
On Figure 6, Michel's data points3,4 were plotted along with a few points from other sources available at the same temperatures as Michel's data. Best curves were drawn on Figure 6 at the five temperatures of Michel's data: 49.73, 24.5, 0, -14.90, and -30.960C. Points were picked off from
these curves at 50, 100, and 600 atm and reploted on Figure 5 to complete the isobars. Best lines were drawn through the points.
The 40.0 and 10.00C curveson Figure 6 were obtained by
cross-plotting points from Figure 5 at 50, 100, 290.3,483.9 and 600 atm, the five pressures at which isobars had been completed on Figure 5. Finally, points for the 150, 200 and 400 atm isobars in Figure 5 were picked off the seven
A-7
TABLE I. VALUES OF HENRY'S LAW CONSTANTS: LIQUID PHASE
DATA FROM LEFRANCOIS AND VANISCOTTI (REFERENCE 1)
HENRY'S LAW CONSTANT, ATM.
Pressure: 483.9 atm2 (500 kg/cm2) 290.3 atm 2 (300 kg/cm2) 96.78 atm2 (100 ka/cm2) N 2 8,530 8,920 10,270 1o,84o H2
8,360
9,870
N 2 7,990 9,510 12,640 13,490 11,860 11,550 15,200 16,4oo 14,070 13,850 19,560 21, 350 22.590 25,830 16,436 16,880 19, 250 20, 320 24,610 31,o4o 22,690 24, 480 30,660 39,880 27,020 30,15034,170
41,15046,66o
32,780
37,840
6o,45o
40,760
49, oo
53,720 85,490 52,360 65,720 H2 Temp. 50'0 40'C 3000 20 0 C 10 0 0 0 -10 0 C -20 0 -30 0 C -40 C -500 C H2 8,270 8,68o 9,980 11,780 14,110 16,710 20,270 24,830 31,140 39, o8o N 26,130
6,940
8,14o
9,800
11,740 13,830 16,700 20,450 25,680 32, 040 49,730 4o,820A-8
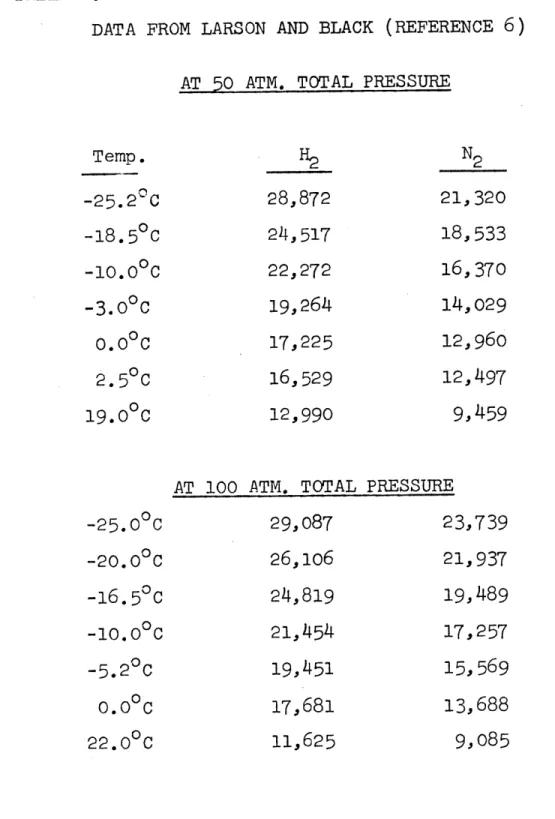
TABLE 2. VALLUES OF HENRY'S LAW CONSTANTS: LIQUID PHASE
DATA FROM LARSON AND BLACK (REFERENCE 6)
AT
50
ATM. TOTAL PRESSURETemp. H2 N 2 -25.2 C 28,872 21, 320 -18.50c 24,517 18,533 -10.0 0 22,272 16,370 -3.0 0 19,264 14,029
o.o
C 17,225 12, 960 2.50C 16,529 12,497 19.00 12,990 9,459AT 100 ATM. TOTAL PRESSURE
-25.0 0C 29,087 23,739 -20.0 C 26,106 21, 937 -16.5 0C 24,819 19,489 -10.0 0 21,454 17,257 -5.20C 19,451 15,569 O.O C 17,681 13,688 22.0 0C 11,625 9,085
TABLE 3. SAMPLE COMPUTATIONS FOR HENRYtS LAW CONSTANTS AT 0.00C FOR THREE PRESSURES TEMPERATURE 0.00C Item Source (1) (2)
(3)
(4)
(5)(6)
(7)
(8)
(9)
(10) (11) Total Pressure T 483.9 290.3 100.0Moles Synthesis aLef and Van. data point a b .
gas/mole NH Lef and Van. empirical equation 0.0 2 1 5 8a
H3 CLarson and Black data point
XN2 + XH2) 0.02112 0.01444 0.005716
xN dInterpolation from Lef and Van
0.2 1 6d 0.2 40 d 0.301'
N 2 Larson and Black data
N2 H
2
xN2 (3) (4) 0.004562 0.003466 0.001721
xH2 (3) - (4) 0.016558 0.010974 0.003995
YNH fLef and Van. data 0.0260 0.02979 O.05819
3 Larson and Black interpolation
yN 0.25
LT-(?)]
0.2435 0.2426 0.2355 YH2 0.75L(7X
0.7305 0.7277 0.7064 H 2 N2 7 25,830 20,320 13,688 N2 HH2 H 211 2__ 21,9350 19,p250 17,681 XH2 \10A-lo
TABLE 4. AMMONIA CONTENT OF VAPOR EXPRESSED AS yNH
3
DATA FROM LEFRANCOIS AND VANISCOTTI (Ref. 2) AT
483.9
ATM. (500 kg/cm),
DATA POINTSTemp.,0 C 62.5 52.5 40.0 30.0 20.0 10.0 0.0 -10.0 -20.0 -32.0 -40.0 -50.0 -69+1.5 0 K -2.98 3.07 3.194 3.299 3.412 3.532 3.662 3.801 3.951 4.151 4.292 4.482 4.903, AT 290.3 ATM. x yNH 3 o.1451 0.1134 0.08173 0.06384 0.04789 0.03615 0.02600 0.01826 0.01283 0.00815 0.00567 0.003587 0.001198 (300 kg/cm 2). DATA POINTS t0C 50.0 40.0 20.0 0.0 -25.0 -50.0
-69+1.5
y7r atm. YNH 3 0.1292 0.09902 0.05758 0.02979 0.01163 0.003984 0.001498AT 290.3 ATM., EMPIRICAL EQUATION YNH 3 0.07707 0.04206 0.02086 0.01417
0.009394
0.006078 y7 atm. 22.37 12.21 6.056 4.114 2.727 1.764 y7 atm. 70.7054.87
39.55
30.89 23.17 17.49 12.588.836
6.2o8
3.944
2.744 1.736 0.580 x 10³ -K T 3.0943.194
3.412 3.662 4.030 4.482 4.90355.74
2807516.72
8.648
3.376
1.157o.435
x 103 t0C +30.0 +10.0 -10.0 -20.0 -30.0 -40.0 10 -3.299 3.532 3.801 3.951 4.113 4.292A-11
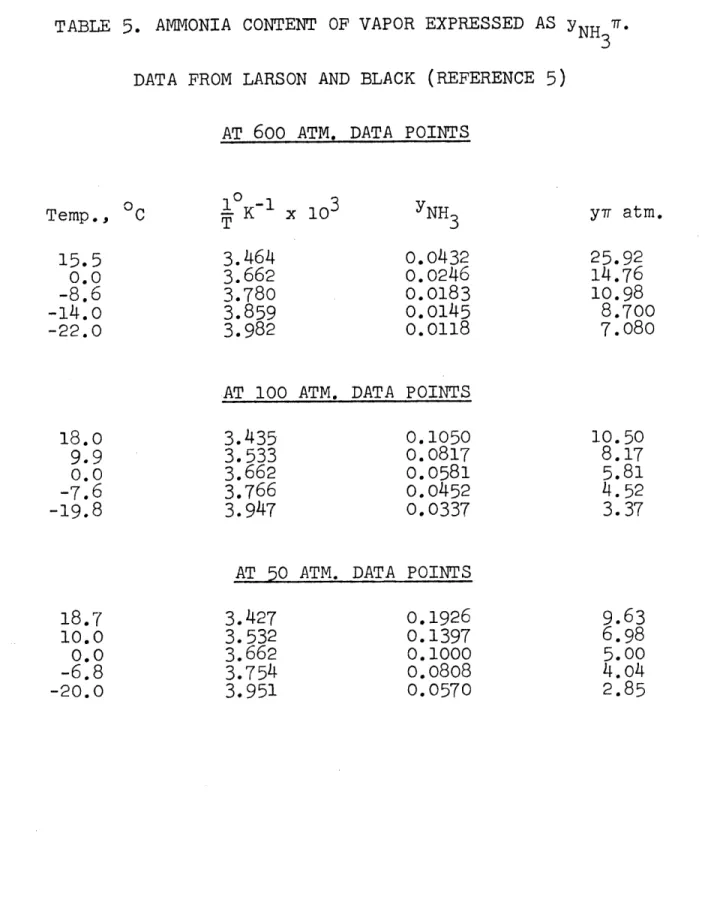
TABLE
5.
AMMONIA CONTENT OF VAPOR EXPRESSED AS NH3 DAT 3 DATA FROM LARSON AND BLACK (REFERENCE 5)AT 600 ATM. DATA fK~ x 103 3.464 3.662 3.780 3.859 3.982 POINTS YNH 3 0.0432 0.0246 0.0183 0.0145 0.0118
AT 100 ATM. DATA POINTS
3.435 0.1050
3.533 0.0817
3.662 0.0581
3.766 0.0452
3.947 0.0337
AT 50 ATM. DATA POINTS
3.427 3.532 3.662 3.754 3.951 0.1926 0.1397 0.1000 0.0808 0.0570 y7 atm. 25.92 14.76 10.98 8.700 7.080 10.50 8.17 5.81 4.52 3.37
9.63
6.98 5.00 4.04 2.85 Temp., 0C 15.50.0
-8.6 -14.0 -22.0 18.0 9.9 0.0 -7.6 -19.8 18.7 10.00.0
-6.8 -20.0A-12
TABLE 6. AMMONIA CONTENT OF VAPOR EXPRESSED AS yNH '
DATA FROM MICHELS, ET AL (REFERENCE 3 AND 4)
AT CONSTANT TEMPERATURE 49.730C T atm. 49.1 102.0 196.6 292.7 585.1 782.5 25.2 49.7 102.1 196.6 294.6 395.0 487.4 585.1 782.5 26.0 48.9 102.0 292.8 487.4 782.5 9.22 24.30 49.37
74.34
99.36 200.60 300.06 498.68 800.95 9.25 24.17 49.33 74.27 99.32 300.00 398.78 598.82 799.43 yNH 3 o.4659 0.2590 0.1645 0.1325 0.0993 0.0902 AT 24.5'C 0.4183 0.2290 0.1306 0.0810 0.0642 0.0564 0.0512 0.0490 0.0454 AT 00C 0.1790 0.1026 0.0557 0.0299 0.0242 0.0218 AT -14.900C 0.2375 0.0964 0.0505 0.0359 0.0300 0.0192 0.0158 0.0130 0.0116 AT -30.960C 0.1092 0.0479 0.0242 0.0185 0.0150 0.0076 0.0071 0.0063 0.0058 2.190 2.343 2.493 2.669 2.981 3.852 4.741 6.483 9.791 1.010 1.158 1.194 1.374 1.490 2,280 2.831 3.773 4.637 y7 atm. 22.88 26.42 32.34 38.78 58.10 70.58 10.54 11.38 13.33 15.92 18.91 22.28 24.95 28.70 35.53 4.654 5.017 5.681 8.755 11.80 17.06A-13
Fig. 1 HENRY'S LAW CONSTANT OF H2 IN LIQUID NH3 VS. TEMPERATURE t0C +I] 4 i 50,000 O, OO '30,100 2 (H ) 2(H ) t
-I
lip'Pt-I
I
Temperature t CFig. 1 Sources of Liquid Phase Data
7 +Ref 1 data points
X Ref 1 data points and empirical equation
Ref 1 empirical equations
7 Ref 6 data points o Cross-plot from Fig. 2
Dotted lines indicate curves at 0,200 and 400 atm. 0 t T |T7 IT-n 4 0 4" ti_ tt p - - - - to-_+ft ---- - -- -- -t -- a e _++ +f4 -- - - - t tr J - t -ry - t tt T - ;--1t - --- -T 7 --- - C- - - - - - -I 30 -2 0t)1)r z :' 6 -8atm. r20, 000 2 10,000
Fig. CROSS-PLOT OF HENRY'S CONSTANTS OF H2 IN LIQUID NH3 VSy i ATM.
4+8 00C- -rTF F T T
Fig. 2 Sources of Liquid Phase Data
+Ref 1 data points
XRef 1 data points and empirical
equations
Ref 1 empirical equation
V Ref 6 data points
Dotted portion indicate extrapola-tion to 0 atm. .7 7 A-<i I A-14 ~7]77'
777j
24
22224H 22222
40,000 30,000 yP (H2) t X(H2) atple aF 20,000 ±0 ,000 0 00 300 4ooTotal pressure, P atmospieres t 500
U4
*1
T:: 4--L- t tt l--- -- - -V - p-2HHf_ T- - -- + --i A --- i I J-.A-15
FIG. 3 HENRY'S LAW CONSTANT OF N2 IN LIQUID NH3 VS. TEMPERATURE tC
50,000 40,000 0 30,000 H (N)2) (N2) 20,000 10,000 0 0 t 0 Temperature t 0C A n~- - + - --- -- - - 1- 1 tI
-~ ~ ~ ~ ~ Fi.3 ~ Sucso ~ +I IqudPhsTDt
Ref 1 daa point
Ref 1 data points and empirical
T equation
4T) J-1- A Ref 1 empirical equation
94 Ref 6 data points
u= (DCross-plot from Fig. 4
_:T Dotted lines indicate curves at
S0,200 and 400 atm, and
extra-FEE polations at 50 atm.
t. -- -T--- 41 - 4VM t 114 - Tt1l-l t:t 4T V - T +1 -7- H 30f 4q 50 4o -30 -20 -l 21 W
FIG, 4 CROSS PLOT OF HENRY' S CONSTANTS OF N2 IN LIQUID NKi3 vs 7r ATM. A-16 40, QOO 30,000 (N2) 20, Y (N 2 ) X(N 2) atm. 10 10,000 H ; I I ;1 - - -100 -r-4 4--7 :77--T -:, 200
Fig. 4 Sources of Liquid Phase Data
±Ref 1 data points
XRef 1 data points and empirical
equation
A Ref 1 empirical equations
7 Ref 6 data points
o Cross-plot from Fig. 3
Dotted portions indicated
extra-polation to 0 atm.
300 400 500
Total Pressure, P atmospheres
ACI C S) C-7 F-- 4 001 t 4 t 30 tC 7-- +++0-t 0 4 - -4, ;1 -J-1 E
lo -_1
FIG. 5 AMMONIA CONTENT OF VKPOR YNH T VS. K
3
0
ThTh~A- <'Ii 2 +sAVT Li-F 4 it -~
4<-mi m-~-~=-~-rr<--VTc~rVt TA-VTTE~jr-f7A~+jTh
-U
L-UmIPVA-VT4-VT-T4 '''-4- 'F> -~ ±±->~-i--1 t~w47~t 12 24t2t~h~ 4$ 744---ffi _Fig. 5 Sources of Vapor Phase Data
X Ref 2 data points
® Ref 2 empirical equations
o Ref 5 data points
5 Cross-plot from Fig 6
- T - ' 4-Ti
fl17~
4-t- L Li- A-745- 1~ 4>'- 44-11 4<4 Ft - I F - F 4<t 4-A4<t4<t~~i~--'- -tLi' a~ A-17 --E
4-1T 14-A S-Th P. ' '~iF Li -~ F- F--F--Or -Li~F-F- ~~--t - - -- F-4-4'--- -~T 74-'5
T VTVT t T --4<4< 1~ r -Li ---33
5. ~1 3. ( 5.3 3. £ - &i.- Th'----i -2 100 + 90-80 70 -60 50 30 ao0--Y(NH ) t atm 10 - 9-8 7' 6 5 3 2 1 +4~ 4-Li VT11I
A -x 10 4.5 tt OK 3.5 3.3 3.1 4.1 3.9 3.7 4.3 3 M--: I M_ _-4-4 _-A-18
FIG 6 CROSS-PLOT OF AMMONIA 06"TENT OF VAPOR yNH 7Tr VS. 7T ATM.
3 90 80 70 60 50 140 30 20 Y (NH 3) P atm 10 9 8 7 6 5 3, 2 1 t -- + - - -- --- -t- 4 -. -- T
Fig. 6 Sources of Vapor Phase Data
V Ref 3 and 4, data points
X Ref 2 data points
0 Ref 2 empirical equations
ORef 5 data points
o Cross-plot from Fig. 5
Total Pressure, Pt atmospheres
200 oo 6c Bo --- - --e --- -o 200 4oo 600 800 :TIT
A-19
BIBLIOGRAPHY
1. Lefrancois, B. et Vaniscotti, C., "Solubilit6 du m6lange
gazeux (N2 + H2) dans l'ammoniac liquide." Genie Chimigue,
83, 139-144, Mai 1960.
2. Lefrancois, B. et Vaniscotti, C., "Saturation en ammoniacue du melange gazeux (N2 + H2 ) en presence d'ammoniaque liquide
%2 o
a 300 et 500 kg/cm entre -70 et + 600C. Chaleur et Industrie, 419, 183-186, Juin 1960.
3. Michels, A., Skelton, G.F., and Dumoulin, E., "Gas-Liquid Phase Equilibrium in the System Ammonia-Hydrogen-Nitrogen." Physica, XVI, 831-838, December 1950.
4. Michels, A., and others, "Gas Liquid Phase Equilibrium Below
00C in the System NH3 -H2-N2 and in the System NH 3-Kr." Physica, 25, 840-848, 1959.
5. Larson, Alfred T. and Black, Charles A., "The Concentration
of Ammonia in a Compressed Mixture of Hydrogen and Nitrogen over Liquid Ammonia." Journal of American Chemical Society,
3,
1015-1020, April 1925.6. Larson, Alfred T. and Black, Charles A., "Solubility of a
Mixture of Hydrogen and Nitrogen in Liquid Ammonia." Industrial and Engineering Chemistry, 17, 715-716, July 1925.
B-1
SUPPLEMENT B
ENTHALPIES OF HYDROGEN, NITROGEN, AND AMMONIA TO 1400OF AND FROM 0 TO 200 ATMOSPHERES
I GENERAL INFORMATION
A. Introduction
The design of the ammonia cracking section as the source of chemical reflux constitutes a major step in the study of the ronothermal ammonia-hydrogen chemical exchange process for
the production of heavy water. The deuterium-enriched ammonia stream from the exchange towers is thermally cracked into
nitrogen and enriched hydrogen. Part of the resulting mixture from the cracking reactor is cooled to recover uncracked ammonia, which is recycled to the cracking reactor, and the nitrogen
and enriched hydrogen'is refluxed into the exchange towers. The accurate design of the cracking reactor and its associated heat exchangers requires enthalpy values for hydrogen, nitrogen, and ammonia throughout the temperature and pressure ranges
involved. This report presents enthalpy values for the three substances, within the ranges indicated:
Temperature Pressure
Hydrogen -260 to 1400o0F 14.7 to 6000 psia Nitrogen -6o to 1540 F 0 to 220 atm
Ammonia -100 to 14000F 0 to 3000 psia
B. Manner of Reporting
The graphs are plots of enthalpy versus temperature with pressure as the parameter. Units of enthalpy are Btu/lb-mole of substance.
The non-uniformity of pressure units is due to the manner in which the original data are reported. Hydrogen
B-2 and ammonia enthalpies were available mostly in psia, while nitrogen enthalpies were in atmospheres. Since interpolating between pressures is not so difficult, no attempt was made to cross-plot enthalpy versus pressure. And likewise, no attempt was made to report all three stbstances in uniform pressure units.
To facilitate the use of the graphs, enthalpies of all three substances are reported using the same basis: zero for free elements at .0 K and 0 pressure. For hydrogen and nitrogen this poses no problem. But for ammonia, enthalpy at 00K and
0 pressure is not zero, but rather the heat of formation of
ammonia at 00K and Opressure (-16,860 BTU/lb-mole). All other ammonia values are transposed to conform to the enthalpy at
0
0 K and 0 pressure. Numerical calculations are included in
the section under ammonia.
With all the data on one basis, one can now calculate the heat involved in the cracking reaction at any temperature and pressure by a simple enthalpy balance, without accounting
separately for the heat of reaction.
C. Use of the Graphs
To calculate the heat of the cracking reaction, it is necessary to know the equilibrium content at any temperature and pressure. MIT-D8 (1) is available for this purpose. It
reports equilibrium ammonia mole fraction YNH3 versus temperature OF with pressure as a parameter.
Consider one mole of ammonia at a given temperature and pressure being cracked according to the reaction.
B-3
NH3 (g) - H2 (g) + ,2 N2 (g)
(1-x)moles (3x)moles
Let x be the number of moles cracked per mole of starting ammonia. Total number of moles at any instant is (1+x)moles.
Now, relate conversion x and the ammonia mole fraction YNH .The equilibrium or mintrum (in the case of cracking)
3
value of YNH is reported in MIT-D8.
3
YNH 3 x 1-x 1+x 1+YNHTherefore, in terms of YNH , and based on one mole of starting ammonia, the change in the number of moles of each substance because of the ammonia cracking is:
Ammonia: decrease Hydrogen: increase Nitrogen: increase 1-Y x= 1+YN 3 moles 1+ 3
per mole starting ammonia,
3 3 m-NH3
3x
= 3 moles per mole starting ammonia, 6+YNH3
1 1 3-Y
x = 1 1+Y moles per mole starting ammonia, N3
or
Let i represent enthalpy, with the subscript indicating the substance involved. At any given temperature and pressure, enthalpy values are fixed and are easily read off the graphs in this report. Thus, heat of cracking at that temperature and pressure may be expressed as a function of the exit ammonia mole fraction Y . Note that because the cracking reaction
3
is endothermic, Q attains its maximum value when the maximum amount of ammonia is cracked, that is when YNH attains its
3
equilibrium value, as reported in MIT-D8.1-Y 1-1-YNH NH ~NH Q__3_ 1+YNH H
+ 1
3 i 3 N 2 2 1+YN N2 1+Y NHN3
2NH3
3
H
3
1-Y+ +
}iN
~ Btu per mole startingNH iH2 2 3J ammonia.
3
The graphs included in this report may also be used for ammonia synthesis calculations. In fact, as long as one is concerned only with changes in enthalpy, and as long as one
is aware of the manner in which these graphs have been obtained, these graphs may prove useful, even for studies that have
nothing to do at all with ammonia synthesis or cracking. B-4
B-5
II HYDROGEN ENTHALPIES
A. Preparation of Curves
The graphs of hydrogen enthalpies have been obtained through private correspondence with Howard K. Rae of the Atomic Energy of Canada, Ltd. (2). Rae stated that the graphs are not too well documented but confirmed that they are adequate for preliminary calculations.
Another source, NBS Circula 564 (3), is available for hydrogen enthalpies, but the temperature range extends only
.rom
60K
(-3520F) to 6000K (6200F). This NBS source isundoubtedly the more reliable of the two; but beyond 6200F, the only source available is the Canadian graphs. It becomes expedient, therefore, to compare the two sources for temperatures below 6200F.
Comparison between the two sources is summarized in
Table 1, where the deviation indicated is based on the NBS value.
All enthalpies are in Btu/lb-mol of hydrogen, with base zero
at 0K and 0 pressure.
From Table 1, the deviation between the two sources does not exceed 28.0 Btu/lb-mole between -100 and 6200F. So as to provide consistency, therefore, up to 14000F, the
Canadian graphs are accepted as the main source of data, being more extensive and reasonably accurate. This move eliminates
the need for replotting the NBS data up to 620OF and then
adjusting the curves at that temperature to coincide with the rest of the Canadian curves.
One slight observation must be added here. The NBS circular reports some curves crossing over one another between
B-6
Table 1
Comparison of Hydrogen Enthalpies from Canadian Graphs and from NBS Circular 564
P latm 620OF (6000K) 4400F (5000K) 2600F (4000K) 80'F (3000K) -1000 F (200K) 7410. 7438.0. -28.0
6150
6177.2 --27.2 4908 4919.0 -11.0 3670 3668.1 +1.9 2430 2452.2 -22.2 :Can: :NBS: :Dev: :Can: :NBS: :Dev: :Can: :NBS: :Dev: :Can: :NBS: :Dev: :Can: :NBS: :Dev: tAll Enthalpies in Btu/lb-mole
100 atm
7485
7506.4
-21.4 6220 6240.9 -20.9 4965 4974.7 -19.7 3712 3709.1 +2.9 2445 2461.4 -16.4B-7
-280 0F and -1000. This indicates that somewhere in this range,
the Joule-Thompson coefficient vanishes. In the Canadian graphs, however, there is no crossing of curves at all. In using the Canadian graphs below -1000F, one should therefore, be wary
of any possible error. Fortunately, all calculations in the design of the ammonia cracking section involve only temperatures above -100 F.
FIG. 1-1.
ENTHALPY OF HYDROGEN
lst Graph -300 to 560OF
BASE,
IDEAL GAS AT-459.69*
3 2800 270 2600 2407 -4 44
a--4
47 4600-4 5 0 -1 1 4eoL4 2300---f!- 4300 ttw 1w 42W- it ge A100 41007 MY 0 i -120* 4v QW!, w 2000 Aur 1 4000 'T' r , 19 3900 VAT ji j f, f It 1/1--k-1 1800-" if 58 ;7. . FT t .0* 1700- 3MO 5700---: 16 3 5600-1 j T -7 3500 55 i 00 34W 3 53W. Tr' 1200- 3200 ;Jf 52 40* 1100 5100-2W t 100(>-± -260 Mo_- 'E- 4 5000**o
4900 00-0-61 72TH
ENTHALPY
UTO1L HEAT)OF
HYDROGEN
Btu/lb-mol G-601.31' B-8 7 G GR PAGE I OF 2 70004 2~oo 68K
-6700- ,t 4t 40 r4 44A
89800-
t
FIG.1-2. **0
ENTHALPY OF
HYDROGEN a0oo 0Io
850,50a-4 84 0.0,400-8300 ~ 10,300-8100 000
* !//lo9
0loo- 80 :0 10 ... o - Y 1, 9a o 77-0 - 7"-**-~ ** * *~ *L 'IjENTHAL-PY
(TOTAL HEAT)HYDROGEN
27 '0. 12A00--1140* 1200--00 1360-23oo I* **- 2,90- 0-- 71090- 12,30- 2P10-IDEAL GAS AT -459.69* F 2nd Graph 560 to 1400OF .4 G-6011.31 PAGE 2 M/13201 100, mw B-9*
*1
G-60L.B-10 III NITROGEN ENTHALPIES
A. Source of Information
The nitrogen graphs are based entirely on NBS Circular 564 (3) Table 7-4. This time, reported data spans all the way from -280 to 4940 0F and 0.01 to 100 atmospheres. The temperature
range is certainly adequate. To extend the pressure range up to 200 atmospheres, extrapolations were necessary; and the details involved in such operations are explained in section B of this chapter.
Table 7-4 of NBS 564 reported nitrogen enthalpies as (H-Eoo)/(RTo) where Eoo is the internal energy of the ideal gas at absolute zero, R is the universal gas constant, and To is 491.6880R (as 273.160K). Transforming the enthalpies to Btu/lb-mole of nitrogen became a matter of multiplying all the
NBS data by the constant factor RTo, since the basis was already the same; namely, ideal gas at absolute zero. Here, RTo was taken to be 976.984 Btu/lb-mole.
Table 2 of this report gives nitrogen enthalpies in Btu/lb-mole from -640F to 1700F at the NBS pressures: 0.01 atm, 10 atm, 40 atm, 70 atm, and 100 atm.
B-11 Table 2
Values of Nitrogen Enthalpies Based on Absolute Zero Temperature Nitrogen Enthalpies, Btu/lb-mole Pressure: t0F -64 -46 -28 -10 + 8 26 44 62 80 98 116 134 152 170 188 206 224 242 260 278 296 314 332 350 368 386 404 422 440 458 476 494 512 530 548 566 584 602 0.01 atm 2750.8 2876.1 3001.4 3126.5 3251.8 3377.0 3482.6 3627.5 3752.8 3878.1 4003.5 4128.8 4254.2 4379.6 4505.2 4630.7 4756.2 4882.0 5007.7 5133.7 5259.6 5385.7 5511.9 5638.3 5764.7 5891.3 6018.1 6145.1 6272.2 6399.6 6527.1 6654.9 6782.9 6911.1 7039.5 7168.1 7297.0 7426.1 10 atm 2701.9 2831.0 2959.7 3088.0 3216.0 3343.9 3471.5 3598.9 3726.2 3853.4 3980.4 4107.3 4234.1 4360.9 4487.8 4614.6 4741.3 4868.1 4994.8 5121.7 5248.6 5375.6 5502.5 5629.7 5756.9 5884.2 6011.7 6139.3 6266.8 6394.8 6522.8 6651.1 6779.5 6908.2 7037.0 7166.2 7295.4 7425.0 40 atm 2553.1 2695.2 2835.4 2973.8 3110.4 3246.7 3381.7 3515.8 3649.1 3781.9 3914.1 4045.7 4177.1 4308.0
4438.6
4569.14698.9
4828.9 4958.8 5088.4 5217.95347.4
5476.7 5606.1 5735.45864.6
5994.0
6123.5 6252.9 6382.6 6512.26642.0
6772.0 6902.1 7032.2 7162.7 7293.2 7424.0 70 atm 2407 2564 2716 2865 3010 3155 3297 3438 3578 3715 38523989
4125 4259.74393.9
4527.64660.9
4793.9 4926.5 5058.8 5190.8 5322.8 5454.2 5585.7 5716.9 5848.2 5979.3 6110.6 6241.8 6373.0 6504.16635.4
6766.8
6898.2 7029.7 7161.4 7293.1 7425.1 100 atm 2267 2442 2609 2765 2911 3068 3222 3369 3513 3657 3799 3939 4078 4217 4354 4491 4627 4763 4898 5032 5167.5 5301.7 5435.1 5568.5 5701.5 5834.6 5967.6 6100.4 6233.1 6365.9 6498.4 6631.2 6763.7 6896.4 7029.1 7162.0 7294.7 7428.2B-12 t0F 620 638 656 674 692 710 728 746 764 782 800 818 836 854 872 890 908 926 944 980 1160 1340 1520 1700
0.01
7555.5
7685.1
7815.1
7945.3
8075.88206.5
8337.5
8468.8
8600.4 8732.28864.4
8996.9
9129.5 9262.69395.9
9529.5 9663.3 9797.6 9932.0 1o,066.8 10,202.0 11,568.4 12,962.0 14,380.5 15,821.2 70 10 7555.1 7685.17815.4
7946.0
8076.8 8207.8 8339.28470.8
8602.68734.8
8867.3
9000.1 9132.9 9266.39399.9
9533.7
9667.7
9802.3 9936.9 10,071.9 10,207.2 11,575.5 12,970.4 14,390.0 15,831.67555.2
7686.3
7817.87949.4
8081.2-8213.2 8345.5 8478.0 861o.78743.7
8877.0
9010.4 9144.2 9278.3 9412.5 9547.1 9681.9 9816.9 9952.2 10,087.9 10,223.8 11,597.3 12,996.3 14,419.1 15,863.27557.4
7689.5
7821.97954.6
8087.2 8220.18353.4
8486.8 8620.4 8754.1 8888.3 9022.4 9157.0 9291.7 9426.6 9561.8 9697.2 9833.1 9968.9 10,105.1 10,241.6 11,620.0 13,022.8 14,448.7 15,895.2 100 7561.2 7694.3 7827.7 7961.3 8095.0 8228.7 8362.7 8496.9 8631.3 8765.9 8900.6 9035.5 9170.7 9306.2 9441.8 9577.7 9713.7 9850.0 9986.5 10,123.3 10,260.2. 11,643.4 13,o49.9 14,478.6 15,927.7B-13
B. Extrapolation to Higher Pressures
Since the reported NBS pressures were 10, 40, 70, and
100 atmospheres, it became possible to extrapolate beyond
100 atm at regular intervals of 30 atm by the method of second
differences. It was assumed that extrapolations up to 220 atm could be made without incurring significant errors. Furthermore, poltting the values would diminish any effect due to slight
errors in extrapolating. As such, extrapolated enthalpies are taken at 130, 160, 190, and 200 atmospheres.
As an illustration, consider values at 4220F, shown
in Table 3.
Table 3
Extrapolation to Higher Pressures at 4220F.
An Illustration of the Method of Second Differences
Average
Enthalpy First Second of Second
Pressure Btu/lb-m Difference Difference Differences
10 atm 6139.3 -15.8 40 atm 6123.5 -2.9 -12.9 -2.8 70 atm 6110.6 -2.7 -10.2 100 atm 6100.4
-7.4
130 atm 6093.0-4.6
160 atm 6088.4-1.8
190 atm 6086.6 +1.0 220 atm 6087.6B-14 The upper part of Table 3, using data from Table 2, should be self-explanatory. The average of second differences (in the case, 2.8) is then successively applied to the first differences to establish a continuous trend. Thus, the first difference between 100 atm and 130 atm is determined to be 2.8 Btu/lb-mole lower than the first difference between 70 atm and
100 atm. And so on, with succeeding extrapolations. Once the
first differences have been fixed, the actual enthalpy values can be obtained by successive algebraic application of these first differences to the immediately preceding enthalpy.
Now, between 190 and 220 atm, the first difference
reverses sign. This indicates that at 4220F between 0 and 190 atm, an increasing pressure causes a decreasing enthalpy effect;
whereas above 220 atm, the opposite is true. The reversing trend is associated with a vanishing Joule-Thomson coefficient at 4220F between 190 and 220 atmospheres. For different
temperatures, this coefficient vanishes at a different pressure. The pressure lines, therefore, on an enthalpy versus temperature graph are not concurrent, but rather, two pressure lines have a unique intersection. The 3rd Graph for nitrogen included here sonewhat illustrates this concept, although not very clearly because of scale limitations.
Table 4 shows the extrapolated nitrogen enthalpies
B-15
Table 4
Nitrogen Enthalpies Extrapolated for Higher Pressures Nitrogen Enthalpies Btu/lb-mole
Pressure t0F -64 -46 -28 -10 + 8 26 44 62 80 98 116 134 152 170 188 206 224 242 260 278 296 314 332 350
368
386 404 422 440 458 476 494 512 530 548566
584 602 130 atm 2131 2327 2512 2672 2815 2986 3154 3308 3454 3607 3753 3895 4036 190 atm 160 atm 2000 2219 2424 2585 2722 2909 3094 3255 3401 3564 3713 3856 3999 4147 4288 4431 4572 4694 4852 4988 5132.0 5270.3 5407.1 5543.7 5679.7 5816.4 5953.2 6088.4 6223.5 6359-.5 6494.2 6630.0 6764.1 6898.8 7034.2 7169.2 7303.6 7440.44834
4971 5119.8 5260.0 5398.2 5536.15673.3
5811.8 5950.56086.6
6222.6 6360.16495.7
6633.0
6767.6
6903.0
7039.9
7175.8
7310.97449.5
220 atm 1751 2023 2271 24312544
2771 2976 31733313
3503
3653
3797
3940 4097 42404389
4533
4641 4820 4957 5111.3 5253.3 5392.7 5531.7 5669.9 5810.2 5950.8 6087.6 6224.1 6363.4 6499.6 6638.4 6773.3 6909.2 7047.7 7184.4 7320.1 7460.61873
2117 2343 2505 2631 2838 3041 32103354
3530
3680
3824
3967
4119 4262 44084550
4666 4179 4319 44594597
47264873
5008 5147.9 5284.25419.4
5554.5
5689.1
5824.05958.9
6093.0
6227.0 6361.4 6495.1-6629.4 6762.86896.6
7030.6 7164.6 7298.27433.3
Nitroizen EnthalDiesB-16 t F 620 638 656 674 692 710 728 746 764 782 800 818 836 854 872 890 908 926 .944 962 980 160 1340 1520 1700 130
7567.0
7700.9 7835.27969.6
8104.58238.9
8373.5
8508.48643.9
8779.1 8914.6 9050.0 9185.6 9321.99458.3
9594.8 9731.4 9868.1 10,005.3 10,142.6 10,279.8 11,667.613,077.6
14,508.9 15,960.6 16o7574.8
7709.3 7844.47979.5
8115.7 8250.78385.8
8521.3 8658.28793.7
8930.09065.9
9201.79338.8
9476.1 9613.1 9750.3 9887.4 10,025.3 10,163.0 10,300.4 11,692.6 13,105.9 14,539.6 15,993.9 1907584.6
7719.57855.3
7991.0 8128.6 8264.18399.6
8535.6
8674.2 8809.78946.8
9083.2 9219.09356.9
9495.2 9632.6 9770.4 9907.9 10,046.5 10,184.5 10,322.0 11,718.4 13,134.8 14,570.7 16,027.6 2207596.4
7731.5 7867.9 8004.1 8143.2 8279.1. 8414.9 8551.3 8691.9 8827.1 8965.0 9101.9 9237.5 9376.2 9515.69653.3
9791.7 9929.6 10,068.9 10,207.1 10,344.6 11,745.0 13,164.3 14,602.2 16,061.7B-17
C. Preparation and Use of the Nitrogen Graphs
The enthalpy values from Tables 2 and 4 are plotted, allowing the same degree of accuracy as the Canadian hydrogen
curves; that is, four significant figures. Six graphs are constructed to cover the temperature range from -80 to 1560 F.
To facilitate the use of the curves, here is an index of the enthalpy and temperature ranges of each graph:
Temperature Range Enthalpy Range
0oF Btu/lb-m First Graph -80 to 200 1800 to 4000 Second Graph 100 to 420 4000 to 6000 Third Graph 400 to 720 6000 to 8200 Fourth Graph 700 to 980 8200 to 10,200 Fifth Graph 960 to 1280 10,200 to 12,400 Sixth Graph 1240 to 1560 12,400 to 14,600
Linear interpolation between pressures is accurate enough for all practical purposes. If greater accuracy is desired, interpolations should be applied to the values of Tables 2 and
4,
instead of to the graphs.Note that in the third Graph, the 0.01 atm, 100 atm, and 220 atmosphere lines cross one another because of the
vanishing Joule-Thomson coefficient. The intersection temperatures have been determined to be around:
4700F for the 100 and 200 atm lines; 5400F for the 0.01 and 200 atm lines; and 590 F for the 0.01 and 100 atm lines.
Scale limitations prohibit more precise plotting in this region.
3d ta-sw -. ge a malt f l Co I HL m m. ... vhf --H -i 441+H H -IE HE 4H-L4; EI -L4- -1114'F+ -f.r -n Am 44 VU71 2 aF +H±-# il 14$f f q 44 4V
-I-
-4
4
4-1 4f 4 SR 1FIG. 1- . ENTHALPY OF NITROGEN i2 GM n 3 0 L -a7 -- 20 -I,'- j _-- 61 ' '4 [74 4i TI-' 111+17-T'r 4trn~ilmIrLffiWUIzAt-2 -
4:
4F-~-iBiT7-L3IJ 1 - T -4' ---7 - 4-iti -2 - ; A "TF; --p :r ttTt T'ELI -4 q 4"
ThETm -T tr -T T ll t r -+TRTff
%q T7 Tj
T I - t I --- 1 71 ;-, & ' ?1 14 -, 1, -- .44 P I-t 1442 -n- T,+H M! -F I H1 F- f 'I-;. 4 IT T- I-rn-I I~#I 2 T. Itt 1 -I-I~~-1I~4I 444~ ~, 9*t~ LLl~tP~~l~lA4I-1444- ~--~s~-w--,---~ TI1L~44~4IPiI
-4
4 4 ± a 041 11H _t7f MIAS
B-22 FF7 -t -P4 H±H7 T _VH4 FFF yr ST TI:m7 --i Tm 7-; ++ 01 H tF-Fl~t'A
II
80 Tfl +H E 3 -i , IT -E -+u 4 T ftH jE T4, ilR ±L t ## T+k TET ---M f- I 7t + TT ITT, t +1 Lift" i6 7 t " T It -T74 ff -I 1- I T Tj_ .-T_ -1 t -F '7 fig -1 ffl+ +fi+ +H+ -H-f± +H4 J+H 4+f4 -4* TFR44-444 4-H+.... ;4###flg ... 1 - ---gj-z EE +4-H Ifif +H+ 4+4+ t 44 4w 4++ttam -J-HL iffL H±L +H± -HE HMO## 4+H * t: -T +l t t T + 14 t---f T . ... . ..... .. . ... ... ... -44++ ta4 r*+H H rH H H rfE+t+ [F1tH 44-77- '4 -2 rn-PI
--if 'P -if 4-p 1 -,"7 t7, 7M7 - + i Rr" it t Ll tB-23
FIG. 1-.ENTH LPY OF NITROGEN
4T-T
n T-
.t IT, 711 p9+4-7-T
- N- -- UR--ix i VB-24
AMMONIA ENTHALPIES
A. List of Correlated Data
The pieces of information used to prepare the ammonia enthalpy graphs are the following:
1. Heat of formation of ammonia at absolute zero
temperature and enthalpy of ammonia gas at zero pressure at 2980K relative to 00K, needed to transpose all enthalpies to
the chosen basis of ideal hydrogen and nitrogen gas at 0K from Lewis and Randall (4)
2. Specific heat of ammonia gas at zero pressure as a function of temperature for a wide temperature range; from Tsoiman (5)
3. Saturated and superheated ammonia tables, from refrigeration handbook (6)
4. Graphically determined ammonia enthalpy values
from -100 to 7000F and from 0 to 1600 psia; from Grahl (7) 5. Beattie-Bridgeman equation of state; from Wolley, et al, (8) and original Beattie and Lawrence data (9)
The final results are given on eleven large-scale
graphs spanning from -1000F to 14000F, the scale of coordinates of the graphs being similar to the hydrogen and nitrogen curves. The shades of disagreements and discontinuities caused by the
use of so many data sources are more than offset by the difficulty of plotting and reading more accurately than + 5 Btu/lb-mol.
Liquid enthalpies are no longer plotted but may be obtained easily from tabulated values included here.
B. Transposing Data to Report Basis
The term report basis refers to zero enthalpy level taken for this report----diatomic hydrogen and nitrogen gas
B-25
at absolute zero temperature and zero pressure. Lewis and Randall (4) gave the heat of formation of ammonia at zero pressure and absolute zero temperature as -9.37 kcal/g-mole. This figure therefore became the enthalpy of ammonia gas at zero pressure and zero absolute temperature relative to the report basis. Thus, in report notation,
0
(iNH ) = 9.37 Kcal/g-mole or -16,860
Btu/lb-mole.-3 0
For this chapter of the report, the notation NH3 will be dropped so that i = -16,860 Btu/lb-mole, with the subscript
representing absolute temperature and the superscript zero pressure. This figure now serves as the basis for correlating all ammonia sources.
Lewis and Randall (4) also gave enthalpy of ammonia at zero pressure at 2980K relative to 0K as +2.37 kcal/g-mole. Therefore:
0 = -9.37 + 2.37 = -7.00 kcal/g-mole or 2980K
-12,600 Btu/lb-mole.
Similarly, if enthalpies relative to either i0 or
1 0 are available, they can be transposed to the report basis. 2980K
As a matter of convenience, the units of the subscripts and the superscripts are dropped when the temperature is in
0F and the pressure in psia, since these are the common units
used for ammonia data. Thus, i is the enthalpy of ammonia at 0 psia and 77 0F. The symbols 0 and o are used here
inter-changeably so that i 177 is the same as i.