HAL Id: hal-01904326
https://hal.archives-ouvertes.fr/hal-01904326
Submitted on 24 Oct 2018
HAL is a multi-disciplinary open access
archive for the deposit and dissemination of
sci-entific research documents, whether they are
pub-lished or not. The documents may come from
teaching and research institutions in France or
abroad, or from public or private research centers.
L’archive ouverte pluridisciplinaire HAL, est
destinée au dépôt et à la diffusion de documents
scientifiques de niveau recherche, publiés ou non,
émanant des établissements d’enseignement et de
recherche français ou étrangers, des laboratoires
publics ou privés.
Sensitive Redox Speciation of Iron, Neptunium, and
Plutonium by Capillary Electrophoresis Hyphenated to
Inductively Coupled Plasma Sector Field Mass
Spectrometry
Carl-Heinrich Graser, Nidhu Lal Banik, Kerstin Anne Bender, Markus Lagos,
Christian Michael Marquardt, Remi Marsac, Vanessa Montoya, Horst Geckeis
To cite this version:
Carl-Heinrich Graser, Nidhu Lal Banik, Kerstin Anne Bender, Markus Lagos, Christian Michael
Marquardt, et al..
Sensitive Redox Speciation of Iron, Neptunium, and Plutonium by
Cap-illary Electrophoresis Hyphenated to Inductively Coupled Plasma Sector Field Mass
Spectrom-etry.
Analytical Chemistry, American Chemical Society, 2015, 87 (19), pp.9786 - 9794.
�10.1021/acs.analchem.5b02051�. �hal-01904326�
Analytical Chemistry is published by the American Chemical Society. 1155 Sixteenth Street N.W., Washington, DC 20036
Published by American Chemical Society. Copyright © American Chemical Society. However, no copyright claim is made to original U.S. Government works, or works
Article
Sensitive Redox Speciation of Iron, Neptunium and
Plutonium by Capillary Electrophoresis hyphenated to
Inductively Coupled Plasma Sector Field Mass Spectrometry
Carl-Heinrich Graser, Nidhu lal Banik, Kerstin Anne Bender, Markus Lagos,
Christian Michael Marquardt, Rémi Marsac, Vanessa Montoya, and Horst Geckeis
Anal. Chem., Just Accepted Manuscript • DOI: 10.1021/acs.analchem.5b02051 • Publication Date (Web): 03 Sep 2015
Downloaded from http://pubs.acs.org on September 3, 2015
Just Accepted
“Just Accepted” manuscripts have been peer-reviewed and accepted for publication. They are posted online prior to technical editing, formatting for publication and author proofing. The American Chemical Society provides “Just Accepted” as a free service to the research community to expedite the dissemination of scientific material as soon as possible after acceptance. “Just Accepted” manuscripts appear in full in PDF format accompanied by an HTML abstract. “Just Accepted” manuscripts have been fully peer reviewed, but should not be considered the official version of record. They are accessible to all readers and citable by the Digital Object Identifier (DOI®). “Just Accepted” is an optional service offered to authors. Therefore, the “Just Accepted” Web site may not include all articles that will be published in the journal. After a manuscript is technically edited and formatted, it will be removed from the “Just Accepted” Web site and published as an ASAP article. Note that technical editing may introduce minor changes to the manuscript text and/or graphics which could affect content, and all legal disclaimers and ethical guidelines that apply to the journal pertain. ACS cannot be held responsible for errors or consequences arising from the use of information contained in these “Just Accepted” manuscripts.
Sensitive Redox Speciation of Iron, Neptunium and Plutonium
by Capillary Electrophoresis hyphenated to Inductively
Cou-pled Plasma Sector Field Mass Spectrometry.
Carl-Heinrich Graser*, Nidhu lal Banik, Kerstin Anne Bender, Markus Lagos, Christian Michael
Mar-quardt, Rémi Marsac, Vanessa Montoya and Horst Geckeis
E-mail: graser@kit.edu
Institute for Nuclear Waste Disposal, Karlsruhe Institute of Technology, P.O. Box 3640, D-76021 Karlsruhe, Germany
ABSTRACT: The long-term safety assessment for nuclear waste repositories requires a detailed understanding of actinide
(geo)chemistry. Advanced analytical tools are required to gain insight into actinide speciation in a given system. The geochemical conditions in the vicinity of a nuclear repository control the redox state of radionuclides which in turn has strong impact on their mobility. Besides the long-lived radionuclides plutonium (Pu) and neptunium (Np), which are key elements in high level nuclear waste, iron (Fe) represents a main component in natural systems controlling redox related geochemical processes. Measuring the oxidation state distribution for redox sensitive radionuclides and other metal ions is challenging at trace concentrations below the detection limit of most available spectroscopic methods (≥10-6 M). Consequently ultrasensitive new analytical techniques are re-quired. Capillary electrophoresis (CE) is a suitable separation method for metal cations. CE hyphenated to inductively coupled plasma sector field mass spectrometry (CE-ICP-SF-MS) was used to measure the redox speciation of Pu (III, IV, V, VI), Np (IV, V, VI) and Fe (II, III) at concentrations lower than 10-7 M. CE coupling and separation parameters such as sample gas pressure, make up flow rate, capillary position, auxiliary gas flow, as well as the electrolyte system were optimized to obtain the maximum sensi-tivity. We obtain detection limits of 10-12 M for Np and Pu. The various oxidation state species of Pu and Np in different samples were separated by application of an acetate based electrolyte system. The separation of Fe (II) and Fe (III) was investigated using different organic complexing ligands, EDTA and o-phenanthroline. For the Fe redox system, a limit of detection of 10-8 M was calculated. By applying this analytical system to sorption studies we were able to underline previously published results for the sorption behavior of Np in highly diluted concentrations and we monitored the time dependent reduction of Pu(VI) by Fe(II). This study clearly shows that CE-ICP-SF-MS is a suitable separation method for the redox states of Pu, Np and Fe.
INTRODUCTION
Neptunium and plutonium are two key elements to be con-sidered in long-term safety assessment of nuclear waste dis-posal due to their alpha radiotoxicity and long half-lives. In case of water intrusion into a repository, these elements might dissolve and become mobile depending on the chemi-cal/geochemical conditions. The oxidation state of these ele-ments strongly impacts their chemical behavior, e.g. solubility, hydrolysis, complexation by dissolved ligands1 and sorption to mineral surfaces,2,3 which in turn determines their mobility and bioavailability in natural systems. The redox chemistry of the actinide elements, especially Pu is very complex.4 Some of the redox reactions are kinetically slow. Because of the similar redox potentials in 1 M HClO4 for Pu (III)/(IV) (+ 1.01V), Pu
(IV/V) (+ 1.04V) and Pu (V/VI) (+ 1.02V), four Pu redox species (Pu(III) to Pu(VI)) can coexist in solution. Neptunium most commonly occurs in the tetra- and pentavalent state Np(IV) and Np(V) in aqueous solution.5
Redox conditions in a mined repository are determined by the absence of oxygen in deep underground and by the pres-ence of reducing agents such as e.g. Fe(II) or S2- either dis-solved in groundwater or bound to minerals in the natural host rock. The iron containers, where spent nuclear fuel and other nuclear waste forms are stored represent another strong redox buffer, when in contact with water and corroding under
anaer-obic conditions forming hydrogen and Fe(II) containing sec-ondary oxi-hydroxide phases. Fe(II)/Fe(III), thus, represents an important redox couple which influences or even dominates ground- and porewater redox states in a repository near field. Due to its high solubility under circumneutral conditions Fe(II) can be present at significant concentration levels in aqueous solution, while Fe(III) is not very soluble, has a pref-erence for extensive hydrolysis and thus is found predominant-ly in the solid phase.6
A suitable method for redox speciation analysis has to pro-vide two properties. First, it must not alter the redox speciation for the element of interest in the original solution. Second, the method must have a high detection sensitivity because of the very low analyte concentrations expected in natural samples. Spectroscopic techniques such as UV-Vis/NIR- or X-Ray absorption spectroscopy (XAS) are non-invasive methods, which allow in principle, the determination of the redox speci-ation of some elements. However the detection limits of UV-Vis/NIR for Pu and Np species defined by both the molar absorption coefficient and the possibility of spectral overlap lies at > 10-4 M. Laser based optical spectroscopy methods are described to cover concentration ranges for some Pu-species down to ~10-6 M.7 XAS is also unsuitable because it requires as well rather high actinide concentration levels (> 10-5 M). Established invasive redox analysis methods exist, where actinides in their individual oxidation states are separated by 1 2 3 4 5 6 7 8 9 10 11 12 13 14 15 16 17 18 19 20 21 22 23 24 25 26 27 28 29 30 31 32 33 34 35 36 37 38 39 40 41 42 43 44 45 46 47 48 49 50 51 52 53 54 55 56 57 58 59 60
solvent extraction,8 ion exchange9 or coprecipitation10. Those methods take advantage of very sensitive nuclear spectroscopy counting techniques such as -spectroscopy and liquid scintil-lation counting (LSC). A major drawback is that they may change redox equilibria because of acidification of the sample, the introduction of strongly complexing agents or chemical impurities, and due to the comparatively long duration of separation procedures. Coupling capillary electrophoresis (CE) with inductively coupled plasma mass spectrometry (ICP-MS) has been proposed as a promising alternative. The coupling of CE with sector field mass spectrometry has also been de-scribed before.11-17
Analyte separation by CE takes place in an electric field in-side a fused silica capillary without a stationary phase, and with a sample volume in the nanoliter range. This leads to minimal contact of the analytes with any kind of surface. The electroosmosic flow (EOF) - a phenomenon generated by the capillary wall - develops a flat flow profile. This phenomenon occurs because of the accumulation of electrolyte cations at the negatively polarized capillary wall. When an electrical field is applied, the solvated cations carry the bulk solution towards the negatively charged cathode. This leads to sharper peaks and enhanced resolution of the separation as compared to pump driven techniques like chromatographic techniques, which usually develop a parabolic flow profile. Also, typical capillary electrolytes are low-conductivity buffer solutions. This provides a certain possibility to adjust conditions close to those of the initial sample matrix by adding pH-buffers and correct for ionic strength. Parameters can be furthermore op-timized as to allow for rapid separations within a few minutes. All together this method provides less chemical alteration of the primary species composition as there is almost no sample pretreatment required, it offers highly resolved separation, and requires very small sample volumes. Analyte detection is achieved by hyphenating CE to a mass spectrometer. Induc-tively coupled plasma mass spectrometry is predestined for the rapid quantification of metal ions in the sharp elution bands of CE. Coupling requires the selection of dedicated nebulizer systems which can cope with the small sample volumes pro-vided by CE. Detection sensitivity can be variable depending on the type of mass spectrometer and is clearly enhanced for sector field mass instruments (ICP-SF-MS). This type of in-strument also allows measurements at higher mass resolution (m/Δm up to 10’000), which reduces issues caused by spectral interferences. This is of particular importance for the accurate determination of Fe, which is interfered by ArO+ or CaO+ clusters in the plasma.
In our study we applied hyphenation of CE with an ICP-SF-MS to optimize Pu (III-VI), Np (IV-VI), and Fe (II-III) analy-sis. Subsequently, the method was applied to study the redox speciation of Np in an aqueous clay mineral suspension and to investigate the reaction of Pu(VI) with Fe(II) in homogeneous acidic solution under anaerobic conditions.
MATERIALS AND METHODS
All chemicals except the actinide stock solutions are of p.a. quality or better and were obtained from Merck (Darmstadt, Germany) or Riedel de Haen (Seelze, Germany). Solutions were prepared with “MilliQ” water (specific resistivity, 18.2 MΩ cm-1
). EDTA and o-phenanthroline were obtained from Sigma-Aldrich, Germany. All solutions used in redox analysis measurements were degassed by several freeze-pump-thaw
cycles.18 We used quadrupole ICP-MS (Perkin-Elmer, Elan 6100) for analysis of metal ion total concentration in solution and liquid scintillation counting (LSC; Tri-Carb, Packard Instruments Co., USA; LSC cocktail: Ultima Gold XR, Pack-ard Instruments Co., USA) for 238/242Pu and 237Np activity determination. LSC data for 237Np-activities were corrected for the activity of the daughter nuclide 233Pa by applying α/β dis-crimination employing the pulse decay analysis (PDA) tech-nique. The outcome of CE-ICP-MS analysis was compared with Pu and Np redox characterization applying the liq-uid/liquid extraction (LLE) scheme according to Nitsche et al.19. After acidification with 1 M HCl to pH=1, an aliquot (300 µL) of the particular aqueous sample solution was con-tacted with 400 µL of phenylmethylbenzolylpyrazalone (PMBP) dissolved in xylene (6.96 g/L), and 400 µL of Bis-(2-ethylhexyl)phosphoric acid (HDEHP) dissolved in toluene (161.22 g/L), respectively. Under those conditions Np(IV)/Pu(IV) are extracted by PMBP and Np(IV)/Pu(IV) and Pu(VI) by HDEHP into the organic phases. A second aliquot was in addition oxidized by 0.02 M K2Cr2O7 in order to
trans-fer Pu(III, IV, V, VI) to the HDEHP phase and Pu(III, IV) to PMBP. This is done to determine the contents of Pu(III) and colloidal Pu(IV) species. The mixtures were stirred for 10 minutes and then centrifuged for another 10 minutes at 4000 rounds per minute. After phase separation activity distribution between organic and aqueous phase was measured by LSC.
PLUTONIUM STOCK SOLUTION Solutions of Pu(III),
Pu(IV), Pu(V) and Pu(VI) were prepared from laboratory stock solutions of either 242Pu or 238Pu. The stock solutions were prepared by dissolution of solid PuO2 by 7 M HNO3 with
subsequent purification of the solution by anion chromatog-raphy.20 The preparation of Pu3+ was achieved by reduction of the stock solution with Rongalite (hydroxy-methanesulfanile acid, Na+OCH2SO2).
21
The Rongalite solution was freshly prepared before every reduction step. PuO2
2+
was prepared by fuming the stock solution in 1 M HClO4 and subsequent
disso-lution in 1 M HClO4. This procedure was repeated four times
and the final dissolution step was carried out in 0.1 M HClO4.
Tetravalent Pu was prepared chemically by oxidizing Pu3+ in acetic acid (HAc) at pH 2.4, without a holding reductant, under aerobic conditions for 6 weeks. The pentavalent pluto-nium oxidation state was prepared electrochemically by the reduction of Pu(VI) in dilute HClO4 at a potential of 0.3 V (vs.
SHE). Each solution was checked by UV-Vis/NIR and LLE to determine if the desired oxidation state was present. The final Pu concentration was checked by ICP-MS.
NEPTUNIUM STOCK SOLUTION The stock solution
for 237Np contained 5.0·10-4 M Np(V) in 0.1 M HClO4. The
purity of the stock solution was verified by UV-Vis/NIR spec-troscopy.22 For reduction to Np(IV), 0.2 g hydroxylammonium chloride was added to 3 mL of the Np(V) stock solution to obtain a 1 M hydroxylammonium chloride solution. The mix-ture was heated at 80°C for 4 h. The redox state of all Np solutions was verified by UV/Vis-NIR5 and liquid-liquid ex-traction.23 The final Np concentration was determined by ICP-MS and LSC.
IRON SOLUTIONS Iron solution samples were prepared
from FeCl2 and FeCl3 (both anhydrous) salts from Sigma
Aldrich, Germany (≥99.99% trace metal basis) by dissolving in 0.1 M HCl. The redox states in solution were checked by UV-Vis. 1 2 3 4 5 6 7 8 9 10 11 12 13 14 15 16 17 18 19 20 21 22 23 24 25 26 27 28 29 30 31 32 33 34 35 36 37 38 39 40 41 42 43 44 45 46 47 48 49 50 51 52 53 54 55 56 57 58 59 60
BACKGROUND ELECTROLYTE The background
elec-trolyte (BGE) for the CE separation was diluted from 96% acetic acid EMSURE to 1 M with MilliQ water. 2% HNO3
which was used to enhance the volume of solution flowing from the capillary outlet to the nebulizer (make up solution) was prepared from 65% HNO3 (Ultrapur, Merck, Darmstadt).
Methanol (HPLC grade, Merck, Darmstadt) was added to the make up solution to get a 10% methanol content. To measure the EOF, 5µL of a 0.2 M 2-bromoethanol (Alfa Aesar) solu-tion diluted in 0.1 M HNO3 was added to the sample as an
electroneutral marker.
DETERMINATION OF pH AND Eh The pH in solution
was measured by a MettlerToledo FiveEasy pH meter with a Ross electrode calibrated with four standard buffers (pH 3, 5, 7 and 9; Merck Darmstadt). The error of pH measurements was ± 0.05. The redox potentials in solution were measured using a MettlerToledo FiveEasy (Eh meter) and a Pt combined electrode with Ag/AgCl reference system (Metrohm) and converted into Eh vs. standard hydrogen electrode (SHE) by correcting for the potential of the reference electrode. A com-mercial redox-buffer (220 mV, Schott instruments) was used for calibration. An equilibration time of 25 min was applied for all Eh measurements with uncertainties of ± 50 mV.
INDUCTIVELY COUPLED PLASMA SECTOR FIELD MASS SPECTROMETER The used ICP-SF-MS in
the redox speciation experiments was a Thermo Element XR. This classic double focusing sector field mass spectrometer consists of two mass separation devices. A magnetic sector field and an electrostatic sector field which are perpendicularly aligned to the ion beam. With this kind of geometry and a slit device which defines the obtained resolution, the machine provides two important features. One is a very high sensitivity in low resolution mode where the slits are completely open. This is important for the quantification of ultra-trace elements with very low solubilities as it is expected for neptunium and plutonium, especially under the redox state +IV. The other feature is the possibility to resolve isobaric interferences by narrowing the slits in medium or high resolution mode, which is of particular importance to analyze elements which are interfered by the existence of isobaric cluster ions with similar m/z ratios. For example 56Fe is isobaric to 40Ar16O or 40Ca16O. By applying these two features in one analysis sequence it is possible to record electropherograms alternating in low resolu-tion mode (high sensitivity) and high resoluresolu-tion mode (high selectivity).
CAPILLARY ELECTROPHORESIS A commercial
Beckman Coulter P/ACE MDQ capillary electrophoresis sys-tem was used for all separations. It was equipped with a tailor-made capillary cartridge support designed for the adaption of an external detector. Fused silica capillaries (Polymicro Tech-nologies, Phoenix, AZ, USA) of 73 cm length and an internal diameter of 75 µm were used. The capillary inside the instru-ment was kept at a constant temperature of 15°C by a liquid cooling agent surrounding the capillary. Under our experi-mental conditions the temperature gradient between the center of the capillary and the liquid coolant was estimated to be 0.7 °C. The temperature is therefore considered as homogenous across the capillary’s cross section. There was 10 cm of the capillary outside the instrument in the interface section that was not temperature controlled. The hyphenation of the CE to the ICP-SF-MS was achieved using a Mira Mist CE nebulizer (Burgener Research, Mississauga, ON, Canada), which has
already been described and characterized.24 A schematic figure of the interface linking the CE to the ICP-SF-MS is shown in. New capillaries were conditioned prior to use by rinsing with 0.1 M HCl (Merck, Ultrapur), 0.1 M NaOH (Merck, Titripur), MilliQ (18MΩ) and background electrolyte for 5 hours in total.
Figure 1: Scheme of interface linking capillary electrophoresis and ICPMS
Table 1 summarizes the operational conditions for the CE-ICP-SF-MS. 1 M acetic acid was the background electrolyte (BGE) in all separation procedures. Prior to each run the capil-lary was washed with BGE during 5 min at 20 psi. The separa-tions were generally completed within 20 min and the capil-lary rinsing sequence after each separation within 5 min. Be-tween two separations, the capillary was flushed with HCl (0.1 M) (1 minute), MilliQ (1 minute) and background electrolyte (4 minutes) in the given order, with a pressure of 20 psi. The sample injections were carried out hydrodynamically at 2 psi for 10 s. The injected volume was calculated as 2.3 nL apply-ing the Hagen-Poiseuille equation.
Table 1. Operational conditions for CE-ICP-SF-MS setup
Parameters
CE System BeckmanCoulter P/ACE
MDQ
CE Voltage 15 – 30 kV
CE Current 5 – 65 µA
CE Capillary fused silica,
inner diameter 75 µm outer diameter 635 µm length 730 mm Sample Injection Hydrodynamic
10 s / 2 psi CE background
electro-lyte
1 M acetic acid, pH 2.4
Nebulizer MiraMist CE
ICP-SF-MS system Thermo Element 2XR
Plasma Power 1250 W
Detection mode triple
Separations were performed at +30 kV at a constant pres-sure of 0.4 psi to prevent clogging of the capillary. The buffer solution and the rinse solutions were exchanged after each run 1 2 3 4 5 6 7 8 9 10 11 12 13 14 15 16 17 18 19 20 21 22 23 24 25 26 27 28 29 30 31 32 33 34 35 36 37 38 39 40 41 42 43 44 45 46 47 48 49 50 51 52 53 54 55 56 57 58 59 60
to avoid any degradation by electrolysis and cross contamina-tion of solucontamina-tions. To avoid the influence of atmospheric O2 on
the redox conditions of the sample, the electrophoretic separa-tions were completed in a nitrogen atmosphere. For that, the CE apparatus was placed in a glove box flushed with nitrogen. The monitored oxygen concentration in CE-glove box was less than 5 ppm.
RESULTS AND DISCUSSION
SPECIATION OF PLUTONIUM AND NEPTUNIUM
Four different oxidation states of Pu from +III to +VI, and two of Np +IV and +V can simultaneously exist in aqueous solu-tions, while the chemical properties of these species vary considerably. The knowledge of their geochemical behavior under natural conditions is a vital issue in geochemical studies related to nuclear waste disposal. This work resumes previous studies to improve the detection limits of actinides.17 There-fore 1 M acetic acid was chosen as the BGE for the separation of Pu redox species. The separated species in 1 M acetic acid are acetate complexes of Np and Pu (Table 2). Depending on their stoichiometric composition net charges of the complexed species differ from those of the non-complexed forms. This has an effect on the electrophoretic mobility sequence. For Pu the migration order is +III, +VI, +V, +IV, for Np it is: +V, +IV.
To obtain well separated signals the difference in the migra-tion time of two redox species must be significant. For that reason it is necessary to apply capillaries which are sufficient-ly long. In our set up the minimum capillary length to obtain well separated signals of the +V and +VI redox species is 68 cm. To ensure baseline separation even at very different con-centration levels of the redox species a capillary length of 73 cm is applied.
Table 2: Np/Pu-acetate complexes and iron complexes with o-phen and EDTA expected in 1 M acetic acid at pH 2.417
Cation (in order of increas-ing experi-mental migration time)
Metal species in solution (main species in bold letters) decreasing electrophoretic mobility
Pu3+ Pu3+
Pu(Ac)2+
NpO2+ NpO2+
PuO22+ PuO22+ PuO2(Ac) + PuO2+ PuO2 + Pu4+ Pu(Ac)4 Np4+ Np(Ac)3+ Np(Ac)22+ Np(Ac)3 + Np(Ac)4
Expected iron species with o-phen and EDTA at pH 2.4
Fe2+
Fe(phen)3 2+ Fe3+
Fe(EDTA) -Electromobilities of individual species are matrix depend-ent, which makes an identification of the species difficult. In order to correct for matrix effects we added a neutral marker to the sample and calculated the EOF. From the specific run-ning times relative to the EOF characteristic mobilities of the actinide acetate complexes can be calculated according to the following equation:
( ) (
) ( )
where l is the length of capillary [cm], E is the applied volt-age [V], tspecies is the migration time of metal species [sec] and
teof is the migration time of electroneutral marker
(2-bromoethanol) [sec]. The analyte’s migration velocity in capil-lary electrophoresis depends upon the electroosmotic flow (eof) of the buffer solution. teof represents the migration time
of the neutral marker which is in our case 2-bromoethanol. Determining characteristic electromobilities facilitates une-quivocal species identification. Experimentally obtained elec-trophoretic mobilities are listed in Table 3.
The make up electrolyte was mixed with different amounts of methanol to lower the surface tension and, thus, to optimize nebulization efficiency. A content of 10% methanol enhanced the detection sensitivity by a factor of four. Higher methanol content leads to carbon deposition at sampler and skimmer cones of the ICP-SF-MS and in consequence to a loss of de-tection sensitivity.
Element specific recovery rates were determined by inte-grating signals in the electropherogram plus the fraction eluted during the rinsing step and comparison with total analyte concentration, measured by conventional ICP-MS. Under optimized conditions the mean recovery rates were around 95%. Details of the instrumental optimization steps are de-scribed in the supporting information.
DETERMINATION OF PLUTONIUM REDOX STATES Figure 2 shows a combined electropherogram of
four different runs where each solution contains Pu in a single redox state, initially dissolved in 1 M HClO4 before mixing
with the BGE. Peaks (1)-(3) correspond to the electrophoretic signals of a 2.5·10-11 M Pu(III)-, a 5.0·10-11 M Pu(VI) and a 5.0·10-11 M Pu(V) standard solution, respectively. The last peak (4) represents Pu4+ and is characterized by a tailing at t > 600 s (5). The tailing is due to the formation of Pu(IV) poly-meric species25 or partial sorption to the capillary wall. The Pu(IV) concentration is 8.0·10-11 M.
Figure 2: Combined electropherogram of 242Pu reference solutions in 1M HClO4: peak (1) Pu(III), peak (2) Pu(VI), peak (3) Pu(V),
peak (4) Pu(IV) and peak (5) Pu(IV) polyspecies (t > 600 s); ([242Pu]= 2.1·10-10 M; hydrodynamic injection: 10 s / 2 psi; voltage: 30 kV; BGE: 1 M HAc; pH= 2.4)
The purity of the single Pu oxidation state in the standard solution prior to dilution (10-5 M to 10-8 M) was proved by UV/Vis spectroscopy and by LLE. The total Pu concentrations in the different extraction fractions were subsequently meas-ured by α-LSC. The results were in good agreement with the data from the electrophoretic analysis. Any other oxidation
(1) (2) (3) (4) (5) 1 2 3 4 5 6 7 8 9 10 11 12 13 14 15 16 17 18 19 20 21 22 23 24 25 26 27 28 29 30 31 32 33 34 35 36 37 38 39 40 41 42 43 44 45 46 47 48 49 50 51 52 53 54 55 56 57 58 59 60
species in the samples was of minor abundance (less than 5% of the total Pu content) and therefore not detectable by UV/Vis and LLE. As soon as the reference solutions are mixed with the acetic acid buffer solution, injection and separation should be performed within 3 minutes in order to avoid redox chang-es. It is also crucial that all solutions used during analysis are degassed to prevent oxidation by dissolved oxygen.
Calibration of the CE-HR-ICP-MS arrangement was per-formed by analyzing Pu redox species in a concentration range from 1.0·10-11 M to 1.0·10-10 M. The detection limits were calculated based on the 3σ criterion (see table 3). Five repli-cates of a blank solution (1 M acetic acid) were analyzed, the responses were converted into mol/L, and the standard devia-tion is calculated. Linear calibradevia-tion curves are available from the supporting info, Fig S1. Correlation factors (R2) ranged from 0.98 to 0.99 (see).
DETERMINATION OF NEPTUNIUM REDOX STATES Figure 3 shows the combined electropherograms of
two neptunium standard solutions. The first and the second peak correspond to signals of 1.0·10-9 M Np(V) and Np(IV) solutions, respectively. The preparation of both solutions and the separation conditions are described in the experimental part. The purity of the neptunium oxidation states was also examined by UV-Vis/NIR and LLE prior of dilution. The reference solutions were examined by CE-ICP-SF-MS when UV-Vis/NIR and LLE data showed > 95% of the single oxida-tion state.
Figure 3: Combined electropherogram of 237Np reference
solu-tions in 0.1M HClO4: peak (1) Np(V), peak (2) Np(IV); ([ 237
Np]= 2.0·10-9 M; hydrodynamic injection: 10 s / 2 psi; voltage: 30 kV; BGE: 1 M HAc; pH= 2.4)
The calibration of the CE-ICP-SF-MS system was done for Np in two oxidation states for a concentration range between 7.5·10-11 M to 1.0·10-9 M. The detection limits were calculated via the standard deviation of the background signal (3σ). The linear correlation (R2) of the calibration line was 0.99 for Np(V) and 0.98 for Np(IV) (Table 3). Calibration curves are plotted in the supporting info, Fig. S2.
Table 3: CE-ICP-SF-MS detection limits (3σ) and electro-phoretic mobility of Pu (III, IV, V, VI) and Np(IV, V) in 1 M acetic acid. Oxidation state Limit of detec-tion [M] Experimental electrophoretic mobility [·10-4 cm2V-1s-1] Pu(III) 2·10-12 4.0±0.07 Pu(IV) 5·10-12 1.2±0.08 Pu(V) 6·10-12 1.6±0.06 Pu(VI) 2·10-12 2.4±0.05 Np(IV) 8·10-12 1.2±0.08 Np(V) 6·10-12 2.4±0.06 Np(VI) n. a. 2.2±0.05*
* Calculation based on three replicates
In this publication we determined a separation order of the acetate species of plutonium which is: µ0 (Pu(III)) > µ0 (Pu(VI)) > µ0 (Pu(V)) > µ0 (Pu(IV)), this is consistent to the reported order by Kuczewski et al. 2003.17 We currently have no explanation for the electromobilities of Np(VI) and Np(V) species being clearly different from those of Pu(VI) and Pu(V). Note that electrophoretic mobilities of Np and Pu redox species were also reported in other studies 13-15, but are not comparable to our values due to different experimental bound-ary conditions.
SEPARATION OF IRON REDOX SPECIES As
men-tioned before, one of the most important redox pairs in envi-ronmental system is the Fe(II)/Fe(III) couple. Measuring the Fe redox species distribution allows calculating the redox potential in the investigated system solution by applying the Nernst equation and, thus, can provide insight into groundwa-ter redox conditions. Separation of different Fe species using complexing agents such as o-phenanthroline (phen) and EDTA is a common approach also used in capillary electro-phoresis.26 Phen has a good selectivity for Fe(II) with a condi-tional complex stability constant of log β of 24.3. EDTA is selective for Fe(III) with the conditional complex stability constant of log β of 25.1.26,27 Due to the similarity of the sta-bility constants Fe(II) and Fe(III) species are stabilized in the sample to a similar extent and changes in the Fe-redox state is minimized. Prevention of a shift in the Fe(II)/Fe(III) ratio requires the simultaneous addition of both complexing agents in an at least 10 fold excess over the metal ion concentration to the sample.27 ICP-SF-MS detection has been performed in the medium resolution mode to suppress interference signals from ArO+ and ArN+. Figure 4 shows a combined electropherogram of single Fe(II) and Fe(III) solutions with a concentration of 5·10-7 M each. The separation under these conditions is com-pleted in less than 5 minutes. The calculated electrophoretic mobilities of the two iron complexes are 2.0·10-4 cm2V-1s-1 for Fe(II)phen3 and 8.5·10
-5
cm2V-1s-1 for Fe(III)EDTA. The cali-bration of the CE-ICP-SF-MS system was done for both oxi-dation states in a concentration range between 1.0·10-6 M to 1.0·10-5 M. The detection limits again were calculated via the standard deviation of the background signal (3σ). The linear correlation (R2) of the calibration line was 0.98 for Fe(III) and 0.99 for Fe(II) (see supporting info, Fig. S3). The detection limit for Fe(II) and Fe(III) was deduced to be 5·10-8 mol/L. CE-ICP-SF-MS is the only analytical tool, which is able to do iron redox speciation at these low concentration ranges with a minimal invasive character. To proof the applicability of the method to solutions containing Fe in different redox states, different samples with varying Fe(III)/Fe(II) ratios in 1 M HCl were prepared in an inert gas box and analyzed by CE-ICP-SF-MS. (1) (2) 1 2 3 4 5 6 7 8 9 10 11 12 13 14 15 16 17 18 19 20 21 22 23 24 25 26 27 28 29 30 31 32 33 34 35 36 37 38 39 40 41 42 43 44 45 46 47 48 49 50 51 52 53 54 55 56 57 58 59 60
Figure 4: Combined electropherogram of 56Fe reference solutions in 1 M HCl: Fe(II) peak (1) Fe(II)phen32+; ‘Fe(III) peak (2)
Fe(III)EDTA-; ([56Fe]total= 1.0·10 -6
M; hydrodynamic injection: 10 s / 2 psi; voltage: 30 kV; BGE: 1 M HAc; pH= 2.4)
Based on the resulting Fe(II)/Fe(III) ratio a redox potential was calculated from free iron activities and applying the Nernst equation:
g
(2)
where refers to the redox potential (V) in
stan-dard conditions, brackets denote activities, R is the molar gas constant (J mol-1 K-1), T is the temperature (K), n is the number of electrons in the half redox reaction and F is the Faraday constant (J V-1).
Figure 5: Comparison of calculated redox potential from CE data with measured redox potentials in different Fe(III)/Fe(II) ratios. red: CE data, black: electrode values, dashed line: ideal Nernst behavior; BGE: 1 M HCl
For pH = 1, hydrolysis of both Fe(II) and Fe(III) are negli-gible. (activity coefficients are calculated by using the Specific Ion Interaction Theory (SIT)28). Calculated Eh values are compared with Redox potentials measured with a combined Pt-electrode and are found in good agreement (see Figure 5). This finding demonstrates the applicability of the CE-ICP-SF-MS method for Fe-redox speciation.
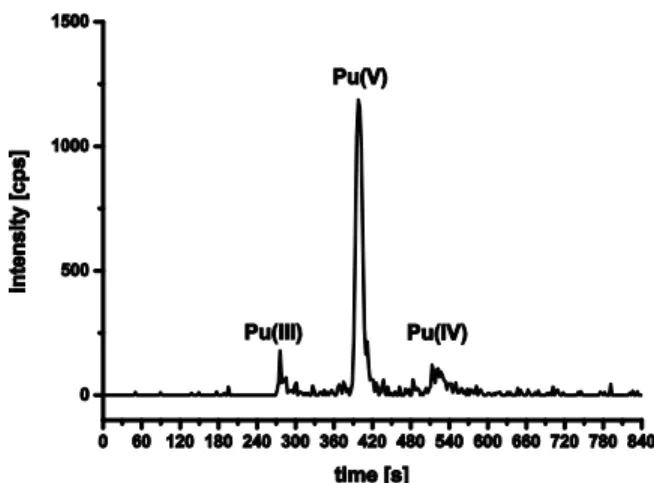
REDOX SPECIATION IN LABORATORY STOCK SOLUTIONS We applied the CE-ICP-SF-MS method to
characterize a laboratory solution presumably containing Pu exclusively in pentavalent state. Spectroscopic characteriza-tion was impossible because of the low Pu concentracharacteriza-tion of 1.2·10-9 M. LLE analysis revealed a significant amount of
Pu(IV) (85%±10% Pu(V), 15%±10% Pu(IV). But as the con-centration of 242Pu was close to the detection limit of LSC, the results exhibit large uncertainties. CE-ICP-SF-MS analysis and applying the known electrophoretic mobilities in Table 3 results in 7% Pu(III) and 17% Pu(IV) besides Pu(V). Notably for long-lived actinide nuclides CE-ICP-SF-MS allows to quantify single Pu redox states even at < 10-9 M whereas other available redox speciation methods could not.
Figure 6: Redox state distribution of Pu in 0.1 M perchloric acid ([242Pu]= 1.2·10-9 M; hydrodynamic injection: 10 s / 2 psi; voltage: 30 kV; pseparation=0.6 psi; BGE: 1 M HAc; pH= 2.4);
Similar to Pu, a freshly prepared laboratory Np stock solu-tion which had been fumed to dryness several times and has been taken up in 1 M HClO4 has been characterized by
CE-ICP-SF-MS. The concentration of the sample examined by UV-Vis/NIR was 1.0·10-5 M. In the original solution UV-Vis/NIR spectra of this sample showed characteristic absorp-tion bands of Np(IV), Np(V) and Np(VI). The evaluaabsorp-tion of the UV-Vis/NIR spectra was done by measuring the maximum absorbance at characteristic wavelengths (λ) with given molar absorptivities (ε) (see Table S2).
The calculation of oxidation state ratios from UV-Vis/NIR data gave a 20% content of Np4+, 12% NpO2
+
and 68% NpO2
2+
. After dilution by the factor of 100 in 1 M perchloric acid and subsequent dilution by 1 M acetic acid by the factor of 200 the sample was examined by CE-ICP-SF-MS.The peak assignment is based on the previously determined electropho-retic mobilities. The first peak in the electropherogram has an electrophoretic mobility of 2.4∙10-4
cm2V-1s-1. Because of that value the first peak is identified as Np(V) and the second peak as a consequence is assigned to Np(VI). Under those condi-tions Np(VI) apparently is reduced and results in a sample composition of 43% Np(IV), 26% Np(V) and 31% Np(VI) (see Figure 7). The deviation with regard to spectroscopy is due to the pronounced instability of Np(VI) against reduction at acidic pH. It is anyhow remarkable that despite the high dilution Np(VI) could still be detected.
NEPTUNIUM IN CONTACT WITH ILLITE A previous
study was dedicated to Np sorption to a clay mineral (illite).29 Illite is a clay mineral with strong sorption properties and for that reason illite containing sediment formations are consid-ered as potentially suitable host rock systems for nuclear waste disposal. The authors contacted Np(V) (3.0∙10-8 < [237Np(V)]tot
< 3.0∙10-4 M) with illite (2 g/L) at different pH in 0.1 M NaCl under inert (Ar) atmosphere.
(1) (2) 1 2 3 4 5 6 7 8 9 10 11 12 13 14 15 16 17 18 19 20 21 22 23 24 25 26 27 28 29 30 31 32 33 34 35 36 37 38 39 40 41 42 43 44 45 46 47 48 49 50 51 52 53 54 55 56 57 58 59 60
Figure 7: Redox state distribution of a freshly prepared Np in 1.0 M HClO4 ([237Np]= 5.0·10-10 M; hydrodynamic injection: 10 s / 2
psi; voltage: 30 kV; BGE: 1 M HAc; pH= 2.4);
Although sorption of Np(V) to minerals is usually weak, a strong interaction of Np with illite was observed. Based on Eh/pH conditions, Np(V) should prevail in the aqueous phase, while the unexpected strong sorption was attributed to surface induced reduction of Np(V) to Np(IV) at the illite surface. The prevalence of Np(V) in the aqueous phase and the presence of a fraction of Np(IV) at the surface could be confirmed by LLE and XAS but only at high Np concentrations ([237Np(V)]tot >
10-5 M). To confirm the same result at lower concentrations, CE-ICP-SF-MS was applied.
We investigated a sample containing Np ([Np(V)]tot =
3.0∙10-8 M) and suspended illite in 0.1 M NaCl solution which was kept under Ar atmosphere for 1.2 years. pH was at 7.4 and the Ehexp at 0.24 V and did not significantly evolve and fall
clearly within the stability field of Np(V) in solution. After phase separation by ultracentrifugation (400’000g) an aliquot of the supernatant is taken for CE-ICP-SF-MS measurement. The Np concentration in the remaining solution dropped down to 2.2·10-10 M, because most of the Np was sorbed on the clay mineral. The electropherogram in Figure 8 shows only one peak, giving evidence to the prevalence of a single Np redox state. The electrophoretic mobility calculated with equation 1 is 2.5·10-4 cm2 V-1 s-1, which is attributed to Np(V). Hence, the prevalence of Np(V) was confirmed also for the samples at very low Np concentration. This result is in agreement with Eh and pH measurements of the solution and confirms the results obtained in a previous work for higher [Np(V)]tot. The absence
of Np(IV) in solution allows us to exclude precipitation of Np(IV) oxihydroxides. Under those conditions a solubility controlled Np(IV) concentration would be at 10-9±1 M30 and would be easily detected with our method. This makes clear that Np(IV) must exist as surface complex. By assuming a Np(IV) species concentration in the range of the detection limit of the CE-ICP-SF-MS a lower limit for the Eh (denoted Ehmin) can be estimated:
( ) ( ) g ( ) where ( ) ( ) is the effective Np(V)/Np(IV) redox
po-tential, which equals 0.104 V at pH = 7.4 in 0.1 M NaCl.29 The calculated Ehmin value is 0.204 V. As Ehexp > Ehmin, our Np
redox state analysis are qualitatively consistent with the Eh measurement in the illite aqueous suspension.
Figure 8: Np in the supernatant of a suspension with illite; [Np]= 2.2·10-10 M; (hydrodynamic injection: 10 s / 2 psi; voltage: 30 kV;
BGE: 1 M HAc; pH= 2.4)
REDUCTION OF Pu(VI) BY Fe(II) We investigated the
Pu(VI) reduction by Fe(II) in 0.1 M HClO4 solution at pH =
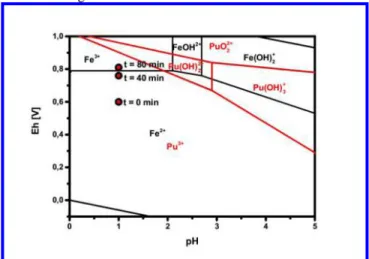
1.0 under aerobic conditions. A solution containing 2.0·10-6 M Fe(II) was added to a 5.0·10-10 M 242Pu(VI) solution to get a total volume of 50 mL. Two aliquots of 1.5 mL were taken every 40 minutes and submitted to separate Fe and Pu redox speciation analyses by CE-ICP-SF-MS. The first two aliquots each were taken immediately after Fe(II) was added. Phen and EDTA were added to one aliquot for Fe analyses while the second aliquot was untreated for Pu analysis. The electro-pherograms of the separation of the Fe and Pu redox species are shown in Figure 9 and the resulting redox speciation for both elements is given in Table 4 for each reaction time. The initial iron redox speciation is 100% Fe(II) (t=0 in Figure 9). After 40 minutes the iron composition reached almost 50% Fe(II) and 50% Fe(III).
Figure 9: Fe (black) and Pu (red) redox state analysis of a solution containing [Pu]total= 5.0·10-10 M, [Fe]total= 2.0·10-6 M, 0.1M
HClO4, pH= 1.0, traces of O2 present.
Because Fe is in wide excess compared to Pu, the partial ox-idation of Fe(II) to Fe(III) might be caused by traces of O2 (<
1ppm) during this experiment. After 80 minutes, Fe redox speciation did not change significantly. Pu(VI) is gradually reduced with time to intermediately form Pu(III) and Pu(IV). After 100 minutes the solution contains mostly Pu(III). 1 2 3 4 5 6 7 8 9 10 11 12 13 14 15 16 17 18 19 20 21 22 23 24 25 26 27 28 29 30 31 32 33 34 35 36 37 38 39 40 41 42 43 44 45 46 47 48 49 50 51 52 53 54 55 56 57 58 59 60
Table 4: Redox speciation of Fe and Pu vs. time; (species below the limit of quantification (9σ) are given in < 5 %)
Species t = 0 min t = 40 min t = 80 min Fe(II) 100 % 56 % 41 %
Fe(III) < 5 % 44 % 59 %
Species t = 20 min t = 60 min t = 100 min Pu(III) < 5 % 42 % > 90 %
Pu(IV) 18 % 54 % < 5 %
Pu(VI) 82 % < 5 % < 5 % The Pu(IV) and Pu(VI) contents drop to concentrations be-low the detection limit. Therefore, in the presently investigated conditions, the presence of Fe(II) leads to an almost complete reduction of Pu(VI) to Pu(III) within 100 min in solution. The redox potential (Eh) of the solution was measured every 40 minutes, just before sampling. The initial experimental Eh value (Ehexp) was 0.634 V and increased with time: Ehexp (40
min) = 0.774 V and Ehexp (80 min) = 0.817 V. This is
qualita-tively consistent with the increasing Fe(III)/Fe(II) ratio meas-ured by CE-ICP-SF-MS, which further demonstrates that Fe(II) oxidation occurred in the sample, and is not an artifact of the CE-ICP-SF-MS measurement. Based on the redox state analysis of Fe by CE-ICP-SF-MS, the redox potential of the solution was also calculated (denoted Ehcalc) using the Nernst
equation (equation 2). The activities of the iron species were calculated using the Davies equation. Again, Eh values calcu-lated from Fe-speciation measured by CE-ICP-SF-MS are consistent with those measured by using a Pt-electrode within the uncertainty of the Eh measurement of about ± 50mV. As the total iron concentration of the solution is higher by orders of magnitude than the plutonium concentration, the redox potential after the reduction of all the Pu(VI) of the system (~ 80 min), is controlled by the equilibrium Fe(II)/Fe(III), as can be seen in Figure 10.
Figure 10: Detail of a Pourbaix diagram of iron and plutonium in 0.1 M NaClO4 solution with measured redox potentials
during the plutonium reduction28,31,32
The calculated and measured redox potentials are close to the Fe(III)/Fe(II) equilibrium in the Pourbaix diagram under these conditions (see Figure 10). The conditional redox potential of the Pu(VI)/Pu(III) couple is + 0.918V in 0.1 M HClO4.
There-fore, Pu(VI) reduction is thermodynamically favored under given conditions, and our results show that this reaction is rather fast. The example shows the possibility to apply fast
CE-ICP-SF-MS analysis to monitor the kinetics of actinide redox processes.
SUMMARY AND CONCLUSION
The coupling of a capillary electrophoresis to a high resolu-tion mass spectrometer provides very sensitive insight into the aqueous chemistry of redox sensitive elements at trace concen-tration levels. CE provides features as very small sample con-sumption, low invasive character and vast resolving ability, which makes it a very powerful tool to conduct studies in actinide chemistry. The high resolution mass spectrometer provides very high sensitivity in low resolution mode and good suppression of interferences in higher resolution modes. This coupled setup provides high efficiency, fast separation, high sensitivity or selectivity and ability for multi-isotope analysis in one sample.
Very often redox speciation of actinides is hampered by the relatively poor sensitivity of spectroscopic methods. Results obtained by employing higher actinide concentrations, how-ever, usually cannot be compared to reactions of low actinide concentrations at close to natural conditions due to precipita-tion of low solubility actinide(IV) or (III) oxihydroxides. CE-ICP-SF-MS allows avoiding those problems. Detection limits of around 10-12 M allow redox speciation clearly below solu-bility limits of reduced actinide solids. At least in our studies, the final results regarding actinide and iron redox states was in agreement with speciation calculations and measured redox potentials. This enhances reliability of results and points to the insignificant modification of redox speciation during analysis.
The examples discussed in the present paper delineate pos-sible application fields in the context of environmental acti-nide chemistry such as coupled redox/sorption processes at mineral surfaces and the elucidation of redox reactions in the presence of dissolved redox partners. The rapidness of analy-sis allows to monitor time dependent processes.
Several experiments are planned to examine the role of iron on redox processes affecting radionuclides in clay minerals and granite-groundwater systems in the future. The obtained results will give a more detailed insight on the sorption behav-ior of radionuclides to these minerals, which strongly depends on their redox speciation. The studies with CE-ICP-SF-MS will be extended to other redox sensitive elements with the aim of establishing a robust experimental approach to deter-mine and quantify redox speciation at trace level concentra-tions.
Acknowledgment
We are grateful to JRC-ITU (Joint Research Center - Insti-tute for Transuranium Elements) for providing the 242Pu. We are also grateful to Vanessa Höhn for drawing the schematic figure of the coupling setup. The research has received partial-ly funding from the German Federal Ministry for Economic Affairs and Energy (BMWi) under contract No. 02 E 10961. 1 2 3 4 5 6 7 8 9 10 11 12 13 14 15 16 17 18 19 20 21 22 23 24 25 26 27 28 29 30 31 32 33 34 35 36 37 38 39 40 41 42 43 44 45 46 47 48 49 50 51 52 53 54 55 56 57 58 59 60
Supporting Information Available
This information is available free of charge via the internet at http://pubs.acs.org/
Contents of the material supplied as Supporting Infor-mation:
Linear calibration of four Pu redox states Linear calibration of two Np redox states Linear calibration of two Fe redox states
Comparison of 238U and 238U16O in dependency of the make up flow
Comparison of 238U and 238U16O in dependency of the sample gas pressure
Intensities of 238U in dependency of the capillary position inside the tip of the nebulizer
Table of the analytical performance of the method Table of characteristic data and concentrations of
Np UV-Vis/NIR spectra compared with CE-ICP-SF-MS data 1 2 3 4 5 6 7 8 9 10 11 12 13 14 15 16 17 18 19 20 21 22 23 24 25 26 27 28 29 30 31 32 33 34 35 36 37 38 39 40 41 42 43 44 45 46 47 48 49 50 51 52 53 54 55 56 57 58 59 60
(1) Altmaier, M.; Gaona, X.; Fanghanel, T. Chem Rev 2013, 113, 901-943.
(2) Lujaniene, G.; Benes, P.; Stamberg, K.; Joksas, K.; Kulakauskaite, I. J Radioanal Nucl Ch 2013,
295, 1957-1967.
(3) Nitsche, H.; Muller, A.; Standifer, E. M.; Deinhammer, R. S.; Becraft, K.; Prussin, T.; Gatti, R. C.
Radiochim Acta 1993, 62, 105-105.
(4) Nitsche, H. Abstr Pap Am Chem S 1993, 205, 129.
(5) Hindman, J. C.; Magnusson, L. B.; Lachapelle, T. J. J Am Chem Soc 1949, 71, 687-693.
(6) Liu, X. W.; Millero, F. J. Geochim Cosmochim Ac 1999, 63, 3487-3497.
(7) Klenze, R. Direct spectroscopic speciation of actinide ions at the water/mineral interface;
Organisation for Economic Co-Operation and Development Nuclear Energy Agency, 2001.
(8) Saito, Y.; Jinno, K. Anal Bioanal Chem 2002, 373, 325-331.
(9) Datta, A.; Sivaraman, N.; Viswanathan, K. S.; Ghosh, S.; Srinivasan, T. G.; Rao, P. R. V. Radiochim
Acta 2013, 101, 81-92.
(10) Leyva, D.; Estevez, J.; Montero, A.; Pupo, I. J Radioanal Nucl Ch 2012, 291, 699-705.
(11) Topin, S.; Aupiais, J.; Baglan, N.; Vercouter, T.; Vitorge, P.; Moisy, P. Anal Chem 2009, 81,
5354-5363.
(12) Ambard, C.; Delorme, A.; Baglan, N.; Aupiais, J.; Pointurier, F.; Madic, C. Radiochim Acta 2005,
93, 665-673.
(13) Topin, S.; Aupiais, J.; Baglan, N. Radiochim Acta 2010, 98, 71-75.
(14) Topin, S.; Aupiais, J.; Moisy, P. Electrophoresis 2009, 30, 1747-1755.
(15) Aupiais, J.; Delorme, A.; Baglan, N. J Chromatogr A 2003, 994, 199-206.
(16) Stobener, N.; Amayri, S.; Gehl, A.; Kaplan, U.; Malecha, K.; Reich, T. Anal Bioanal Chem 2012,
404, 2143-2150.
ACS Paragon Plus Environment
1 2 3 4 5 6 7 8 9 10 11 12 13 14 15 16 17 18 19 20 21 22 23 24 25 26 27 28 29 30 31 32 33 34 35 36 37 38 39 40 41 42 43 44 45 46 47 48 49 50 51 52 53 54 55 56 57 58 59 60
(17) Kuczewski, B.; Marquardt, C. M.; Seibert, A.; Geckeis, H.; Kratz, J. V.; Trautmann, N. Anal Chem
2003, 75, 6769-6774.
(18) Vencel, T.; Donovalova, J.; Gaplovsky, A.; Kimura, C.; Toma, S. Chem Pap 2005, 59, 271-274.
(19) Nitsche, H.; Lee, S. C.; Gatti, R. C. J Radioan Nucl Ch Ar 1988, 124, 171-185.
(20) James, D. B. J Inorg Nucl Chem 1963, 25, 711-715.
(21) Brendebach, B.; Banik, N. L.; Marquardt, C. M.; Rothe, J.; Denecke, M. A.; Geckeis, H.
Radiochim Acta 2009, 97, 701-708.
(22) Cohen, D.; Taylor, B. J Inorg Nucl Chem 1961, 22, 151-153.
(23) Moore, F. L. Anal Chem 1957, 29, 941-944.
(24) Michalke, B. J Anal Atom Spectrom 1999, 14, 1297-1302.
(25) Zanker, H.; Hennig, C. J Contam Hydrol 2014, 157, 87-105.
(26) Schaffer, S.; Gareil, P.; Dezael, C.; Richard, D. J Chromatogr A 1996, 740, 151-157.
(27) Pozdniakova, S.; Padarauskas, A.; Schwedt, G. Anal Chim Acta 1997, 351, 41-48.
(28) Lemire, R. J.; Berner, U.; Musikas, C.; Palmer, D. A.; Taylor, P.; Tochiyama, O.; Perrone, J.,
Chemical thermodynamics of iron-Part 1-Chemical thermodynamics volume 13a; Data Bank,
Organisation for Economic Co-Operation and Development, Nuclear Energy Agency-OECD/NEA, Le
Seine Saint-Germain, 12 boulevard des Iles, F-92130 Issy-les-Moulineaux (France)2013.
(29) Marsac, R.; Banik, N. l.; Lützenkirchen, J.; Marquardt, C. M.; Dardenne, K.; Schild, D.; Rothe, J.;
Diascorn, A.; Kupcik, T.; Schäfer, T.; Geckeis, H. Geochim Cosmochim Ac 2015, 152, 39-51.
(30) Neck, V.; Kim, J. I.; Seidel, B. S.; Marquardt, C. M.; Dardenne, K.; Jensen, M. P.; Hauser, W.
Radiochim Acta 2001, 89, 439-446.
(31) Lemire, R. J., Fuger, J., Nitsche, H., Potter, P., Rand, M. H., Rydberg, J., Spahiu, K., Sullivan, J.
C., Ullman, W. J., Vitorge, P., Wanner, H. (OECD, NEA-TDB). Chemical thermodynamics vol. 4,
chemical thermodynamics of neptunium and plutonium; Elsevier: Amsterdam, 2001.
(32) Hummel, W.; Anderegg, G.; Puigdomenech, I.; Rao, L. F.; Tochiyama, O. Radiochim Acta 2005,
93, 719-725.
ACS Paragon Plus Environment
1 2 3 4 5 6 7 8 9 10 11 12 13 14 15 16 17 18 19 20 21 22 23 24 25 26 27 28 29 30 31 32 33 34 35 36 37 38 39 40 41 42 43 44 45 46 47 48 49 50 51 52 53 54 55 56 57 58 59 60
For TOC only
ACS Paragon Plus Environment
1 2 3 4 5 6 7 8 9 10 11 12 13 14 15 16 17 18 19 20 21 22 23 24 25 26 27 28 29 30 31 32 33 34 35 36 37 38 39 40 41 42 43 44 45 46 47 48 49 50 51 52 53 54 55 56 57 58 59 60


![Figure 3: Combined electropherogram of 237 Np reference solu- solu-tions in 0.1M HClO 4 : peak (1) Np(V), peak (2) Np(IV); ([ 237 Np]=](https://thumb-eu.123doks.com/thumbv2/123doknet/14743840.577433/7.918.470.839.52.208/figure-combined-electropherogram-reference-solu-solu-tions-hclo.webp)
![Figure 7: Redox state distribution of a freshly prepared Np in 1.0 M HClO 4 ([ 237 Np]= 5.0·10 -10 M; hydrodynamic injection: 10 s / 2 psi; voltage: 30 kV; BGE: 1 M HAc; pH= 2.4);](https://thumb-eu.123doks.com/thumbv2/123doknet/14743840.577433/9.918.493.799.76.294/figure-redox-distribution-freshly-prepared-hydrodynamic-injection-voltage.webp)