HAL Id: hal-02411060
https://hal.archives-ouvertes.fr/hal-02411060
Submitted on 16 Dec 2019HAL is a multi-disciplinary open access archive for the deposit and dissemination of sci-entific research documents, whether they are pub-lished or not. The documents may come from teaching and research institutions in France or abroad, or from public or private research centers.
L’archive ouverte pluridisciplinaire HAL, est destinée au dépôt et à la diffusion de documents scientifiques de niveau recherche, publiés ou non, émanant des établissements d’enseignement et de recherche français ou étrangers, des laboratoires publics ou privés.
ALCYONE Calculations Base Irradiation -LOCA TFGR
M. Guyot, V. Gautier-Ottou
To cite this version:
M. Guyot, V. Gautier-Ottou. ALCYONE Calculations Base Irradiation -LOCA TFGR. SCIP MEET-ING, Dec 2018, Nykoping, Sweden. �hal-02411060�
IMPACT OF CONTROL ROD HISTORY ON PHYSICS PARAMETERS IN
A SOLUBLE-BORON-FREE SMALL-SIZED PRESSURIZED WATER
REACTOR
Maxime GUYOT
1, Vincent GAUTIER-OTTOU
11
CEA Cadarache, DEN/DER/SPRC/LE2C
Building 230, 13108 Saint-Paul-les-Durance
[email protected]
ABSTRACT
The standard neutronics model used for Pressurized Water Reactor (PWR) is a two-level computational scheme where a detailed 2D assembly modeling is first used to generate homogenized and collapsed neutron data for a 3D core calculation performed on a coarse space and energy mesh. In this context, the 2D assembly depletion calculation is performed assuming nominal conditions for the assembly depletion (i.e. nominal temperature and neutron spectrum). This assumption is considered to be valid for a PWR in which control rods are mostly extracted during fuel depletion. However, it is incorrect in the case of a boron-free PWR where the neutron spectrum is very dependent on the control rod insertion history. This deficiency of the current neutronics modeling to account for history effects results in an increase of safety margins and therefore a decrease of the core performance. The magnitude of the so-called control rod history effects is investigated in the present paper. For this purpose, the neutronics model has been modified to include an additional parameter to capture history effects at the core level. Current and improved neutronics models have been compared on a 3D core test case. The impact of control rod history on physics parameters such as core cycle length, 3D power distribution and local isotopic production and depletion has been evaluated and analyzed.
KEYWORDS: Small-Sized Pressurized Water Reactor, control rod history, boron-free core
1. INTRODUCTION
The standard neutronics model used for Pressurized Water Reactor (PWR) is a two-level computational scheme where a detailed 2D assembly modeling is first used to generate homogenized and collapsed neutron data for a 3D core calculation performed on a coarse space and energy mesh. In this context, the 2D assembly depletion calculation is performed assuming nominal conditions for the assembly depletion (i.e. nominal temperature and neutron spectrum). From this assembly depletion calculation, self-shielded cross sections are tabulated as function of reactor state parameters such as fuel temperature, moderator density, boron concentration and control rod (CR) insertion. This methodology assumes that the different reactor states are determined as perturbed states of the nominal irradiation history. This hypothesis is considered to be valid for a PWR in which control rods are mostly extracted during fuel depletion. The local neutron energy spectrum used for determining the depletion history is thus close to the one encountered at the core calculation level. In some studies, the moderator history has been considered to account for moderator density differences between top and bottom portions of a PWR [1]. The treatment of history effects has also been examined in more recent publications to account for increased used of CR due to load following capability of PWRs [2][3].
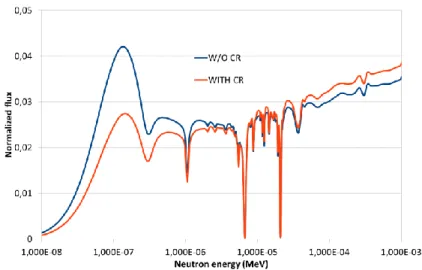
In a soluble-boron-free core, the reactivity control of the core requires an increased dependence on burnable absorbers and CRs. To compensate the reactivity associated with fuel depletion, CRs are inserted for long period of time altering considerably the local neutron spectrum history during irradiation. For instance, Figure 1 shows the differences in the neutron energy spectrum with CR inserted and extracted for a UO2 fuel assembly burnt at 10 GWd/t. We see that the CR insertion involves a significant neutron absorption in the thermal range and a neutron spectrum hardening. Consequently, we expect a faster buildup of plutonium and a correspondingly slower depletion of U-235 if CR is inserted during depletion. These isotopic differences results in reactivity effects which in turn affects the pin power distribution and the CR worth.
In this paper, an investigation of CR history for a soluble-boron (SB) free Small-Sized PWR (S-PWR) is carried out. To account for long insertion of CR, the cross section preparation has been modified as compared to the standard cross section preparation practice. The so-called history parameter, defined as the relative burnup spent with the CR inserted, has been included in the cross section library.
The paper is structured as follows. First, a description of the core test case is provided. Then, we describe the standard computational model and the new one developed for treating CR history effects. Finally, numerical results and perspectives are discussed.
Figure 1 : Neutron energy spectrum for a UO2 fuel assembly in the thermal range with and without the CR insertion
2. CORE DESCRIPTION
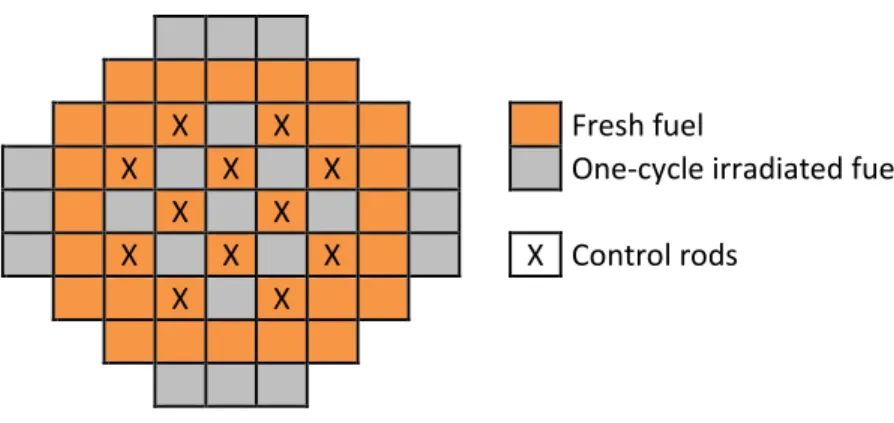
A two-batch core design with UO2 fuel has been considered for reference (<4.95% w/o 235U). The core includes 57 standard PWR 17x17 fuel assemblies (with 264 fuel rods, 24 locations for control rods and the central location for instrumentation). The current assembly design employs poisoned fuel rods gadolinium as burnable absorber. The reloading pattern of the core is shown in Figure 2. For this study, a two-batch refueling scheme has been selected.
Since the core operates without SB, the reactivity control requires a continuous adjustment of the CR position during the fuel depletion. In this study, 12 CRs are inserted as shown in Figure 2. Their positions have been selected to preserve a 1/4th symmetry of the core. A standard CR comprises 24 Ag-In-Cd rodlets that are inserted in the 24 water holes of the fuel assembly. A stainless steel reflector surrounding the core is considered for this study.
X X Fresh fuel
X X X One-cycle irradiated fuel
X X
X X X X Control rods
X X
Figure 2 : Core geometry: loading and control rod patterns
3. COMPUTATIONAL MODEL
In this section, we introduce the standard computational model which is traditionally used for PWR calculation. Then, we present the so-called improved computational model which includes a capability to model the CR history effects. This new model has been derived from the standard one by adding a new reactor state parameter.
3.1. Standard Computational Model
Calculations performed for a standard PWR evaluation rely on a two-level computational scheme where a detailed 2D assembly modeling is first used to generate data for a 3D core calculation performed on a coarse space and energy mesh. These 2 steps are described below.
3.1.1. 2D assembly calculation
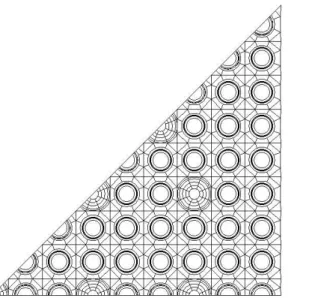
The lattice calculation has been conducted using the APOLLO2.8-MOC/CEA2005-SHEM package [4][5][6]. In this context, APOLLO2 models an infinite lattice that contains a 17x17 fuel assembly as described in Figure 3 (pin and assembly levels). The assembly calculation scheme is based on a two-level approach that we can summarize as fine-in-energy but rather rough-in-space calculation followed by a rather rough-in-energy but fine-in-space calculation. More precisely, the first step is 281-group collision probability calculation relying on the use of the SHEM energy mesh. Self-shielded cross sections are then collapsed to a 26-energy group mesh without any spatial homogenization. The second step is a heterogeneous 26-group flux calculation performed on a detailed 2D geometry with the use of a MOC solver. The detailed geometry can be seen in Figure 3.
To generate assembly-wise 2-group cross sections for use in the core code, a depletion calculation of the fuel assembly is conducted up to 90 GWd/t. Cross sections are then tabulated as a function of burnup, fuel temperature and moderator density to create a multi-parameter cross section library.
Figure 3 : Assembly spatial mesh for the 26-group MOC assembly calculation (1/8th symmetry; on the left) and cell spatial mesh (on the right)
3.1.2. 3D core calculation
The second level of the computational route is the full-core calculation, which aims at producing the neutron flux and reaction rates over the complete reactor. The reactor is described in terms of homogenized cells whose properties are generated at the lattice level. For a PWR, each homogenized cell corresponds to a fuel assembly and is arranged over a squared mesh. The 2-group CRONOS2 code is used at the full-core level [7]. Because CRONOS2 is a diffusion code, a transport-diffusion SPH equivalence step is carried out to correct the cross sections obtained at the lattice level. Here a standard procedure is used based on the Selengut normalization of the SPH coefficients. SPH-corrected cross sections are employed by CRONOS2 for full-core calculations. CRONOS2 also includes a thermal-hydraulics model to account for reactivity effects in response to fuel temperature and moderator density changes.
In a SB-free core, criticality is obtained by adjusting the CR insertion. Thus, an iterative method is required to determine the CR position at each burnup step. The end of cycle is considered to be reached when the reactivity of the core is inferior to +100 pcm with all CRs fully extracted. Equilibrium cycle is attained through the repetition of cycle burnup calculations assuming identical fuel reloading throughout consecutive cycles. Typically, 10 to 15 successive cycles are required to converge to an equilibrium cycle. 3.2. Improved Computational Model
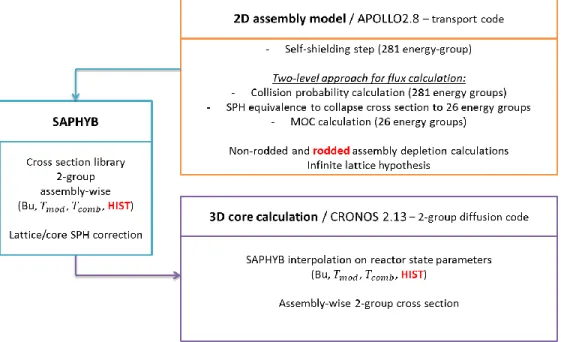
The so-called improved computational model has been derived from the standard one by adding a new reactor state parameter called HIST which value is in the range of 0 to 1 (see Figure 4). HIST gives a measurement of the historical CR insertion rate.
At the assembly level, two depletion calculations are performed. In addition to the standard non-rodded depletion calculation (HIST = 0), a rodded assembly calculation is carried out (HIST = 1). Cross sections are then prepared based on these two depletion histories considering the standard reactor state parameters (Bu, Tmod, Tcomb) as perturbed conditions. The newly obtained cross section library is doubled in size as compared to the one generated with the previous method.
At the core level, a new procedure has been developed to account for the HIST parameter. The cross section library is now interpolated for each mesh of the 3D model including the new HIST parameter. The historical CR insertion rate is assessed as follows:
𝐻𝐼𝑆𝑇(𝐵𝑢, 𝑟) = 1 𝐵𝑢(𝑟)∫ 𝐼𝐶𝑅 𝐵𝑢(𝑟) 0 (𝐵𝑢 ′, 𝑟)𝑑𝐵𝑢′ Where 𝐼𝐶𝑅(𝐵𝑢′, 𝑟) = { 0 𝑖𝑓 𝐶𝑅 𝑖𝑠 𝑒𝑥𝑡𝑟𝑎𝑐𝑡𝑒𝑑 1 𝑖𝑓 𝐶𝑅 𝑖𝑠 𝑖𝑛𝑠𝑒𝑟𝑡𝑒𝑑
The value of the HIST parameter through the core is determined step by step as the core depletion proceeds.
Figure 4 : Computational model including a capability to model CR history effects (in red : differences with the standard computational model)
4. NUMERICAL RESULTS
To determine the impact of the CR history, calculations with and without the HIST parameter have been conducted and compared. First, we show the differences for a 2D assembly depletion calculation (see section 4.1). Then, a 3D core depletion calculation is performed with these two methods (see section 4.2). 4.1. Assembly Depletion Calculation
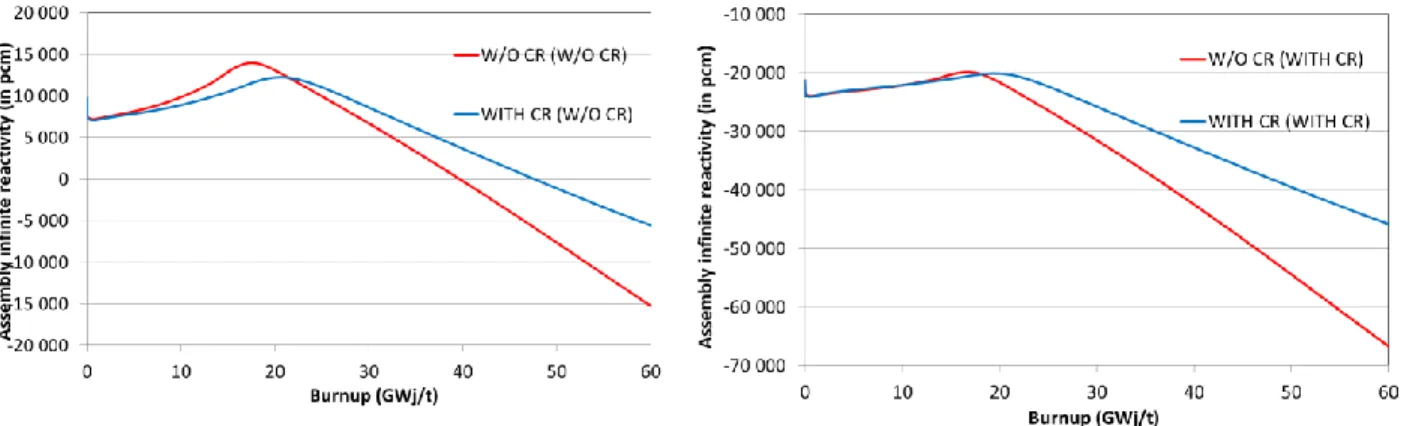
Figure 5 compares the prediction of assembly reactivity for the two methods in two different configurations:
- W/O CR (W/O CR) is the reactivity of the non-rodded assembly that depletes with CR extracted - WITH CR (W/O CR) is the reactivity of the non-rodded assembly that depletes with CR inserted - W/O CR (WITH CR) is the reactivity of the rodded assembly that depletes with CR extracted - WITH CR (WITH CR) is the reactivity of the rodded assembly that depletes with CR inserted As observed, inclusion of CR history effects produces a bias in the assembly reactivity. For the non-rodded assembly, omitting the CR insertion results in an over-prediction of the reactivity of 2500 pcm at
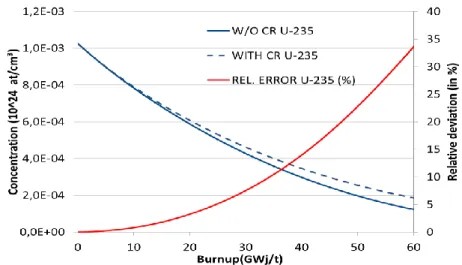
15 GWd/t. After 20 GWd/t, the standard calculation under-predicts the reactivity. The deviation is around 5000 pcm for a burnup of 45 GWd/t which is a value representative of the assembly discharge burnup. Figure 6 and Figure 7 compare the U-235 depletion and the plutonium buildup (Pu-239 and Pu-241) with and without the presence of the CR. As expected, the U-235 depletes more importantly if CR is out due to the more thermal neutron energy spectrum. We also observe a slower increase of plutonium isotopic concentrations in this case. The harder neutron spectrum when the CR is inserted implies a more important breeding of U-238 into Pu-239 and Pu-241. These differences in isotopic production and depletion are responsible for the differences in reactivity discussed above. For a burnup below 20 GWd/t, the plutonium buildup due to the insertion of a CR induces an increase in the neutron absorption and a reduction of the reactivity. After 20 GWd/t, the U-235 concentration has been reduced by more than 50% and many fission reactions are due to plutonium isotopes. The increased plutonium content results in a rise of reactivity for the “WITH CR” configuration for burnups superior to 20 GWd/t.
In Figure 8, we compare the CR worth for the two methods. The CR worth is expressed as (in pcm). 𝐶𝑅𝑤= 105(𝜌
𝑊/𝑂 𝐶𝑅− 𝜌𝑊𝐼𝑇𝐻 𝐶𝑅)
This value has been computed with two depletion histories, namely with CR inserted and with CR extracted. Inclusion of CR history effects leads to a decrease of the CR worth. The CR worth reduction remains reasonable for a low burnup but the difference is significant for fully burnt assembly. The standard computational model over predicts the CR worth by around 5% for an assembly burnt at 15 GWd/t. This difference results from the reduced fissile content in the standard calculation (e.g. greater U-235 depletion and lower plutonium buildup) which leads to a more important neutron flux and therefore an increased CR worth in this case.
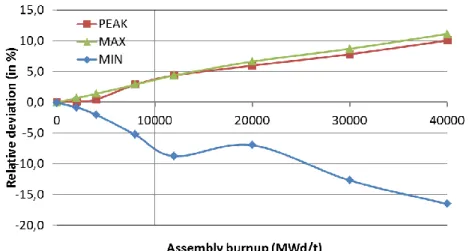
Figure 9 depicts the pin power difference when calculated with CR inserted and extracted during the assembly depletion. The minimum, maximum and peak values are computed and compared. The peak value is of particular interest since it is related to the fuel temperature centerline and is therefore a safety concern. We observe that the pin power peak is under predicted with the current model. The CR insertion induces a slow depletion of the fuel pins surrounding the CR. After the CR extraction, an increased pin power is obtained at that location due to a reduced burnup of these fuel pins. In addition, the presence of a water hole increases the local moderator-to-fuel ratio which accentuates this effect. Using a new methodology accounting for CR history effects yields significant improvements with respect to the conventional methodology. For instance, a 5% deviation is computed if the CR is constantly inserted during 15 GWd/t.
Figure 6 : Comparison of U-235 depletion with and without the presence of a control rod (assembly-wise)
Figure 7 : Comparison of plutonium buildup with and without the presence of a control rod (assembly-wise)
Figure 9 : Comparison of pin power distribution with and without the presence of a control rod during assembly depletion
4.2. Core Depletion Calculation
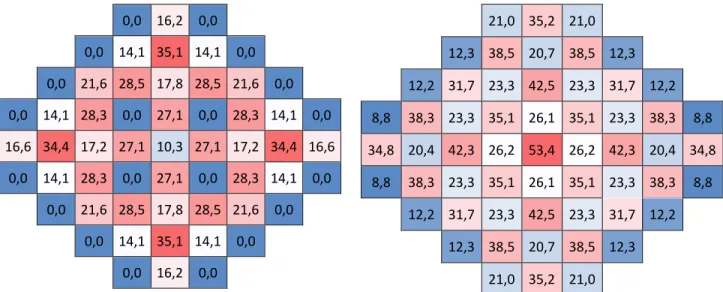
The equilibrium cycle has been computed for the core described in Figure 2. Both standard and improved computational models have been applied and compared. Main core parameters are provided in Table 1. Assembly-wise HIST and burnup profiles are displayed on Figure 10. Regarding the HIST parameter, a maximum value of 35% is found at End-Of-Equilibrium-Cycle (EOEC). Considering discharged assemblies only, the maximum CR historical rate is around 16%. The cycle length has also been computed for both models. Neglecting the CR history induces a 3.5% error on this parameter (overestimation). In section 4.1, Figure 5 showed us that the assembly reactivity is reduced when history effects are modeled for burnups inferior to 20000 MWd/t. The opposite behavior is observed for burnups greater than 20000 MWd/t. Given the core averaged CR historical insertion rate (~15%) and the core averaged burnup of Figure 10 (~36000 MWd/t), overlooking the history effects introduces an overestimation of the core reactivity and therefore of the cycle length.
Table 1 : Main parameters for standard and improved computational model
Model Standard Improved
Cycle length (MWd/t) 18393 17790
Cycle length (FPD) 586 566
Core averaged CR historical
rate HIST (%) 0 15,2
Figure 11 gives the 1D axial burnup profile and HIST profile at EOEC. A 5-cm axial meshing is used for core calculations. Since CRs are inserted during irradiation, the upper part of the core is under irradiated as compared to the bottom part. As discussed above, the CR insertion history induces a decrease of reactivity for low burnups (around 20 GWd/t). The axial burnup profile indicates that such low burnups are reached in the upper part of the core at EOEC. As a consequence, accounting for history effects during depletion tends to relocate the EOEC power distribution toward the lower part of the core (see the 1D axial power profiles at EOEC in Figure 11). Since the power peak is located in the upper part of the core at EOEC, the improved computational model yields a reduced EOEC power peak.
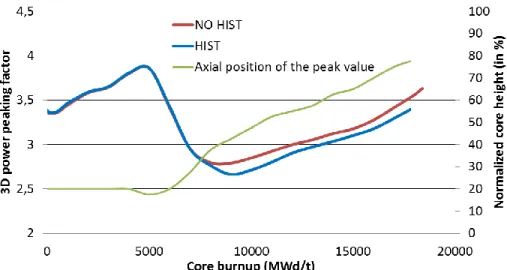
Figure 12 shows the 3D power peaking factor (F3D) as calculated by the standard and improved computational model. This value is assembly-wise which means that it does not incorporate the pin power distribution calculated at the assembly level (see Figure 9). During the first part of the cycle, the F3D is not affected by the model used for evaluation. After 8000 MWd/t, it is seen that the F3D value is over predicted by the standard method by around 5%. This deviation between standard and improved computational models is concomitant with the modification of the power peak axial position. At Beginning-Of-Equilibrium-Cycle (BOEC), the power peak is located in the lower part of the core due to CR insertion and moderator density effect. The power peak location progressively goes up due to CR withdrawal and ends at 80% of core height at EOC. The lower F3D value obtained for the improved model after 8000 MWd/t results from the lower axial power peaking factor analyzed above.
0,0 16,2 0,0 0,0 14,1 35,1 14,1 0,0 0,0 21,6 28,5 17,8 28,5 21,6 0,0 0,0 14,1 28,3 0,0 27,1 0,0 28,3 14,1 0,0 16,6 34,4 17,2 27,1 10,3 27,1 17,2 34,4 16,6 0,0 14,1 28,3 0,0 27,1 0,0 28,3 14,1 0,0 0,0 21,6 28,5 17,8 28,5 21,6 0,0 0,0 14,1 35,1 14,1 0,0 0,0 16,2 0,0 21,0 35,2 21,0 12,3 38,5 20,7 38,5 12,3 12,2 31,7 23,3 42,5 23,3 31,7 12,2 8,8 38,3 23,3 35,1 26,1 35,1 23,3 38,3 8,8 34,8 20,4 42,3 26,2 53,4 26,2 42,3 20,4 34,8 8,8 38,3 23,3 35,1 26,1 35,1 23,3 38,3 8,8 12,2 31,7 23,3 42,5 23,3 31,7 12,2 12,3 38,5 20,7 38,5 12,3 21,0 35,2 21,0
Figure 10 : Historical CR insertion rate (HIST) and 2D burnup profile (in GWd/t) per assembly at EOEC (in%)
Figure 11 : From left to right: 1D axial burnup profile (in MWd/t), historical CR insertion rate (in %), 1D normalized axial power profile for standard and improved computational models at EOEC
5077 6171 9920 13956 18082 21995 25410 28183 30225 31711 32775 33710 35374 36959 37309 37033 36012 33900 30064 23195 45 45 41 35 29 22 18 14 13 13 13 14 8 0 0 0 0 0 0 0 0,97 1,22 1,78 2,12 2,22 2,12 1,89 1,62 1,34 1,10 0,89 0,71 0,56 0,44 0,35 0,29 0,25 0,22 0,19 0,15 0,77 1,08 1,58 1,93 2,09 2,07 1,91 1,68 1,43 1,20 0,98 0,79 0,63 0,50 0,40 0,33 0,28 0,25 0,21 0,17
Figure 12 : Comparison of 3D power peaking factor with and without CR history (standard and improved computational model)
5. CONCLUSIONS
A new methodology has been developed and applied for modeling CR history effects at the core calculation level. This methodology relies on the use of a new reactor state parameter HIST which estimates the historical CR insertion rate through the core. By tracking the real history of each individual assembly and fuel rod, the new methodology allows the core code to predict more accurate power distribution, CR worth and local isotopic production.
For future work, the capability to model the isotopic depletion of CR isotopes should be implemented into the model to improve the core performance and safety predictions. In addition, the present CR history effects modeling has to be validated against reference deterministic depletion calculations.
REFERENCES
1. R.D. Mosteller, “Impact of moderator history on physics parameters in pressurized water reactors”. Nucl. Sci. Eng. Volume 98 (2), 149–153 (1988).
2. A. Dall’Osso, G. Hobson, “Modeling local history effects in the nodal code ARTEMIS”, Int. Conf. on Mathematics and Computational Methods applied to Nuclear Science and Engineering, Jeju, Korea, April 16-20 2017.
3. D. Tomatis et al., “Quantification of history effects in PWR modelling”, Nuclear Engineering and Design, 325, 205-217 (2017)
4. R. Sanchez et al., “APOLLO2 year 2010,” Nuclear Engineering and Technology, Korean Nuclear Society, Volume 42(5), pp 474-499 (2010).
5. N. Hfaiedh and A. Santamarina, “Determination of the optimized SHEM mesh for neutron transport calculation”, Proc. Int. Conf. on Mathematics and Computation, M&C2005, Avignon, September 2005.
6. J-F Vidal et al., “New modelling of LWR assemblies using the APOLLO2 code package”, Proc. Int. Conf. on Mathematics and Computation, M&C2007, Monterrey, April 2007.
7. J.J. Lautard et al., “CRONOS a modular computational system for neutronic core calculation”, Specialist IAEA meeting, Advanced Calculational Methods for Power Reactors, Cadarache, France, 1990