HAL Id: hal-00676237
https://hal.archives-ouvertes.fr/hal-00676237
Submitted on 4 Mar 2012HAL is a multi-disciplinary open access
archive for the deposit and dissemination of sci-entific research documents, whether they are pub-lished or not. The documents may come from teaching and research institutions in France or abroad, or from public or private research centers.
L’archive ouverte pluridisciplinaire HAL, est destinée au dépôt et à la diffusion de documents scientifiques de niveau recherche, publiés ou non, émanant des établissements d’enseignement et de recherche français ou étrangers, des laboratoires publics ou privés.
Design Optimization Methodology for Power Converters
based on Global Energy Requirement Criteria.
Application to a Flyback DC-DC Structure
Cédric Jaouen, Bernard Multon, Franck Barruel
To cite this version:
Cédric Jaouen, Bernard Multon, Franck Barruel. Design Optimization Methodology for Power Con-verters based on Global Energy Requirement Criteria. Application to a Flyback DC-DC Structure. European Power Electronic 2011, Aug 2011, BIRMINGHAM, United Kingdom. 10p. �hal-00676237�
Design optimization methodology for power converters based on global
energy requirement criteria. Application to a DC-DC flyback structure
Cédric JAOUEN
(1,2), Bernard MULTON
(2), Franck BARRUEL
(1)CEA-INES
(1)50 Av. du lac Léman - Le Bourget du lac, France
SATIE, ENS Cachan Bretagne, CNRS, UEB
(2)Av. Robert. Schuman - Bruz, France
Tel.: +33 / (0) – 4.79.44.46.89
E-Mail: [email protected], [email protected],
[email protected]
URL:
www.cea.fr
,
www.satie.ens-cachan.fr
Keywords
«DC power supply», «Design», «Life Cycle Analysis (LCA)», «Device modeling».
Abstract
This paper discusses a design methodology for power electronic converters according to the Global Energy Requirement (GER) criterion, i.e. the primary energy consumption over their entire life cycle. For given specifications of the converter, each power component of a self-oscillating flyback converter and the main control parameters are optimized using scaling laws for given technologies. Models linking sizes of components, loss parameters and embodied energy parameters are presented. Finally a comparison is realized between a GER-designed converters and a classical one (designed from thermal criteria) which concludes to an improvement of efficiency for a given consumption profile.
Introduction
Nowadays, converters are currently designed to present the best cost and/or volume under thermal constraints, or to present the best efficiency (at rated power level) under cost and/or volume constraints [1]. However, we think that optimizing the design should be done on the overall life cycle by taking cumulated losses and embodied energy into account. More and more manufacturers communicate about their environmental friendly product through an Environmental Product Declarations (EPD) [2]. This EPD is based on a Life Cycle Assessment (LCA) which evaluates all the environmental impacts caused by their product during their whole life cycle, i.e from raw material extraction to its recycling or disposal. Contrary to the LCA approach which is an a posteriori demarche, this paper proposes to eco-design converters in order to take its environmental impacts (here, only its global primary energy consumption) into account a priori. Such demarche has already been used to design transformers and single phase induction motors in [3]. The proposed approach takes place in the building DC distribution scheme context, but the methodology could easily be extended to other ones. Indeed, considering the DC distribution scheme appears to be more and more relevant due to the development of distributed renewable energy sources, which may produce direct current, and most existing electric loads could be powered with direct currents [4]. Moreover, electronic loads seem to be at present ready to be DC-powered because they intrinsically work with direct current; consequently, we choose to consider their power supply first. As shown in [4], the DC-DC stage of electronic load power supply is widely made with flyback converters controlled in self-oscillating mode. That is why this article focuses on a flyback DC-DC converter in order to develop the design optimization methodology of power converters with environmental concern in mind.
First, we will explain our overall approach for the design optimization of converters. Then we will expose the models used to assess the converters environmental impacts. Based on these models, we will carry out a parametric study to evaluate the impact of component dimensions and control
parameters (frequency, duty cycle) on the converters impact. Finally, we will compare an eco-designed flyback converter with a “classically eco-designed” one (components sized according to thermal constraints and control parameters chosen to minimize the losses cumulated overall life).
I. Converter design approach and hypothesis
1. Energetic impact and methodology
We propose a converter design methodology according to its environmental impacts. However, a full LCA approach focuses on numerous impacts, from primary energy consumption to Emissions to water, air or land etc... Since directives, like REACH and RoHS, already regulate the use of chemical product in order to limit the emissions, we propose to focus only on the primary energy consumption impact also called the Global Energy Requirement (GER). The GER represents the amount of primary energy consumed by the system over its entire life cycle, i.e. the losses during its use phase (converted into primary energy using the efficiency of electricity production) and the embodied energy related to the other steps of its life cycle. The losses are linked to the component loss characteristic parameters (like the Equivalent Series Resistance (ESR) for capacitors) which are related to the component dimensions. The embodied energy also depends on component size. For instance, increasing the component sizes generally inducesa decrease of its losses, but an increase of its embodied energy, and
vice versa. Therefore, we have chosen to modify the dimensions of a reference component using
homothetics factors (Hmag, Hdiode, Hcapa, Hswitch) in order to find the optimal component sizes which minimize the flyback converter GER, as shown in Fig. 1. These homothetic factors will be applied to transformer and capacitor volume (VCore; Vcapa) whereas it will be applied only to diode and MOSFET area (Adiode, Aswitch).
Fig. 1: Design optimization method based on scaling laws and scheme of the considered Flyback (component represented in dotted line are not taken into account)
Moreover, the losses being related to the control parameters (FSw, α) too, we propose to study their effect on the flyback converter GER. Since those parameters have an influence on components constraints we choose to consider one reference component for one set of control parameters. For each component, a reference component will be choosen according to the following criteria:
• For magnetic component, the reference component corresponds to the smallest component respecting the thermal constraints (θcopper<120°C, θferrite<100°C).
• For semiconductors, the reference component is the component for which breakdown voltage and current rating are equal to voltage and current constraints.
• For filtering capacitors, the reference component is chosen according to the maximum acceptable voltage ripple and acceptable current rms value.
All those reference components are defined at the rated power level and will represent the unitary homothetic factors.
Fig. 2 represents the proposed synopsis to design the flyback converter which minimizes its GER for a given set of control parameters. For each set of control parameters, the constraints on the components allow us to determine the reference components dimensions using a pre-sizing step at the rated power level. Then, the homothetic factor modifies those dimensions and changes its losses characteristic parameters and its embodied energy. Finally we use an optimization algorithm to find the optimal homothetic factor (according to the consumption profile and the life span) for each control parameters, considering the following hypothesis:
• the voltage drop effect from one component to another is neglected • the flyback is controlled in self-oscillating mode
We can then consider that the optimal flyback converter is made of components which have been optimized independently. All the relations which are necessary to determine dimension from electrical constraints and losses characteristic parameters from dimension are presented in the next chapter.
Fig. 2: Eco-design synopsis for flyback converters
2. Scope of the study
As presented in Fig. 1, we propose to design a flyback converter controlled in self-oscillating mode. Fundamentally, a flyback DC-DC converter is mainly composed of an inductor, a switch, a diode and several capacitors. Moreover, snubbers and heatsinks are currently added to the switch and the diode. However, for this first study, these last elements are not taken into account. We considered multicellular planar MOSFETs for the switch, Schottky diodes, aluminum electrolytic capacitors and inductor realized with two “E core” made with N97 ferrite materials.
Fig. 3: (Left) Example of assumed daily load profile and its statistical distribution (Right) Charge and use phase Only use phase
As a first example, we propose to consider the case of a laptop power supply. In this case, the flyback converter will be optimized according to a 70W rated power level, a 20V output voltage level and a 320V input voltage level (output voltage level for a diode bridge rectifier connected on the French utility grid). Moreover, we will arbitrarily consider a 5 years life span with a 90 minutes daily use according to a measured profile (divided in two phases: use and charge and only use) presented Fig. 3
II. Evaluation of flyback converters GER: losses and embodied energy
models
1. Magnetic component GER models
Losses inside magnetic component (inductor with two coils) are divided into copper losses and magnetic losses in the core. In this study we have neglected the magnetic losses in the windings. Ferrite materials magnetic losses are documented inside datasheets by curves representing losses by unit of volume versus induction and frequency for sinusoidal induction waveforms. However, the induction is not sinusoidal inside flyback converters. [5] proposes a model for triangular induction based on Double Natural Steinmetz Equation (DNSE). The DNSE coefficient is determined from datasheet curves with an average accuracy of 6%. This model is established according to 18 points with an induction from 12mT to 200mT and a frequency from 100kHz to 1MHz. We give the obtained model for the N97 ferrite materials at the equation (1) where D is the duty cycle and Pr is a reference volume losses for a reference induction Br and frequency fr extracted from the datasheet.
( )
( )(
( ))
( ) ( ) ( ) 1 1 2 0 3 r ˆ ˆ ˆ , ˆ 1 ˆ 2 1 ( ) 1 2 cos 2.31 3.4 2.15 0.19 300 / 200 100 vol r r r r r r r r f B f B P f B P P D D K f B f B K d with P kW m B mT f kHz β α γ α α α π α α δ δ α α π ϑ ϑ α β γ δ − − ⎛ ⎞ ⎛ ⎞ ⎛ ⎞ = × × ×⎜⎜ ⎟⎟ + × − ×⎜ ⎟ ×⎜⎜ ⎟⎟ × × + − × ⎝ ⎠ ⎝ ⎠ ⎝ ⎠ = × = = = = = = =∫
(1)Now, for the evaluation of embodied energy, we consider a transformer made by ferrite and enamel coated copper wire wound on a PVC coil former (due to lack of data for other glass reinforced polymer materials). Our evaluation is based on following data:
• [6] estimates at 12.6 kWhp/kg the amount of primary energy necessary to produce one kg of copper wire without insulation.
• [7] estimates at 3.6 kWhp/kg the amount of primary energy needed to coat one kg of wire with insulating enamel.
• [8] estimates at 8 kWhp/kg the amount of primary energy to produce one kg of ferrite material. • [9] estimates at 16.5 kWhp/kg the amount of primary energy necessary to produce one kg of
PVC.
Since losses and embodied energy are linked with the magnetic component volume, the homothetic factor will be applied on all core dimensions. Therefore, the component volume increases with the cubed homothetic factor. The ratio between all core dimensions will be then considered as constant and based on a reference magnetic circuit E10/5.5/5 from EPCOS. Only the air gap and the number of turns (primary and secondary coils) will be adjustable regardless of other dimensions.
2. Semiconductor component GER models
For semiconductor component losses, due to ZCS (due to self-oscillating mode), diode switching and MOSFET turn-off switching losses will be neglected. The loss assessment is based on the hypothesis proposed in [10] for the MOSFET switching losses and on classical expression for the conduction losses inside both diode and MOSFET. All these expressions are given in equation (2).
_ max 2 _ _ _ 2 0 _ 1 2 ds sw G
sw cond dson sw rms sw com sw
G diode f D F D rms BV I Q P R I P f I P V I R I × × ⎛ ⎞ = × = ⎜ ⎟× ⎝ ⎠ = + (2)
For the gate current IG, we choose to consider a value of 1A independent from the current rating, the breakdown voltage and the control parameters. Other scenarios have been studied but are not presented here. The drain source resistor Rdson and the total gate charge QG will be calculated with relations associating the Factor Of Merit (FOM in Ω.C) and the specific resistance (Ω.m²) with the breakdown voltage BVds [11]. This relation and the one which links the die area with the breakdown voltage and current rating were established according to the HyperFET IXYS MOSFET Family [12]. This family contains MOSFET with breakdown voltage from 200V to 1200V and current rating from 3A to 180A. Those relations present respectively a 16%, 10% and 10% average accuracy for 31 references and are given in equation (3).
1.83 1.95 6 3 * max ( . ) 0.3 ( ) * ( . ²) 0.086 ( ) ( ²) (5 10 5.7 10 ( )) ( ) ds dson Switch ds Switch ds FOM m nC BV V R S m mm BV V S mm − − BV V I A Ω = × Ω = × = × + × × (3)
Concerning the diode, the threshold voltage Vf0 is considered constant, whatever the current rating IF, with a value of 0.1V. The dynamic forward resistor RF has been linked with the die area and the breakdown voltage VRM. The die area is associated with the current rating IF. This relation was established according to the Vishay Shottky diode catalog containing 37 references [13]. Those relations present respectively a 26% and 15% average accuracy and are given in equation (4).
0.527 34 ( ) ( ²) 0.68 ( ) ( ) ( ²) RM Diode F F Diode V V S mm I A R m S mm × = × Ω = (4)
The assessment of embodied energy for semiconductor is based on data coming from [14]. This data (EGTO220) estimates at 522 Whp the amount of primary energy which is necessary to produce one transistor encapsulated inside a TO220 package. Other data coming from a semiconductor manufacturer (MOSFET on 6’’wafer) allow us to estimate at about 400 Whthe cost of final wafer processing (for a 20 mm² area and 10 mils thickness die). Then it appears that the embodied energy for MOSFET is mainly due to wafer processing. For a given MOSFET or diode die area, we divide it with the maximum die area acceptable inside a TO220 package (202 x 150 mils) [15] and we apply the result to the data EGTO220, as shown equation
(5)
.220 220 220 220 Diode Switch Diode TO Switch TO TO TO S S EG EG EG EG S S = = (5)
Since the die thickness remains constant for a given series of components, we have chosen to apply the homothetic factor only on the die and case set. Therefore, the component area increases with the squared homothetic factor.
3. Electrochemical capacitor GER models
The losses of power capacitors filtering the input and output voltage are represented by the Equivalent Series Resistance (ESRin, ESRout) according the expression (6) where IC_in_rms and IC_out_rms represent the RMS value of the capacitor current.
2 2
_ _ _ _ _ _
capa in in C in rms capa out out C out rms
P =ESR I P =ESR I (6)
Studying the B43851 and B41851 electrolytic capacitor series from EPCOS manufacturer [16], allows us to associate capacitor ESR with capacitor volume and breakdown voltage. The models presented in equation (7) give those two relations; the first one is valid for small voltage level corresponding to B41851 series (6,3V Æ 100V) and the other one for higher voltage level (160V Æ 450V). The first one will be apply for output capacitor and the second one for the input capacitor. Those relations present respectively an average accuracy of 12% and 18%.
0.60 1.09 1.43 1.2
85 6.1
out out out in in in
ESR = ×U ×Vol− ESR = ×U ×Vol− (7)
The assessment of embodied energy is based on [17], which estimates at 261 kWhp/kg the primary energy needed to produce one kg of through-hole mounting capacitor. This analysis of electrolytic capacitor series allows us to set an average density of 1460 kg/m3 for “low voltage” capacitor and 722 kg/m3 for “high voltage” capacitor.
Since ESR and embodied energy are linked with the capacitor volume, we have chosen to apply the homothetic factor on the capacitor volume. Therefore, the capacitor volume increase, like the magnetic component volume, with the cubed homothetic factor.
III. Homothetic factor effects on the magnetic component GER
This section brings some results about the effect of the homothetic factor on the magnetic component GER. For this analysis, the control parameters will be fixed, as a first example, to 100kHz for the rated switching frequency and 0.5 for the duty cycle. Fig. 4 represents the methodology for the evaluation of the magnetic component GER for given control parameters and homothetic factor. A pre-design is made for a given set of control parameters at the rated power level. This pre-design determines the reference magnetic component which corresponds to the smallest core respecting the thermal constraints (a simplified steady state thermal model is used to compute the ferrite and copper temperature). Then, for each evaluation of homothetic factor, the dimensions and the loss characteristic parameters are computed. However, those elements depend on the air gap value which is optimized in order to minimize the losses on the case study power profile (highlighted part of synopsis). The range of air gap will be limited by a maximum flux density constraint. It is important to notice that, due to the choice of the self-oscillating mode, the switching frequency change with the power level (as shown in Fig. 4), unlike duty-cycle which is constant according to the assumptions on voltage losses, for the evaluation of losses during use. Finally the GER is evaluated according to the component optimized dimensions and the corresponding losses.
Fig. 4: (Left) Magnetic component eco-design methodology (Right) Ratio between switching frequency and rated switching frequency versus time for the Fig. 3consumption profile described in Fig. 3 and Evolution of magnetic component GER according to the homothetic factor for given control parameters (FSw=100kHz & α=0.5)
The bottom right graph of Fig. 4 represents the GER evolution according the homothetic factor value. We can first remark that an optimal homothetic factor exists due to the decrease of losses and the increase of embodied energy with the increase of homothetic factor. We can also observe that this optimal homothetic factor is bigger than one. In other words, for our assumption on load power profile and life duration, the optimal magnetic component is bigger than the smallest one respecting only the thermal constraints. It is important to notice that longer the use duration is, higher the optimal homothetic factor is, and inversely.
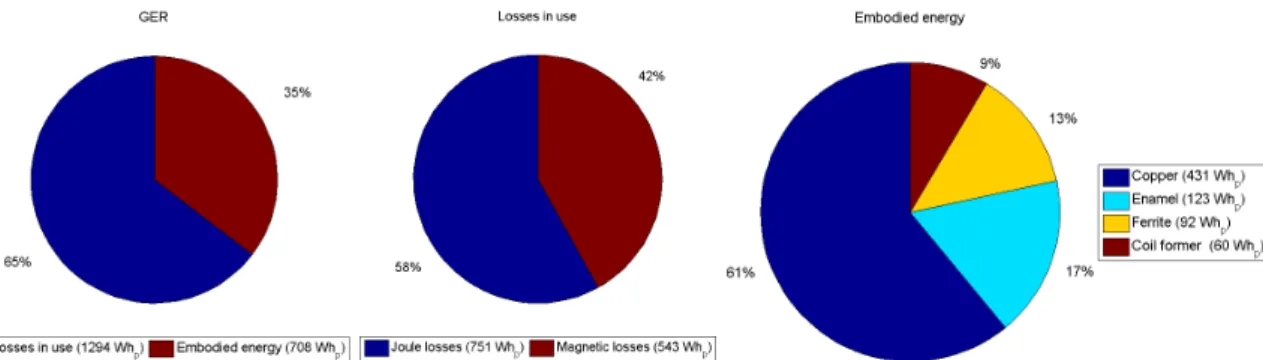
Fig. 5: Repartition inside GER, losses in use and embodied energy for the optimal homothetic factor Fig. 5 represents the repartition of losses and embodied energy for the GER, as well as the repartition of copper and magnetic losses during use, and finally the details of the embodied energy for the optimal homothetic factor corresponding to this example. This repartition will be the same for other case studies, on condition that the optimal air gap is different from the minimum one imposed by induction constraints and thermal constraints. For the embodied energy repartition, we can see that the wiring (composed by copper and enamel) will be preponderant comparing with the core and the coil former, even if the reference component imposes a copper volume smaller than the core one.
For the other components, the approach is the same as the one presented for the magnetic component. A pre-sizing has been carried out at the rated power level, and then homothetic factors modify the main component dimensions to assess cumulated losses during use and embodied energy for evaluating its GER. The same study realized for the different components points out that they present an optimum GER for a scaling factor upper than one. In other words, according the GER point of view, it is greater to oversize the components compared to a basic sizing method which is based on the thermal and electric constraints. However, it’s important to notice that longer the running duration is, bigger the homothetic factor is and inversely.
IV. Influence of control parameters (F
Sw, α) on flyback GER
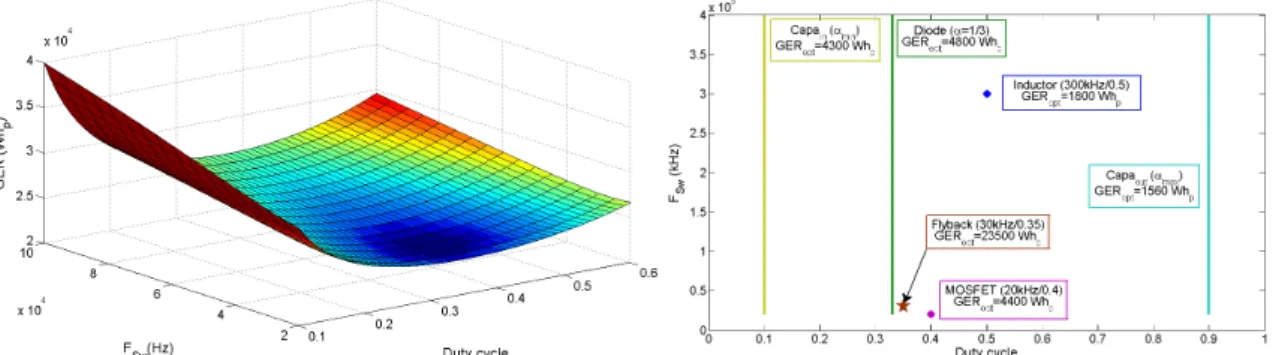
As we have already explained, for the different set of control parameters, the homothetic factor of each component will be optimized independently. Fig. 6 represents the evolution of the flyback converter GER, according to the rated control parameters. We can remark that an optimal set of rated control parameters minimizes the converter GER. The optimal parameters are 30 kHz for the rated switching frequency (at the rated power point), and 0.35 for the duty cycle. For these parameters the optimal GER is 23 kWhp.
In order to explain the location of the optimal set of parameters which minimizes the converter GER, we have analysed the position of optimal sets of parameters for each component independently, as shown in Fig. 6. The fact that the minimum GER is independent from the frequency for the diode is due to assumption of neglecting diode switching losses. For the capacitors, we have neglected the ESR variation according to the frequency, and then the minimum GER is independent from the frequency too. In fact, the frequency modifies the magnetic and switching losses, whereas the duty cycle alters the current rms values and the rated voltage constraints. We can also conclude that only the transistor and the magnetic component have an influence on the rated frequency choice. However, the transistor GER is bigger than the magnetic component one for each own optimal set of control parameters. Then the flyback optimal frequency tends to the MOSFET optimal frequency. For the duty cycle, it tends to
the closest value to the one which minimizes the GER of the most GER-important components which are input capacitor, diode and MOSFET.
Fig. 6: (Left) Evolution of the flyback converter GER according to the control parameters. (Right) location of optimal set of control parameters for each component independently and for the flyback converter
V. Comparison between an eco-designed flyback converter and a
“classical” one
As a first comparison, we propose to compare the eco-designed flyback with a “classical” one. For the classical one, the control parameters have been optimized in order to reduce the cumulated losses. For each control parameters, the components have been chosen according to thermal constraints using the pre-sizing step. Table I gives the main characteristics of the two flyback converters. Firstly we can remark that the optimal control parameters with a classical sizing method are 76 kHz for the rated frequency and 0.37 for the duty cycle. Since classical converter efficiency takes only the rated point into account, we have compared the two converters according to their energetic efficiency. The energetic efficiency is defined as the ratio between the load energy need and the energy which has been really provided to the system for a given power profile. The “classical” converter presents an energetic efficiency of 88% with the Fig. 3 power profile and a GER of 87 kWhp, whereas the eco-designed one presents an energetic efficiency of 97% and a GER of 23 kWhp. In fact, an eco-designed converter tends to increase the component dimensions, as we have already noted, and then reduces component losses.
Now look at the GER for the two converters. Fig. 7 represents the repartition of GER, cumulated losses during use and embodied energy corresponding to each component of the classical converter. We can remark that the losses during use are the main contributor inside the GER. They are approximately equally shared among the transistor, the diode and the capacitors. For the embodied energy, the output capacitor is dominant compared to the input capacitor due to the difference of mass density and volume. The semiconductor components are negligible compared to the other ones, due to the low mass of silicon relatively to the other component mass.
Fig. 7: Classical design case: component contributions inside flyback GER, embodied energy and cumulated losses
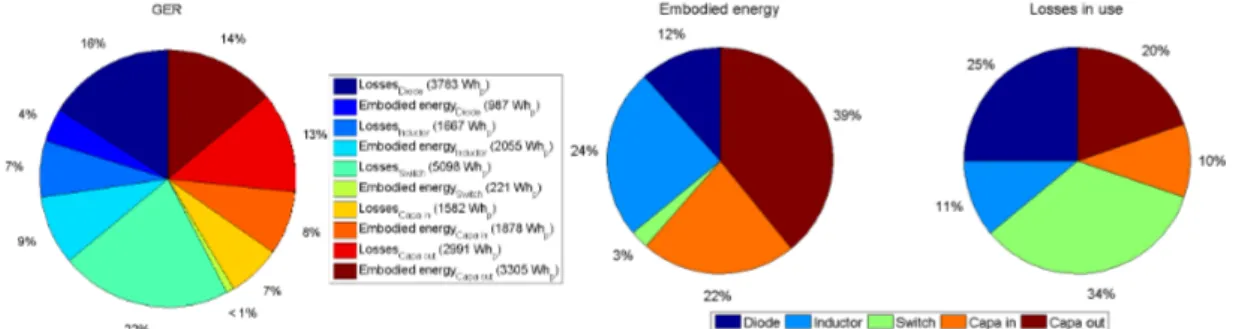
Fig. 8 represents the repartition of GER, losses in use and embodied energy, between the different components of the eco-designed converter. Since the components are bigger in the eco-designed converter than in the classical one, the proportion of embodied energy inside the GER is bigger. In this case the GER is approximately equally shared between all the components. Inside the embodied energy, the diode part is not negligible due to an important increase of die area comparing with the pre-sizing diode; however the output capacitor is the main contributor again.
Fig. 8: Eco-design case: component contributions inside flyback GER, embodied energy and cumulated losses
Table I: Main characteristics of two compared flyback converters
Eco-designed flyback converters Classically designed flyback converters Rated switching
frequency / duty
cycle 30 kHz / 0.35 76kHz / 0.37
GER / on cycle
efficiency 23 kWhp / 97% 87 kWhp / 88%
Components Losses characteristic parameters & dimensions Magnetic
component
e=0.9mm / Rprim=0.37Ω / Rsec=7 mΩ / N1=150 / m=0.12 / AeAw=17400 mm4
e=0.92mm / Rprim=0.67Ω / Rsec=11 mΩ / N1=157 / m=0.11 / AeAw= 2514 mm4
Transistor Rdson=1.9 Ω / Qg=13 nC / Ids=2.2 A / Ig=1A / Adie=8 mm²
Rdson=11 Ω / Qg=2.4 nC / Ids=0.5A / Ig=1A / Adie=1.5 mm²
Diode If=52A / Rf=8 mΩ / Adie=36mm² If=3.4A / Rf=120 mΩ / Adie=2.3mm²
Input capacitor ESR=1.6 Ω / Vcapa=10 cm3 ESR=22.5 Ω / Vcapa=1 cm3
Output
capacitor ESR=46 mΩ / Vcapa=7cm3 ESR=180 mΩ / Vcapa=2.5cm3
Conclusion
In this paper, we have proposed a new methodology in order to size converters based on the minimization of the primary energy which will be necessary along its whole life cycle. For this first approach of this very complex problem, the design problem has been greatly simplified and we are well aware that it would need more complex models. Indeed, this methodology uses conventional loss models associated with incomplete LCA data to assess the global energy requirement (GER) of a flyback converter. Since cumulated losses and embodied energy are generally linked with component dimensions, we have proposed models which link loss characteristic parameters, component dimensions and voltage and current ratings. Applying our approach to a flyback converter, we have shown that an optimal set of control parameter which minimizes the converter GER exists. Finally, we
have compared this eco-designed converter with a classically designed one, and we logically concluded that the eco-designed converter presents a better energetic efficiency in addition to a better GER. It is important to notice that the results, presented in the last section, depend on the assumptions which have been made on the power profile and the use duration. Despite the needs of assumption on the consumption profile and use, we think that our global energetic approach should be applied to any energetic system to reduce its life cycle primary energy consumption. This approach could be easily used with more complex losses models, and extended to other environmental impact.
The continuation of this paper will be the study about the effect of input voltage level on the converter GER. Then, this approach will be applied to other current converters in order to conclude about the best voltage level for a DC distribution scheme inside building.
References
[1] Schanen JL., Ferrieux JP., Guichon JM., Barbaroux J., Keradec JP., Maurel A.: Flyback Converter Surface Minimization: Design Procedure and Formulas, IEEE Power Electronics Specialists Conference, 2008. PESC 2008, Rhodes, Greece, 7p.
[2] Tolvanen CJ., Miettinen T.: A worthwhile investment, ABB Review: Green for growth, Feb. 2009.
[3] Debusschere V., Multon B., Ben Ahmed H., Cavarec P.E., Life cycle design of a single-phase induction motor, Electric Power Applications IET, Vol. 4 n°5, may 2010, pp.348 - 356.
[4] Jaouen C., Multon B., Barruel F.: Investigation of DC distribution by measuring and modeling power supply devices for buildings with PV production, EVER’10, Monaco, Monte Carlo, March 2010, 7p. [5] Van den Bossche A.P., Van de Sype D.M., Valchev V.C.: Ferrite loss measurement and models in half
bridge and full bridge waveforms, IEEE 36th Power Electronics Specialists Conference PESC’05, Recife, Brazil: 2005, 8p.
[6] Tikana L., Sievers H., Klassert A.: Life cycle assessment of copper product, European Copper Institute report, 2005
[7] Boughamni W., Roger D., Manata J.P., Brudny J.F, Frezel PH.: Comparative analysis of wire impregnating and different solutions of Thermo bonding (In French), CONFREGE, Toulouse: 2010, 7p.
[8] Hischier R., Classen M., Lehmann M., Scharnhorst W.: Life cycle invetories of electric and electronic equipment : Product use and disposal Part III §5, Eco-invent report n°18, Dec 2007
[9] Hischier R.: Life cycle inventories of packaging & graphical papers, part 2: Plastics, Ecoinvent report n°11, Dec. 2007
[10] John Shen Z., Xiong Y., Cheng X., Fu Y., Kumar P.: Power MOSFET switching loss analysis : a new insight, Conference Record of the 2006 IEEE Industry Applications Conference, Tampa, Finland: Oct 2006, 5p.
[11] Morancho F.: New limits for compromise between specific resistance and rated voltage for unipolar power components (In French), HDR, Toulouse, 2004
[12] MOSFET HyperFET dies catalog, Ixys website (http://www.ixys.com/), visited in Oct 2010.
[13] Vishay high performance Schottky diode dies catalog, Vishay website (http://www.vishay.com/die-wafer/schottky_die/), visited in Nov 2010.
[14] EIME database V11.0, 2009, EIME Website (http://www.codde.fr/page.php?rubrique=20)
[15] TO220 package dimension, PSI website (http://www.psitechnologies.com/products/todo220.php), visited in Nov 2010
[16] B41851 and B43851 electrolytic capacitor series datasheet, EPCOS website (http://www.epcos.com), visited in Nov 2010.
[17] « Capacitor for hole mounting assembly » LCA data in Chalmers university LCA database
(http://www.cpm.chalmers.se/CPMDatabase/Scripts/sheet.asp?ActId=ECOP3207), March 2000, visited in