HAL Id: cea-00819299
https://hal-cea.archives-ouvertes.fr/cea-00819299
Submitted on 26 Jul 2020
HAL is a multi-disciplinary open access
archive for the deposit and dissemination of sci-entific research documents, whether they are pub-lished or not. The documents may come from teaching and research institutions in France or abroad, or from public or private research centers.
L’archive ouverte pluridisciplinaire HAL, est destinée au dépôt et à la diffusion de documents scientifiques de niveau recherche, publiés ou non, émanant des établissements d’enseignement et de recherche français ou étrangers, des laboratoires publics ou privés.
complex to stimulate type III interferon response
Alice Lebreton, Goran Lakisic, Viviana Job, Lauriane Fritsch, To Nam Tham,
Ana Camejo, Pierre-Jean Matteï, Béatrice Regnault, Marie-Anne Nahori,
Didier Cabanes, et al.
To cite this version:
Alice Lebreton, Goran Lakisic, Viviana Job, Lauriane Fritsch, To Nam Tham, et al.. A bacterial protein targets the BAHD1 chromatin complex to stimulate type III interferon response. Science, American Association for the Advancement of Science, 2011, 331 (6022), pp.1319-21. �10.1126/sci-ence.1200120�. �cea-00819299�
A Bacterial Protein Targets the BAHD1 Chromatin Complex to
Stimulate Type III Interferon Response
Alice Lebreton1,2,3, Goran Lakisic4, Viviana Job5, Lauriane Fritsch6, To Nam Tham1,2,3,
Ana Camejo7, Pierre-Jean Matteï5, Béatrice Regnault8, Marie-Anne Nahori1,2,3,
Didier Cabanes7, Alexis Gautreau4, Slimane Ait-Si-Ali6, Andréa Dessen5,
Pascale Cossart1,2,3* and Hélène Bierne1,2,3*
1. Institut Pasteur, Unité des Interactions Bactéries Cellules, Paris, F-75015 France; 2. Inserm, U604, Paris, F-75015 France;
3. INRA, USC2020, Paris, F-75015 France.
4. CNRS UPR3082, Laboratoire d’Enzymologie et de Biochimie Structurales, Gif-sur-Yvette, F-91198 France.
5. Institut de Biologie Structurale, Bacterial Pathogenesis Group, UMR 5075 (CNRS/CEA/UJF), Grenoble, France.
6. CNRS UMR7216, Université Paris 7 Diderot, Paris, F-75013 France. 7. Institute for Molecular and Cell Biology, Porto, Portugal.
8. Institut Pasteur, Génopole, Paris, F-75015 France.
* To whom correspondence should be addressed. helene.bierne@inrae.fr; pascale.cossart@pasteur.fr
This is a post-print version of an article published by the American Association for the Advancement of Science in Science in March 2011, available online as doi:10.1126/science.1200120
One-sentence summary
A virulence factor secreted by Listeria monocytogenes alleviates BAHD1-mediated silencing of interferon-λ stimulated genes.
Abstract
Intracellular pathogens such as Listeria monocytogenes subvert cellular functions through the interaction of bacterial effectors with host components. Here we found that a secreted listerial virulence factor, LntA, could target the chromatin repressor BAHD1 in the host cell nucleus to activate IFN-stimulated genes (ISGs). IFN- expression was induced in response to infection of epithelial cells with bacteria lacking LntA; however, the BAHD1-chromatin associated complex repressed downstream ISGs. In contrast, in cells infected with lntA-expressing bacteria, LntA prevented BAHD1 recruitment to ISGs and stimulated their expression. Murine listeriosis decreased in BAHD1+/- mice or when lntA was constitutively
expressed. Thus the LntA-BAHD1 interplay may modulate IFN-−mediated immune response to control bacterial colonization of the host.
Listeria monocytogenes is a food-borne pathogen that can cause serious illness in pregnant women and immunocompromised individuals (1). This intracellular bacterium uses an arsenal of effectors to exploit cellular functions in various ways (2). Host cells respond to this invasion by turning on appropriate defense transcriptional programs (3). Listeria and other pathogens can manipulate chromatin to reprogram host transcription (4, 5). However, very few bacterial molecules have been shown to enter eukaryotic cell nuclei, and knowledge about microbial factors that may act directly on the chromatin-regulatory machinery is limited (6).
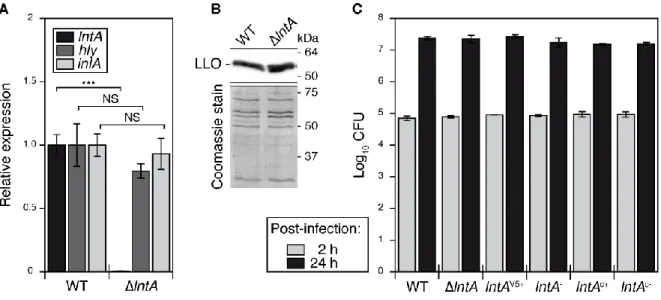
To identify factors involved in bacterial pathogenicity, we screened the L. monocytogenes strain EGDe genome for genes encoding secreted proteins absent in non-pathogenic Listeria species. lmo0438/lntA (listeria nuclear targeted protein A) was one such gene (fig. S1A). lntA was expressed at very low levels by the EGDe strain grown in brain-heart infusion (BHI) medium (fig. S1B, 7). Two major regulators of virulence genes, PrfA and B, were required
for basal lntA transcription (fig. 1A). lntA expression was significantly higher in bacteria harvested from spleens of infected mice 48 h after intravenous inoculation, compared to bacteria grown in BHI (fig. 1B). In addition, deletion of lntA led to a decrease in bacterial colonization of spleens and livers, as well as blood bacteraemia (fig. 1B). lntA thus contributes to L. monocytogenes virulence. It encodes a 205-amino acid basic protein with a N-terminal signal peptide but no sequence similarity with any known polypeptide. The 2.3 Å resolution structure of LntA reveals a compact -helical fold (fig. S2, PDB ID#2xl4).Consistent with low lntA transcription levels in vitro, LntA was undetectable in either total extracts or supernatants of wild type (WT) bacteria grown in BHI (fig. 1C).
To address the role of LntA during L. monocytogenes cellular infection, we generated strains that constitutively expressed lntA under the control of a heterologous promoter, either on the chromosome (lntAc+) or on a plasmid in fusion with the V5 tag (lntAV5+) (tables S1, S2). Both
strains produced and secreted LntA (fig. 1C and S1C), and showed no noticeable difference in entry or multiplication in cultured cells compared to the WT or lntA-deficient strains (lntA, lntA– or lntAc-) (table S3A, fig. S3). Secreted LntA accumulated in the nucleus of fibroblasts
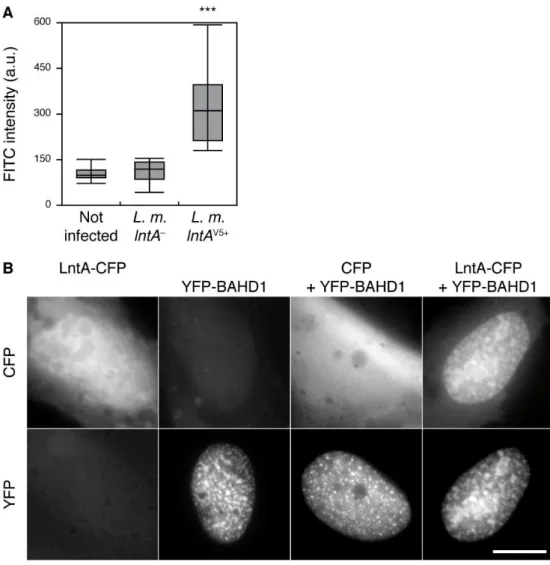
after 22 h of infection with lntAV5+ bacteria (fig. 1D and S4A). We thus assessed whether LntA
interacted with nuclear proteins in a large-scale yeast two-hybrid screen of a human cDNA library. One of the strongest LntA interactors was BAHD1, a silencing factor that orchestrates heterochromatin assembly at specific genes such as IGF2 (8). A fusion of LntA with glutathione-S-transferase (GST) pulled down V5-tagged BAHD1 from nuclear extracts, confirming the capacity of LntA to specifically interact with BAHD1 (fig. 1E). When produced ectopically in human fibroblasts, LntA co-localized with BAHD1-YFP-induced heterochromatin nuclear foci (8), both in fixed V5, fig. 1F) and in living cells (LntA-CFP, fig. S4B).
Because BAHD1 is involved in gene silencing, LntA might control host gene expression. To assess this hypothesis, we performed a transcriptome analysis of LoVo epithelial cells infected for 24 h either with lntAV5+ or lntA– bacteria (GEO database, GSE26414). The lntAV5+
bacteria specifically up-regulated the expression of a subset of genes, out of which 39 displayed more than a 2-fold induction (table S4). 83% of these genes belonged to the interferon-inducible genes regulon: 28 are known ISGs, including 3 genes (IL29, IL28A and IL28B) that encode type III interferons (IFN-1, -2 and -3), and 4 are predicted ISGs. LntA may thus play a role in the IFN-III-mediated immune response. This pathway controls various viral infections, especially in epithelial tissues (9-13).
We confirmed that WT L. monocytogenes triggered the expression of IFN-2 in intestinal LoVo and placental JEG-3 epithelial cells (fig. 2A; fig. S5A); type I IFN-1 was also induced, but type II IFN- was undetectable. However, the induction of downstream ISGs was modest
(fig. 2A), except for CCL5, which, like IFN- genes, is controlled both by NF-B and IRFs (fig. S9, 14). These data suggested that interferon signaling was down-regulated in infected cells. We wondered whether the host factor BAHD1 could act as a repressor of ISGs, as it does for IGF2 (fig. S4B, 8). Knockdown of BAHD1 had no or minor effect on ISG expression in non-infected LoVo cells (fig. 2B). However, infection of these BAHD1-depleted cells with L. monocytogenes induced the expression of several ISGs, highlighting that BAHD1 could act as a negative regulator of this pathway upon bacterial-triggered signaling (fig. 2B, S5B).
ISG expression is governed by IRF/STAT transcriptional activators and by chromatin structure regulators. Except for HP1 proteins, found as BAHD1 partners (8) and repressing ISGs (15), there is no reported link between BAHD1 and STAT signaling. To address whether BAHD1 was associated with other proteins involved in ISG regulation, we purified the BAHD1-associated complex from the chromatin fraction of HEK293 cells expressing His6
-Protein C-tagged BAHD1 (HPT-BAHD1) by tandem affinity chromatography (fig. 2C, S6). Mass spectrometry analysis of the complex revealed several polypeptides involved in chromatin and transcriptional regulation, including KAP1, HP1 and histone deacetylases HDAC1/2, as confirmed by immunoblots (fig. 2C). HDAC1/2 directly binds STAT (16), as does the scaffolding protein KAP1, which represses both basal and IFN-I-mediated STAT-driven transcription (17, 18). We investigated whether KAP1 also repressed ISGs during infection with Listeria. KAP1 knockdown induced ISG expression in non-infected cells, and bacterial infection greatly enhanced this induction (fig. 2B, S5C). The BAHD1/KAP1-corepressor complex thus inhibits ISGs downstream of IFN-III stimulation during L. monocytogenes infection.
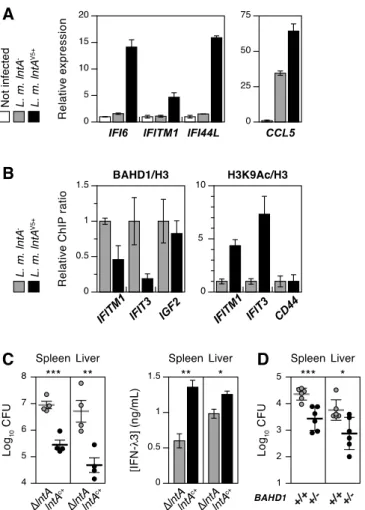
Because WT L. monocytogenes does not express lntA in vitro, we further explored the role played by LntA in the IFN-III signaling pathway using lntA-constitutive strains. In agreement with the transcriptome data (table S4), ISG expression was higher in LoVo cells infected with lntAV5+ (fig. 3A) or lntAc+ (fig. S5D) bacteria, compared to non-infected cells or lntA--infected
cells. This effect was observed only in epithelial cell lines (fig. S5E). The expression of CCL5 (fig. 3A) and IFN-2 (fig. S5F), which are ISGs themselves, was also increased upon infection with lntA-constitutive strains. Thus, LntA can activate ISGs specifically in Listeria-infected epithelial cells, phenocopying BAHD1 depletion (fig. 2B, S5B). As LntA interacted with BAHD1, we addressed whether it inhibited BAHD1-mediated silencing. Chromatin immunoprecipitation (ChIP) revealed that the recruitment of BAHD1 at the promoter of representative ISGs (IFIT3 and IFITM1) was impaired in lntAV5+-infected cells, compared to
lntA--infected cells (fig. 3B). This correlated with an enrichment of acetyl-H3K9 at these genes,
consistent with increased transcriptional activity (fig. 3A). Thus, by displacing the BAHD1/HDAC complex from ISGs, LntA de-represses these genes in infected cells (fig. S7).
Neither lntA expression (fig. S3, table S3), nor cellular stimulation with recombinant IFN-2 (fig. S8), altered bacterial infection in tissue-cultured LoVo cells. We thus assessed the consequences of LntA/BAHD1 interactions on the outcome of infection in vivo. To this end, (i) we infected BALB/c mice with lntA-constitutive or lntA-deficient bacteria and (ii) we generated C57BL/6 BAHD1+/- mice (fig. S9, S10) and infected them with WT bacteria. We
observed a strong decrease in bacterial burden in spleens and livers of BALB/c mice infected with lntAc+ or lntAV5+ relative to ∆lntA or WT bacteria, while the IFN-3 concentration
increased in infected organs (fig. 3C and S11). Thus, constitutive expression of lntA promotes the IFN-III response and decreases bacterial colonization in vivo. Moreover, in BAHD1+/- mice
infected with WT L. monocytogenes, the bacterial burden in organs was reduced compared to BAHD1+/+ mice (fig. 3D). Thus increasing lntA expression in Listeria had similar effects as
impairing BAHD1 expression in the host, i.e. decreasing infection. Furthermore, while controlled secretion of LntA by WT bacteria is beneficial to the pathogen, either its constitutive
secretion or its absence is detrimental. We propose that a tight control of lntA expression during infection allows Listeria to fine-tune localized immune responses and escape antibacterial response (19). Given the tropism of Listeria (20) and IFN-III (9-13) for epithelia, unraveling the role of LntA in these tissues is now a key issue. Our work identifies the BAHD1 complex as a negative regulator of ISGs in the context of listeriosis, and highlights the importance of chromatin remodeling in bacterial infections.
References
1. O. Dussurget, Int Rev Cell Mol Biol 270, 1 (2008).
2. P. Cossart, A. Toledo-Arana, Microbes Infect 10, 1041 (Jul, 2008). 3. S. C. Corr, L. A. O'Neill, Cell Microbiol, (Feb 2, 2009).
4. M. A. Hamon, P. Cossart, Cell Host Microbe 4, 100 (Aug 14, 2008). 5. K. Paschos, M. J. Allday, Trends Microbiol 18, 439 (Oct, 2010).
6. A. P. Bhavsar, J. A. Guttman, B. B. Finlay, Nature 449, 827 (Oct 18, 2007). 7. Methods are available as supporting material on Science Online.
8. H. Bierne et al., Proc Natl Acad Sci U S A 106, 13826 (Aug 18, 2009). 9. M. Li, X. Liu, Y. Zhou, S. B. Su, J Leukoc Biol 86, 23 (Jul, 2009).
10. R. P. Donnelly, S. V. Kotenko, J Interferon Cytokine Res 30, 555 (Aug, 2010).
11. M. Mordstein, T. Michiels, P. Staeheli, J Interferon Cytokine Res 30, 579 (Aug, 2010). 12. G. Gallagher et al., J Interferon Cytokine Res 30, 603 (Aug, 2010).
13. J. E. Pulverer et al., J Virol 84, 8626 (Sep, 2010). 14. A. Casola et al., J Virol 75, 6428 (Jul 1, 2001).
15. M. Lavigne et al., PLoS Genet 5, e1000769 (Dec, 2009).
16. I. Nusinzon, C. M. Horvath, Proc Natl Acad Sci U S A 100, 14742 (Dec 9, 2003). 17. S. Kamitani et al., Biochem Biophys Res Commun 370, 366 (May 30, 2008). 18. R. Tsuruma et al., Oncogene 27, 3054 (May 8, 2008).
19. Supporting discussion is available on Science Online. 20. M. Lecuit, Clin Microbiol Infect 11, 430 (Jun, 2005).
21. We thank E. Gouin for anti-LntA antibodies; J-Y. Coppee for microarrays facilities at the IP Genopole; S. Jacquot and M.C. Birling at the Targeted Mutagenesis and Transgenesis department of the Mouse Clinical Institute (MCI/ICS), where was generated the BAHD1+/- mouse line. Work in the Cossart laboratory received financial
support from the Pasteur Institute, INRA, INSERM, ANR-ERANET-PathoGenomics (grant SPATELIS), French Ligue Nationale Contre le Cancer (LNCC RS10/75-76 Bierne) and ERC (Advanced Grant 233348). P-J.M. received a PhD fellowship from Région Rhône Alpes. Work in the Cabanes laboratory was supported by FCT (PTDC-SAU/MII/65406/2006; PhD fellowship to A.C. SFRH/BD/29314/2006) and ERANET-PathoGenomics (grant SPATELIS). P.C. is an international research scholar of the Howard Hughes Medical Institute.
Figures
Fig. 1. The secreted virulence factor LntA targets the nuclear protein BAHD1. (A) lntA is
regulated by PrfA and B. qRT-PCR analysis of lntA levels in WT, ∆lntA, ∆prfA or ∆sigB
strains. (B) lntA is up-regulated and contributes to virulence 48 h post-infection in an intravenous mouse model. Left, qRT-PCR analysis of lntA and control lmo2845 levels in WT Listeria extracted from spleens. Right, bacteria were numerated in organ or mL blood from mice infected with WT or ∆lntA strains. (A-B) **, p < 0.01; ***, p < 0.001 (two-tailed T-tests). (C) LntA is a secreted protein. Bacterial total extracts (TE) and supernatants (Sn) of WT or lntAV5+ strains were analyzed by immunoblot, with ActA and InlC used as controls. WT bacteria
do not produce LntA in BHI. P, precursor; S, secreted. (D) LntA localizes to the nucleus of C3SV40 fibroblasts. V5 immunolabelling and DAPI staining in cells infected for 22 h with lntA– or lntAV5+ bacteria. (E) Purified LntA binds BAHD1. GST or GST-LntA were incubated
with nuclear extracts from CFP-V5 or BAHD1-V5 –expressing HEK293 cells. Immunoblots of inputs and eluted fractions were probed with -V5 or -GST antibodies. (F) LntA localizes to BAHD1-induced heterochromatin foci. BAHD1-YFP and either LntA-V5 or CFP-V5 were co-transfected into C3SV40 cells and detected by immunofluorescence. (D, F) Bars, 5 μm.
Fig. 2. The BAHD1 complex represses ISGs in Listeria-infected epithelial cells. (A)
qRT-PCR analysis of IFN and ISG expression in response to Listeria infection in LoVo cells infected for 16 h with WT L. monocytogenes, compared to non-infected cells. Left: type I (IFN-1), II (IFN-) and III (IFN-2) interferon genes. Right, various ISGs. †, below detection limits. (B) Quantification of ISGs mRNA in LoVo cells treated for 72 h with control siRNA, siRNA against BAHD1 or KAP1 and infected for 16 h (WT) or not (NI). (C) Tandem-affinity purification of the BAHD1-associated complex. Solubilized chromatin extracts from HEK293 cells expressing the HPT-BAHD1 fusion or control cells were first purified on anti-protein C affinity matrix, followed by polishing on nickel-sepharose. Eluted fractions from the first (E1) and second (E2) affinity columns were analyzed by colloidal coomassie staining (left) or immunoblot (right). I, input; FT, flow through from first column. Histone H4 was a control for non-specific binding of chromatin components.
Fig. 3. LntA impairs BAHD1-mediated repression of ISGs. (A) LntA induces ISGs. mRNA
levels were estimated by qRT-PCR on total RNA from LoVo cells infected for 16 h with lntA
-or lntAV5+, compared to non-infected cells. (B) LntA impairs BAHD1 recruitment and increases
acetyl-H3 levels at ISGs. ChIP analysis was performed on LoVo cells infected as in (A), with antibodies against BAHD1 or H3K9Ac. Promoter DNA levels were assessed by qRT-PCR and normalized to cognate levels in histone H3-ChIP. (C) Constitutive expression of lntA in Listeria decreases bacterial burden during murine systemic listeriosis and triggers overproduction of IFN-III. Mice were infected intravenously with either ∆lntA or lntAc+ strains. Left, Colony
forming units (CFU) per organ were numerated at 72 h post-infection. Right, Mouse IFN-3 concentration was quantified by ELISA in clarified total extracts of infected spleens and livers. (D) BAHD1+/- mice are less sensitive to systemic listeriosis. BAHD1+/+ or isogenic BAHD1
+/-mice were infected intravenously with L. monocytogenes EGDe. Colony forming units (CFU) per organ were numerated at 72 h post-infection. (C-D) *, p < 0.05; **, p < 0.01; ***, p < 0.001.
Supporting online material
Material and MethodsBacterial strains, culture conditions, plasmids and oligonucleotides Human cell lines
Generation of BAHD1+/− mice Antibodies
Yeast two-hybrid (Y2H) screening
Transient transfections with plasmids or oligofection with siRNA duplexes Cellular infections, entry and intracellular multiplication assays
Animal infections
Immunofluorescence analysis, live-cell imaging and image processing Bacterial extracts, SDS-PAGE and immunoblots
GST-pulldowns
Expression and purification of LntA for cristallography Crystallization, structure solution and refinement
Tandem affinity purification of the HPT-BAHD1-associated complex and mass spectrometry analysis NanoLC-MS/MS analyses for protein identification
Sandwich ELISA measurement of mouse IFN-3 in organ homogenates Bacterial RNA extraction and qRT-PCR
Transcriptome analysis of infected cells
Human and mice RNA extraction and qRT-PCR
Chromatin immunoprecipitation experiments and site-specific PCR analysis
SOM text
Roles of type I, II and III interferons in listeriosis
Influence of the genetic background on the outcome of murine listeriosis
Supporting Figures
Fig. S1. Identification of lntA as a candidate virulence gene encoding a secreted protein. Fig. S2. LntA folds into a compact helical structure.
Fig. S3. Deletion or constitutive expression of lntA does not alter bacterial invasion of host cells. Fig. S4. LntA colocalizes with BAHD1 in the nucleus of human living cells.
Fig. S5. Expression of interferon genes and ISGs in response to Listeria infection. Fig. S6. Tandem-affinity purification of the HPT-BAHD1 associated complex. Fig. S7. Proposed model for BAHD1/LntA-mediated regulation of ISGs.
Fig. S8. Bacterial intracellular multiplication in LoVo cells is not altered by IFN--stimulation. Fig. S9. Verification of the BAHD1 KO allele.
Fig. S10. Genotyping of BAHD1+/- mice.
Fig. S11. Both deletion and constitutive expression of lntA in Listeria decrease bacterial burden during murine systemic listeriosis.
Supporting Tables
Table S1. Bacterial strains. Table S2. Plasmids.
Table S3. Bacterial entry in LoVo cells is independent of lntA expression and is not altered by IFN-2 treatment.
Table S4. Transcriptome data – genes activated by LntA in infected LoVo cells. Table S5. Oligonucleotides.
Table S6. PCR products and digests for the validation of BAHD1+/- mice.
Table S7. Crystallography. Data collection, phasing and refinement statistics.
Material and Methods
Bacterial strains, culture conditions, plasmids and oligonucleotides
Strains, plasmids and oligonucleotides used in this work are recapitulated in tables S1, S2, and S5, respectively. Listeria and Escherichia coli strains were grown in brain-heart infusion (BHI) or Luria-Bertani (LB) media (Difco), respectively, at 37°C. When appropriate, antibiotics were included in media at the following concentrations: kanamycin, 30 μg/ml; ampicillin, 100 μg/ml, colistin, 10 μg/ml; nalidixic acid, 50 μg/ml; erythromycine, 5 μg/ml; chloramphenicol, 7 μg/ml for Listeria, 35 μg/ml for E. coli.
For heterologous expression constructs of C-terminally tagged LntA fusions, the lntA (lmo0438, Gen-bank/EMBL accession number AL591975, 1) Open Reading Frame (ORF) without the sequence encoding the signal peptide (residues Gly34 to Lys205) was introduced into
pcDNA3.1/V5-His-TOPO using the directional topoisomerase cloning system (Invitrogen). Fluorescence microscopy, two-hybrid and GST-fusion protein expression constructs were generated by sub-cloning lntA into pE-mCFP-N1 (2), pB27 (Hybrigenics) pET41a (Novagen), and pGEX-4T-1 (GE Healthcare) respectively.
To constitutively express lntA in Listeria, we inserted the complete lntA ORF, fused with a V5 tag, into the pP1 multicopy plasmid, downstream of the constitutive PPRT promoter of the
protease gene from Streptococcus cremoris (3). This plasmid expressing lntA-V5 was electroporated into L. monocytogenes EGDe, generating BUG2384 (referred to as lntAV5+). As
a control, the empty pP1 vector was electroporated into EGDe ∆lntA, generating BUG2466 (referred to as lntA–).
We additionally designed a Listeria strain where a non-tagged copy of lntA was integrated in the Listeria genome at the tRNAARG locus using the pPL2 shuttle system(4). A pPL2 vector
carrying a PHYPER-5’-UTRhly-lntA transcriptional fusion was transformed into the EGDe ∆lntA
strain by conjugation, yielding to the complemented strain BUG2822 (referred to as lntAc+). A
isogenic ∆lntA:pPL2 control strain was also generated with the empty pPL2 vector (BUG2820, referred to as lntAc-). Selected integrants were confirmed by PCR.
To engineer a stable cell line producing the HPT-BAHD1 fusion, and a control cell line, we designed the following plasmids. First, the Tet operator sequence (TO) was introduced into pcDNA5/FRT-HPT-blue (a derivative of pCDNA5/FRT/V5-His from Invitrogen, 5). This gave rise to pcDNA5/FRT/TO-HPT-blue, allowing the N-terminal fusion of any inserted sequence with the HPT tag, e.g. a 6xHis tag, followed by the Protein C epitope and by a TEV cleavage site: MHHHHHH-EDQVDPRLIDGK-gggdydiptt-ENLYFQG-amgrp. Due to the Tet operator, the expression of the fusion is repressed by the Tet repressor in Flp-In T-Rex 293 cells (Invitrogen), but can be activated by addition of tetracycline to the culture medium. BAHD1 was cloned in pcDNA5/FRT/TO-HPT-blue to give rise to pcDNA5/FRT/TO-HPT-BAHD1, expressing HPT-tagged BAHD1 in a tetracycline-dependent manner. In the control pcDNA5/FRT/TO-HPT-blue plasmid, the tag is fused to a single T codon before the stop codon. All constructs were verified by double-strand sequencing. Additional cloning details are available upon request.
Human cell lines
We used C3SV40 fibroblasts (6), intestinal epithelial LoVo cells (ATCC CCL-229), placental JEG-3 cells (ATCC HTB-36), U-937 and THP-1 monocytes (CRL-1593.2 and TIB-202 respectively), HEK293 embryonic kidney cells (CRL-1573), and HEK293-derived Flp-In T-Rex 293 cells (Invitrogen). C3SV40 cells were grown in RPMI 1640 (Gibco) supplemented with 10% FCS (Gibco); other cell lines were grown following ATCC or Invitrogen
recommendations. All cells were cultured at 37°C in a humidified atmosphere containing 10% CO2.
Stable HEK293-HPT-BAHD1 and control HEK293-HPT-blue cells were generated as follows. Flp-In T-Rex 293 were transfected with the pcDNA5/FRT/TO-HPT-BAHD1 or -blue plasmids, together with the plasmid encoding the Flp recombinase. Stable pool of transfectants having undergone integration of HPT-expressing plasmids at the single FRT locus were selected as described (7), with the exception that 15 g/ml of Blasticidin (Invivogen) was added to the culture media in order to select for the maintenance of Tet repressor expression.
For BAHD1 complex purification, HEK293-HPT-BAHD1 and control -blue cells were grown in 3-L spinners in DMEM, 10% fetal calf serum, 1% Penicillin/Streptomycin under 5% CO2 atmosphere. To induce the production of the HPT-BAHD1 fusion, tetracycline was added
to cell culture media 24 h before cell recovery at a final concentration of 11 g/ml. Cell pellets were recovered by centrifugation, PBSwashed, flashfrozen in liquid nitrogen and stored at -80°C until they were use for tandem affinity purification.
Generation of BAHD1+/− mice
The BAHD1 mutant mouse line was established at the MCI/ICS (Mouse Clinical Institute, Institut Clinique de la Souris, Illkirch, France; http://www-mci.u-strasbg.fr). The entire coding region of the BAHD1 allele (Ensembl Gene ID: ENSMUSG00000040007) including the intronic sequences was replaced with a floxed neomycin cassette. The targeting vector was constructed as follows. A 4.3-kb fragment upstream of BAHD1 exon 2 and a 4.3kb fragment downstream of BAHD1 exon 7 were PCR-amplified and subcloned upstream and downstream of a floxed Neomycin (Neo) resistance cassette into an MCI proprietary vector, which contains the thymidine kinase gene for a negative selection. The linearized construct was electroporated in C57BL/6 mouse embryonic stem (ES) cells. After selection, targeted clones were identified by PCR amplification using external primers (Ef1/Nr1), and were further confirmed by Southern blot with an internal Neo probe and an external probe (table S6 and fig. S9). Five clones amongst 372 clones were positive. Two positive ES clones were injected into BALB/c recipient blastocysts and the derived male chimaeras showed efficient germline transmission. C57BL/6 mice derived from clone #41 were used for this study. Excision of the Neo resistance cassette was done at the chimera level, by breeding chimeras directly with C57BL/6 Cre deleter mouse line. F1 C57BL/6 Cre progeny were genotyped from mouse-tail lysates, using Ef and Er primers (outside of targeted exons), Wr and Wf (inside targeted exons), Nr and Nf (inside the Neo cassette) and Lxr (probing the loxP site). Details about primers and genotyping results are given in tables S5, S6 and fig. S10A. Analysis of PCR product patterns was performed by using HT DNA 5K LabChip®90 kit on the LabChip®90 microfluidic electrophoresis apparatus. A
representative genotyping picture is shown in fig. S10B.
Antibodies
The primary antibodies were as follows: InlC (R134, 8); ActA (R32, 9) and anti-LLO (R176, 10) rabbit polyclonal antibodies; anti-V5, anti-V5-HRP and anti-V5-FITC mouse monoclonal antibodies (R960-25, R961-25 and R963-25, Invitrogen); anti-GST mouse monoclonal antibody (71097, Novagen); anti-HP1 mouse monoclonal antibody (2MOD-1G6-AS, Euromedex); anti-BAHD1, H3, H4, KAP1, HDAC1 and HDAC2 rabbit polyclonal antibodies (ab46573, ab1711, ab7311, ab10483, ab7028 and ab7029 respectively, Abcam); anti-protein C mouse monoclonal antibody, clone HPC4 (11814508001, Roche); anti-H3K9Ac rabbit polyclonal antibody (9671, Cell Signaling Technology). The anti-LntA rabbit polyclonal antibody was generated and purified against recombinant GST-LntA as described (11). It was used at a 1:1,000 dilution in immunoblots. Secondary antibodies were Cy3-conjugated goat
anti-mouse IgGs (115-167-003, Jackson IR) for immunofluorescence (1:500 dilution), and HRP-conjugated goat anti-mouse or anti-rabbit IgGs (172-1011 or 172-1019, Bio-Rad) for immunoblots (1:10,000 dilution).
Yeast two-hybrid (Y2H) screening
The bait construct was the lntA gene cloned in pB27, a Y2H vector optimized by Hybrigenics, S.A., Paris, France (http://www.hybrigenics.com). pB27-lntA was transformed in the L40DGAL4 yeast strain (12) and Y2H screening was performed by Hybrigenics, as described (6). 107.42 millions of interactions were actually tested with the LntA bait. After selection on medium lacking leucine, tryptophane, and histidine, positive clones were picked and the corresponding prey fragments were amplified by PCR and sequenced at their 5’ and 3’ junctions. Sequences were then filtered and contiged as described previously (13) and compared to the latest release of the GenBank database using BLAST (14). In the LntA screening process, BAHD1 was found in 9 independent clones, with a Predicted Biological Score of A (very high confidence), as for two other preys.
Transient transfections with plasmids or oligofection with siRNA duplexes
Transient transfections of plasmids were performed as previously described (15) using lipofectamine 2000 (Invitrogen), according the manufacturer’s protocol. Chemically synthesized siRNAs against BAHD1 (S22351 and S22352 Silencer® siRNA) or KAP1
(siGENOME SMARTpool M-005046-01) were purchased from Ambion or Dharmacon, respectively. The corresponding Silencer® Negative Control #1 siRNA (AM4611) and
siGENOME Non-Targeting siRNA pool (D-001206-14) were used as controls. LoVo cells were transfected using Lipofectamine RNAiMAX (Invitrogen) following the manufacturer’s instructions. Briefly, 106 LoVo cells per well of a 6-well plate were first treated with a
reverse-transfection protocol, using 5 l lipofectamine RNAiMAX and 50 pmol of siRNA. This was followed by a forward transfection 30 h later, using the same amounts of siRNA and transfection agent. The silencing efficiency of these siRNAs for their targeted mRNA was tested by qRT-PCR as described below, 72 h post-transfection. Displayed BAHD1 silencing results proceed from S22351 transfection; S22352 gave comparable phenotypes, though with a weaker efficiency.
Cellular infections, entry and intracellular multiplication assays
In all invasion experiments, Listeria strains were grown in BHI mediumto an OD600 of 2 to
3, washed in PBS,and diluted in culture medium without serum, to achieve the required the multiplicity of infection (MOI). Bacterial dilutions were added to cell plates and centrifuged for 1 minute at 200 x g to synchronize entry (except for chromatin immunoprecipitations, for which 162 cm2 cell flasks were used). After 1 h of incubation, cells were washed twice and the
remaining non-invasive bacteria were killed by adding gentamicin 20 g/ml in complete culture medium for 1 h (entry) to 15 h, 21 h or 23 h (intracellular multiplication).
Specific protocols were as follows:
(i) Quantifications of bacterial entry and intracellular multiplication by gentamicin survival assays (16). Bacterial dilutions were added to LoVo cells seeded in 24-well plates, to obtain a MOI of 20 to 40. After entry and gentamicin treatment, efficiencies of bacterial entry and intracellular multiplication were quantified by plating serial dilutions of cells lysates on BHI agar plates and determining colony-forming units (CFU). Experiments were performed in triplicates and reproduced at least three times. When applicable (fig. S8, table S3B), recombinant human IL-28A/IFN-2 (R&D system, 1587-IL-025) was added either 24 h before or concomitantly with gentamicin at the indicated concentrations.
(ii) Microscopy. C3SV40 cells were seeded on glass coverslips in six-well plates and infected or not with bacteria at a MOI of 100. After 22 h of infection, coverslips were processed for immunofluorescence analysis. As bacterial entry is mainly InlB-dependent in C3SV40 cells, for quantification experiments, we increased the number of infected cells by treating bacteria with the invasion protein InlB-Ami, which is able to efficiently associate to the bacterial surface when added exogenously, and to stimulate bacterial entry (17). After 30 minutes of incubation at 37°C, bacteria were washed twice in PBS and used for cell infection, as described above. (iii) RNA analysis. Cells were seeded in six-well plates and infected or not with bacteria at a multiplicity of infection (MOI) of 20, and processed as for invasion assays. RNA samples were collected 16 to 24 h post infection. When siRNA treatment was needed, this was performed as described above, starting the reverse-transfection protocol 72 hours before recovery of infected cells (i.e. 56 h before infection for the reverse transfection, and 26 h for the forward transfection). Note that, for optimal siRNA treatment, cells had to be seeded at a lower density in these experiments than non-siRNA treated cells. This resulted in decreased cell-to-cell spread of bacteria.As a consequence, the observed effects of infection on the expression of IFN genes and ISGs were less pronounced for siRNA treated cells, in control as well as in targeted depletion samples. U-937 and THP-1 monocytes were pre-activated by adding 1 mg/ml PMA (phorbol-12-myristate-13-acetate, Sigma) to the culture medium, 24 hours before infection. (iv) Chromatin ImmunoPrecipitations (ChIP). LoVo cell monolayers in 162 cm2 flasks were
infected with lntA- or lntAV5+ strains at a multiplicity of infection (MOI) of 25. After 16 h of
infection, cells were washed in PBS and fixed with 1% formaldehyde in PBS as described (18). For microscopy, RNA and ChIP experiments, we controlled the efficiency of infection by CFU counts on lysed cells, and by immunofluorescence using anti-Listeria antibody. Bacterial recovery of the lntA-expressing or -deficient strains proved to be very similar in every condition tested, thus excluding potential effects of bacterial load/entry/survival/proliferation variations on the described phenotypes.
Animal infections
Animal experiments were performed according to the Institut Pasteur guidelines for laboratoryanimal husbandry, which comply with European regulations.
(i) In vivo virulence assay in BALB/c mice. 8-week-old female BALB/c mice (Charles River) were injected intravenously with L. monocytogenes strains to be tested. Groups of 4 (for organs) to 6 (for blood) mice were injected with an inoculum of 8. 103 CFU per tested strain, and
sacrificed 48 or 72 h after infection. Spleens and livers were aseptically removed and separately disrupted in phosphate-buffered saline (PBS). 100 l of blood was recovered and heparin (250 units/ml) was added to prevent coagulation. Serial dilutions of organs homogenates or blood were plated on BHI agar plates and CFU determined. Statistical analyses were performed using Student’s two-tailed T-test on CFU counts. A p-value p < 0.05 (*) was considered statistically significant.
Note that, when we assayed the virulence of the ∆lntA mutant strains, comparable results were obtained with clone BUG2168 (fig. 1B and 3C) and with BUG2169 (not shown).
(ii) In vivo virulence assay in BAHD1+/+ or BAHD1+/- mice. Six mice carrying the BAHD1 KO
(knockout) allele on one chromosome (BAHD1+/-) and six of their littermates carrying the wild
type (WT) allele (BAHD1+/+) were used in this study. Each group contained 5 males and 1
female, all in the C57BL/6 background. These mice were injected intraperitoneally with WT EGDe. Due to resistance of C57BL/6 mice to infection by L. monocytogenes (19), we used an inoculum of 5. 104 CFU per animal. Mice were sacrificed 72 h after infection, and CFU were
(iii) In vivo RNA analysis. Bacteria were isolated from mouse spleens as previously described (20). Briefly, 6-8 weeks old specific pathogen-free female CD1 mice (Charles River) were intravenously infected with 106 L. monocytogenes EGDe bacteria. 48 h post-infection, spleens
were harvested and homogenized in ice-cold solution (0.2 M sucrose, 0.01% SDS). The homogenate was gently centrifuged for 20 minutes at 300 rpm and filtered. The tissue suspension was centrifuged for 20 minutes at 4000 rpm to pellet the bacteria.
Immunofluorescence analysis, live-cell imaging and image processing
(i) For microscopy on fixed samples, cells were fixed 20 minutes at room temperature with 4% paraformaldehyde in PBS, permeabilized with 0.5% Triton X-100 in PBS for 4 minutes at room temperature, and then blocked in PBS containing 1% BSA (Sigma). Slides were then incubated either with FITC-conjugated anti-V5 for 1 hour or, when co-localizations of LntA-V5 with BAHD1-YFP was needed, with primary anti-V5 for 1 hour and then with Cy3-conjugated secondary antibody and DAPI for 30 minutes. Bacteria were visualized in phase contrast and with DAPI.
(ii) For live cell imaging, images were acquired with the microscope equipped with a temperature-controled stage and an objective heater (Biotechs). Fluorescent illumination was driven by an ultrahigh-speed wavelength switcher Lamda DG4 (Sutter Instrument) equipped with a 175W xenon arc lamp and excitation filters for CFP and YFP (Chroma Technology). Emission filters were selected using a high-speed Lamda 10 filter wheel (Sutter Instrument). Preparations were observed with a Zeiss Axiovert 200M epifluorescence microscope (Carl Zeiss MicroImaging, Inc.), connected to a cooled CCD camera (CoolSNAPHQ, Photometrics).
Images were acquired with apochromat 63x or 100x (NA 1.4) objective lenses and processed with the MetaMorph software, version 6.1 (Universal Imaging Corp., Downingtown, PA).
To quantify LntA signals in nuclei of C3SV40 cells infected with lntA-V5+, a region
encompassing the surface of each nucleus, corresponding to the DAPI staining, was created in MetaMorph. FITC Fluorescence intensity (average intensity, expressed in arbitrary units, a.u.) was then measured in the selected area, in the image corresponding to the LntA-V5 staining. V5-specific FITC staining was compared with the background FITC staining in C3SV40 cells, or cells infected with the control strain lntA–. Data were gathered from 26 nuclei in three
independent experiments, and background levels, collected from cell-free areas of the coverslip, were subtracted. Acquisition parameters and background levels were similar same for all samples.
Bacterial extracts, SDS-PAGE and immunoblots
Bacterial total extracts or culture supernatants were recovered from 1 ml of Listeria strains grown to a OD600 of 2.0 in BH1 medium at 37°C, under microareroby conditions. After
centrifugation at 8,000 x g, the bacterial pellet was resuspended in 100 μl 2x concentrated protein electrophoresis sample buffer (SB2X, 21), sonicated 5 times 15 seconds, and boiled for 5 minutes at 95°C. Supernatants were filtered on 0.2 μm filters, precipitated with 16% TCA for 30 minutes at 4°C and by centrifugated for 15 minutes at 4°C. The precipitated proteins were washed with acetone, and denaturated in 100 μl SB2X. 10 μl of each sample were separated by electrophoresis on 14% sodium dodecyl sulfate-polyacrylamide gels (SDS-PAGE). Proteins were detected by immunoblot using Hybond-P PVDF membranes (GE Healthcare) and a detection kit (Pierce).
GST-pulldowns
To prepare nuclear extracts, 4.107 HEK293 cells transfected or not with
Nuclear Extraction Kit (Active Motif), following manufacturer’s instructions. Nuclear and cytoplasmic extracts were stored at -80°C. GST-LntA or GST were produced from BL21(DE3) transformed with pET41a plasmids. 300 ml of cultures at DO600 = 0.6 were stimulated 4 h with
0.5 mM IPTG. Bacterial pellets were lysed with a French Press (13,000 PSI) in lysis buffer (15 mM HEPES pH 8.0, 100 mM NaCl, 1 mM EDTA, 1 mM DTT) supplemented with Complete protease inhibitor cocktail, EDTA-free (Roche). For pull down assays, 100 l of a 50% slurry of gluthatione sepharose 4B beads (Amersham, Biosciences) were mixed for 4 h at 4°C with bacterial lysates and processed according to the manufacturer's instructions. The amount of GST fusion proteins was estimated by either immunoblot or Coomassie brilliant blue staining for normalization of quantities used in pulldown assay. 50 l of purified nuclear extract containing BAHD1-V5 or CFP-V5 were mixed with appropriated quantities of GST fusion protein resin in supplemented binding buffer and incubated overnight at 4°C. The beads were then washed twice with the same binding buffer and once with binding buffer without protease inhibitor cocktail. 20 μl of SB2X was added and the mixture was denaturated for 6 minutes at 100°C. After centrifugation at 2,500 x g for 5 mn, 15 l of the supernatant was subjected to SDS-PAGE and immunoblot as described above.
Expression and purification of LntA for cristallography
E. coli BL21(DE3) were transformed with pGEX-lntA plasmid. Cultures were grown at 37°C to OD600 = 0.8, then expression was induced by addition of 1 mM IPTG for 21 hours at
25°C. Cells were disrupted by sonication in PBS buffer pH 7.3 supplemented with 140 mM NaCl, protease inhibitors, DNaseI (Sigma) and RNAse (Roche). The sample was centrifuged at 30,000 xg for 1h 30 min, and the supernatant was loaded onto a 5 ml GSTrap-HP column (GE Healthcare) equilibrated in PBS buffer. The GST-LntA34-205 fusion protein was eluted with
20 mM reduced glutathione in 50 mM Tris-HCl, pH 8.0. After dialysis into a buffer containing 25 mM Tris-HCl pH 8.3 and 0.2 M NaCl, the GST-tag was cleaved for 6 hours with 0.5 U of thrombin/mg of protein. The digested sample was reloaded onto the GSTrap-HP column and the unbound fraction was loaded onto a Superdex 75 column equilibrated in 25 mM HEPES, 0.1 M NaCl, 1 mM EDTA, pH 7.5. The selenomethionine form of LntA was expressed in minimal medium and purified as for the native protein, except that 5 mM DTT was added to the GST equilibration buffer and an additional MonoQ HR5/5 step was performed at pH 8.0 before gel filtration. Mass spectrometry confirmed the full substitution of the three methionines.
Crystallization, structure solution and refinement
Purified LntA34-205 was concentrated to 10 mg/ml, and an initial screening using the high
throughput crystallization platform of the HTXLab (PSB, Grenoble, France) performed at 4°C yielded more than 100 different hits. Several crystal forms were reproduced by hand at 20°C. The best crystals grew in 2 months in 0.15 M NaSO4, 18% PEG 3350 and, before data
collection, were cryoprotected by successive incubation in mother liquor containing increasing concentrations of glycerol (up to 25%).
A SAD-dataset on the Selenium edge was collected on BM30A at the ESRF-Grenoble to a resolution up to 2.3Å. Data were indexed (space group P41212) and scaled with the XDS
package (22). Heavy atoms sites, refinement and phasing were performed by AutoSHARP (23, 24). Cycles of intercalated automatic and manual building were performed using ARP/wARP and Coot (25, 26), coupled with refinement cycles by REFMAC 5.4 (27). Data collection and refinement statistics are shown in table S7.
The LntA molecular structure data are deposited at the Worldwide Protein Data Bank (http://www.wwpdb.org/), ID #2xl4, structure factor file #r2xl4sf.
Tandem affinity purification of the HPT-BAHD1-associated complex and mass spectrometry analysis
We carried out a double-affinity purification of HPT-BAHD1 from HEK293-HPT-BAHD1 cells, or a negative control purification from HEK293-HPT‐blue cells, starting from 7.5 g of frozen cellular pellet. Preparation of nuclear soluble and chromatin fractions was as described (28). HPT-tagged BAHD1 associated complexes were then purified by two-step affinity chromatography using (i) Anti-Protein C Affinity Matrix (Roche) for the binding of the protein C epitope and (ii) Ni Sepharose High Performance (GE Healthcare) for the binding of the His6
-tag. Since the recognition of the protein C epitope by the HPC4 antibody is calcium-sensitive, no EDTA was added in the first chromatography step. Instead, TGN binding and wash buffer (20 mM Tris pH 7.65, 10% glycerol, 150 mM NaCl, 0,01% Igepal) was supplemented with 1 mM CaCl2. After overnight binding to the resin, bound complexes were extensively washed,
and then eluted with TEGN (TGN, 5 mM EGTA, pH 7.65). Eluates were supplemented with 30 mM imidazole and further affinity-purified on Ni-sepharose. After 2 h of binding to the resin, bound complexes were extensively washed with TIGN (TGN, 30 mM imidazole, pH 7.65), and eluted with 2X NuPAGE LDS sample buffer (Invitrogen). Double-immunopurified complexes were resolved on NuPAGE Novex 4-12% Bis-Tris gels in MOPS buffer (Invitrogen). For the analytical gels (fig. 2C and S6A), we loaded 1/100th of the eluate
from the 1st column, and1/10th of the eluate from the 2nd column, and stained with the
SilverQuest staining kit (Invitrogen). For control immunoblots, we loaded 1/1,000th and 1/100th
of the two eluates, respectively, and 1/10,000th of the input and flow through fractions. For the
preparative gel (fig. S6B), we loaded 1/4th of the eluates from the 1st and 2nd columns, and
stained with Colloidal Blue staining kit (Invitrogen). Bands were cut out from the two-spep purified complex lane for mass spectrometry (MS) analyses (see below).
NanoLC-MS/MS analyses for protein identification
Standard enzymatic digestion of excised bands was performed with trypsin (Gold Promega 10ng/l) using the Progest robot (Genomic Solutions). Peptide mixtures were SpeedVac-treated for 10 min then solubilized with 0.1% formic acid and injected in a Q-TOF Premier mass spectrometer coupled to a nanoAcquity liquid chromatography equipped with a trapping column (Symmetry C18, 180 μm × 20mm, 5 μm particle size) and an analytical column (BEH130 C18, 75 μm × 100 mm, 1.7 μm particle size) (Waters). The aqueous solvent (buffer A) was 0.1 % formic acid in water and the organic phase (buffer B) was 0.1 % formic acid in acetonitrile. A 2-40% B gradient was set for 25 min. For exact mass measurements, glufibrinopeptide reference (m/z = 785.8426) was continuously supplied during nanoLC-MS/MS analyses using the lockspray device. Peptide mass measurements were corrected during data processing and peak lists were generated by PLGS (ProteinLynx Global Server, Waters). Processed data were submitted to Mascot searching using the following parameters: data bank NCBI; taxonomy Human; peptide tolerance 20 ppm; fragment tolerance 0.1 Da; digest reagent trypsin with one missed cleavage allowed; variable modifications oxidation (Methionine) and fixed modifications carbamidomethylation (Cysteine). Validation criteria for protein identification were: two peptides with a Mascot individual ion score >30.
Sandwich ELISA measurement of mouse IFN-3 in organ homogenates
Mouse liver and spleen homogenates were prepared as described in the Animal infections section (i). Concentrations of IFN-3 in homogenates was determined using Mouse IL-28B/IFN-lambda 3 DuoSet (DY1789, R&D Systems), according to the manufacturer’s instructions. Briefly, wells of a 96-well plate were pre-coated with specific rat anti-mouse IL-28B capture antibody and saturated with PBS, 1% BSA (Reagent Diluent). 1 ml of each organ
homogenate was clarified by two successive centrifugation steps at 1,000 and 10,000 x g, respectively. 30 l of sample supernatants from three distinct biological replicates were added to wells of the prepared ELISA plate, pre-filled with 70 l of Reagent Diluent. A standard curve was included, by loading in wells 100 l of 2-fold serial dilutions of recombinant mouse IL-28B, starting from 2 ng/ml. After thorough washing steps, the detection antibody was then added, followed by the streptavidin-HRP conjugate, as specified by the manufacturer. Signals were revealed with Substrate and Stop Solutions (DY999 and DY994 respectively, all from R&D Systems), and detected by reading the Absorbance at 450 nm using a TriStar LB941 device (Berthold technologies). For wavelength correction, readings at 590 nm were subtracted from the obtained values. Statistical analyses were performed using Student’s two-tailed T-test on calculated concentrations.
Bacterial RNA extraction and qRT-PCR
RNA samples from Listeria grown to exponential or stationary phase at 37ºC in rich medium or extracted from mouse spleens were extracted as previously described (20, 29) and treated with TURBO DNA-freeTM kit (Ambion).
Bacterial cDNAs were generated with iScript cDNA Synthesis kit (Bio-Rad), following the manufacturer’s protocol. Quantitative real-time PCR (qRT-PCR) was performed on a MyIQ device (Bio-Rad). Classical runs were 45 cycles with a hybridization temperature of 60ºC. Each reaction was performed in triplicate. 2 μl of diluted cDNA samples were mixed with 10 μl of SYBR® Green PCR master mix (Bio-Rad) and 0.25 pM (each) forward and reverse primers in
a final volume of 20 μl. A standard curve was generated for each primer pair by using three ten-fold dilutions of a PCR product of defined concentration, to ensure that PCR efficiency was 100%. Data were analyzed by the ∆∆Ct method. Target gene expression data were normalized by the relative expression of a reference gene (16S rRNA or gyrA). The expression of the control lmo2845 gene, which encodes a putative transmembrane efflux protein, was not affected in vivo (20). The neat concentration of cDNA molecules in samples was calculated using standard curves. The specific primers pairs for each bacterial gene are specified in table S5.
Transcriptome analysis of infected cells
RNA from LoVo cells grown in 6-well plates and infected with either lntAV5+ or lntA– strains
was extracted using the RNeasy Mini Kit (Qiagen). Three biological replicates were analyzed for each experimental condition. RNA quality was monitored on Agilent RNA Pico LabChips (Agilent Technologies, Palo Alto, CA). 300 ng of total RNA were analysed using the Affymetrix Human Gene1.0 ST Array (exon array), according to the GeneChip whole transcript sense target labeling assay manual, using the GeneChip WT cDNA Synthesis and amplification Kit and WT terminal labeling Kit. Human Gene 1.0 ST array interrogates 28,869 well-annotated genes with 764,885 distinct probes. The RNA was reverse transcribed using random primers tagged with a T7 promoter sequence. The second strand was synthesized, and the dsDNA was used as a template and linear amplified by T7 RNA polymerase. The cRNA was reverse transcribed using a mixture of dNTPs and dUTP and random primers. After RNaseH digestion, the ssDNA was fragmented with a combination of Uracil DNA glycosylase and apurinic/apyrimidinic endonuclease 1. The fragmented ssDNA was end-labeled by terminal deoxynucleotidyl transferase with the Affymetrix proprietary DNA labeling reagent, which is covalently linked to biotin. The fragmented and labeled ssDNA was hybridized to arrays for 18 h and washed and scanned with the Affymetrix wash station and scanner. For data analysis, cell intensity files were generated with GeneChipOperating Software. Raw data were processed by the Robust Multichip Analysis (RMA) algorithm. A test for differential expression was performed between these two groups using the “lpe” package available on the R-open source
software platform. Genes were considered to be significantly differentially expressed with a p-value of < 0.05 after multiple testing correction (Benjamin-Hochberg).
Complete data are deposited in the Gene Expression Omnibus Database (http://www.ncbi.nlm.nih.gov/geo/) with GEO accession number GSE26414.
Human and mice RNA extraction and qRT-PCR
RNA from infected and/or siRNA-treated human cells was extracted using RNeasy Mini Kit (Qiagen), using 1 column per well of a 6-well plate. For RNA extraction from mice kidneys, each organ was disrupted directly in 1 mL RLT buffer supplemented with -mercaptoethanol using a GentleMACS Dissociator (Miltenyi Biotech). 100 µL of organ homogenate was diluted in 250 µL RLT buffer before loading on a RNeasy Mini column and processing to extraction as recommended by the manufacturer.
Genomic DNA was removed by treatment with TURBO DNA-freeTM kit (Ambion). cDNAs
were generated from 1 to 2 g total RNA using the RT2 first strand kit (SABioSciences), and
quantitative PCR was performed with RT2 qPCR Primer Assay (SABioSciences) following the
manufacturer’s protocol and the recommended two-step cycling program, on a MyIQ device (Bio-Rad). Each reaction was performed in triplicate. All human and mice qRT-PCR primers were pre-designed, validated RT2 qPCR primer pairs from SABioSciences. Data were analyzed
by the ∆∆Ct method. Target gene expression data were normalized to the relative expression of the GAPDH reference gene. Similar results were obtained when HPRT1 transcript was used as a reference.
Chromatin immunoprecipitation experiments and site-specific PCR analysis
This protocol was adapted from Boukarabila et al. (18). Chromatin inputs corresponding to 3.106 cells were used for each individual BAHD1 or H3K9Ac ChIP assay, and 1.106 cells for
H3 ChIPs. All buffers were supplemented with Complete EDTA-free protease inhibitor cocktail tablets (Roche). Formaldehyde-fixed cells were washed in PBS and lysed in 10 mM Tris, pH 8, 10 mM EDTA, 0.5 mM EGTA, 0.25% Triton X-100 for 5 min on ice. The nuclear pellets were recovered by brief centrifugation at 3,000 x g, and the soluble nuclear fraction was extracted with 250 mM NaCl, 50 mM Tris pH 8, 1 mM EDTA, 0.5 mM EGTA for 30 min on ice. After brief centrifugation at 16,000 x g, the chromatin pellets were resuspended in 10 mM Tris pH 8, 1 mM EDTA, 0.5 mM EGTA, 0.5% SDS, and then sonicated with a Bioruptor (Diagenode) to shear chromatin to a final size of 150-600 bp. Extracts were quantified by A260nm
measurement, and material quantities were adjusted accordingly. Samples were then diluted to obtain the following IP buffer composition: 150 mM NaCl, 10 mM Tris pH 8, 0.1% SDS, 1% Triton X-100, 0.1% sodium deoxycholate, 1 mM EDTA, 0.5 mM EGTA. IP was carried out overnight at 4 °C with anti-BAHD1, -H3K9Ac or control -histone H3 antibodies. The immunocomplexes were recovered with Dynabeads Protein G (Invitrogen) added for 90 min and then washed 5 times in a succession of isotonic and saline buffers as described (18). After a final wash in 10 mM Tris pH8, 1mM EDTA, 0.01% Igepal, bound material was eluted by the addition of water containing 10% Chelex (Bio-Rad), followed by boiling for 10 min to reverse the crosslink. Samples were then incubated with proteinase K (100 μg/mL) for 30 min at 55 °C with some shaking, and then boiled for another 10 min. Finally, the ChIP DNA fraction was separated from beads and Chelex matrix by centrifugation. The recovered supernatants were quantified by qRT-PCR, performed in triplicates in the same conditions as described above for bacterial cDNA quantifications; data analysis was performed with the ∆∆Ct method. All primer sequences are given in table S5. The IFITM1-e1 primer pairamplified a 127 base-pair region located in the first exon of the gene, just downstream of the ISRE (Interferon Stimulation Response Element). CD44-GpG, IGF2-P3b and IFIT3-TS primer pairs were described
previously(6, 30).All PCR efficiencies, calculated on serial dilutions of purified input DNA, were 90%–100%. The qRT-PCR values obtained for the recruitment of the BAHD1 or H3K9Ac antibodies to chromatin were normalized using histone H3 antibody ChIP signals on the same chromatin extract as a reference.
SOM text
Roles of type I, II and III interferons in listeriosis
Type I interferons are beneficial for Listeria, while type II interferons are highly detrimental for this pathogen (31, 32). In the context of viral infections, IFN-III have been reported to substitute for type I IFN in specific tissues, such as epithelia (33, 34). We propose that LntA-mediated expression of ISGs downstream of IFN-III may be beneficial for Listeria only at a certain time of the infection and in specific cells.
Influence of the genetic background on the outcome of murine listeriosis
To address the role of BAHD1 in murine listeriosis, we have generated BAHD1+/- mice. For
technical reasons, we had to generate these mice in the C57BL/6 background, which is much more resistant to Listeria infection than the BALB/c background (19). This explains why CFU counts in organs were several orders of magnitude lower for experiments in BAHD1+/- mice and
Supporting Figures
Fig. S1. Identification of lntA as a candidate virulence gene encoding a secreted protein.
(A) The lntA/lmo0438 genome region in L. monocytogenes aligned with the corresponding
region in the L. innocua genome. Genes with PrfA and B boxes are in black. lmo0438 was
selected as a candidate virulence gene by a genome-based in silico approach. Bioinformatic prediction of protein export signals had identified 138 genes encoding putatively secreted proteins in L. monocytogenes EGDe, e.g. proteins containing putative secretion signals and no domain for association at the bacterial surface (35). Further analysis of surface proteins allowed us to reduce this number to 121 (36). Among them, 22 genes were absent in the non-pathogenic L. innocua species (1), of which 6 known virulence genes, such as hly. We selected lmo0438 from the 16 remaining genes, because it localizes in the vicinity of the inlAB operon, which encodes major invasion proteins, and because lmo0438 promoter region displays recognition boxes for PrfA and B. These two regulators of virulence genes play key roles in the
L. monocytogenes transition from saprophytic to pathogenic life (37, 38).
(B) lntA is expressed at very low levels by the L. monocytogenes EGDe strain grown in rich medium, when compared to the housekeeping gene gyrA or the virulence gene inlA. lntA thus behaves as a category of Listeria virulence genes that are not expressed in broth or tissue-cultured cells and are induced in vivo, such as inlJ (39). lntA, inlA and gyrA cDNA molecules were quantified by qRT-PCR, thanks to a standard curve performed on PCR products of known concentration. Data were normalized to 30 ng of starting total RNA, extracted from WT Listeria grown to stationary phase in BHI medium, under microaeroby conditions.
(C) lntA encodes a secreted protein. L. monocytogenes constitutively expressing lntA from a PHYPER promoter integrated on the bacterial chromosome (lntAc+) or L. monocytogenes with the
integrated empty vector (lntAc-), were grown at 37°C in BHI to a OD600 of 2. Proteins from the
bacterial total extracts (TE) and the supernatant fraction (Sn, pure or precipitated with TCA) were analyzed by immunoblot with antibodies against LntA and InlC, used as control of a secreted protein. The precursor protein (~23.4 kDa) is present in TE. The mature secreted LntA (~19,7 kDa) is present in the Sn fraction.
Fig. S2. LntA folds into a compact helical structure.
(A) LntA sequence. Positions of helices H1 to H5 in the secondary structure are shown below the protein sequence.
(B) Crystal structure of LntA56-202. We crystallized LntA34-205 and solved its structure by single
anomalous dispersion (SAD) to 2.3 Å resolution (data collection and structure refinement statistics can be found in table S7). The crystallographic model contains one LntA molecule per asymmetric unit and includes residues 56-202. The five -helices (H1 to H5) compose a compact structure. Three long central helices (H1, H2 – formed by H2a and H2b – and H3) form the core of the structure. The last two helices (H4-H5) form a right angle along the axis. Residues 34-55 and 203-205 could not be traced in the electron density map and are thus represented as dots. Structure data are deposited at the PDB (http://www.wwpdb.org/), ID #2xl4, structure factor file #r2xl4sf.
(C) Surface representations of LntA with positive (in red) and negative (in blue) charges. In addition to numerous basic residues, an acidic patch decorates the bottom of the structure.
Fig. S3. Deletion or constitutive expression of lntA does not alter bacterial invasion of host cells.
(A) Deletion of lntA does not affect the expression of inlA and hly virulence genes. lntA, hly and inlA mRNA levels were quantified by qRT-PCR on total RNA from WT EGDe or ∆lntA isogenic strains. Data were normalized to gyrA mRNA and levels in WT. Error bars indicate standard deviation. Relative expression values of hly and inlA in ∆lntA strain are not statistically different (NS) from WT levels, according to a two-tailed T-test. ***, p < 0,001.
(B) Deletion of lntA does not affect the secretion of the hly product, listeriolysin O (LLO). WT and ∆lntA Listeria strains were grown in BHI to stationary phase. Proteins from culture supernatants were precipitated with TCA, then separated by SDS-PAGE on two identical gels. One gel was used for an immunoblot with antibodies against LLO (upper panel). The second gel was stained with coomassie (lower panel).
(C) Bacterial intracellular multiplication in LoVo cells is not altered by depletion or constitutive expression of lntA. The number of intracellular bacteria in infected LoVo cells was quantified 2 h or 24 h post infection by a gentamicin survival assay. lntA-expressing or non-expressing L. monocytogenes strains displayed no significant difference in intracellular replication in host cells.
Fig. S4. LntA colocalizes with BAHD1 in the nucleus of human living cells.
(A) Quantification of the LntA-V5 signal in the nucleus of human infected cells. C3SV40 fibroblasts were infected or not for 22 h with lntA– or lntAV5+ bacteria. The LntA-V5 protein
was detected by immunofluorescence with FITC-coupled -V5 antibody. FITC fluorescence signals were quantified in the nuclei of cells. The box-whisker plot indicates quartiles and median values. a.u., arbitrary units; ***, p < 0.001 (two-tailed T-test). The V5 staining was significantly more intense in nuclei of lntA-V5+ infected cells compared to non-infected cells
or cells infected with the lntA-deficient strain.
(B) Ectopically expressed LntA colocalizes with BAHD1-induced heterochromatin foci in living cells. pEYFP-BAHD1 was co-transfected into C3SV40 cells with either pE-mCFP-lntA or pE-mCFP. Fluorescent CFP (upper panels) or YFP (lower panels) signals were monitored in mono- or co-transfected living cells. Scale bars, 5 μm.
Fig. S5. Expression of interferon genes and ISGs in response to Listeria infection.
(A) L. monocytogenes induces the expression of IFN-III in placental epithelial JEG-3 cells. qRT-PCR analysis of IFN-2 expression in response to Listeria infection of JEG-3 cells infected for 16 h with WT L. monocytogenes (gray), compared to non-infected cells (NI, white). All data (here and in panels B-F) were analyzed with ∆∆Ct method and normalized to GAPDH housekeeping gene transcript level.
(B) Quantification of BAHD1, IGF2, STAT1 and IFN-2 expression levels in control or BAHD1 siRNA-treated LoVo cells. Efficiency of the 72-h siRNA treatment was assessed by qRT-PCR. As we reported previously in HEK293 cells (6), IGF2 expression increased upon BAHD1 knockdown in LoVo cells. As we showed for other ISGs (fig. 2B), STAT1 and IFN-2 expression levels were higher upon BAHD1 knockdown in 16-h Listeria-infected cells.
(C) Quantification of KAP1, BAHD1, IGF2, STAT1 and IFN-2 expression levels in control or KAP1 siRNA-treated LoVo cells. KAP1 siRNA affected neither BAHD1, nor IGF2 expression. STAT1 and IFN-2 expression levels increased upon KAP1 knockout, as for any other ISG (fig. 2B).
(D) Non-tagged LntA up-regulates ISGs in infected cells when expressed from the chromosome. IFI6 and IFITM1 mRNA levels were estimated by qRT-PCR on total RNA from LoVo epithelial cells infected for 22 h with either the lntA-defficient lntAc- strain, or the isogenic
lntAc+ strain that expressed constitutively lntA from a chromosomal locus.
(E) LntA up-regulates ISGs only in infected cells of epithelial origin. JEG-3, U-937, THP-1 or HEK293 cells were infected with the lntA– or lntAV5+ strains for 22 h. mRNA quantifications
and normalizations were as above.
(F) Right. The expression of IFN-2 and -1 is stimulated by LntA, as observed for other ISGs. LoVo cells were infected with the lntA– or lntAV5+ strains for 16 h, or not infected. mRNA
quantifications and normalizations were as above. Note that the expression of IFN- remained below detection limits (†), as expected in a non-hematopoietic cell lineage.
Left. Quantification of IGF2 expression levels in infection experiments. LoVo cells infected for 16 h with either lntA- or lntAV5+ Listeria monocytogenes were not affected for the expression of
Fig. S6. Tandem-affinity purification of the HPT-BAHD1 associated complex.
(A) BAHD1 is specifically enriched in the chromatin-associated fraction.
Cytoplasmic, soluble nuclear (Sol.) or solubilized chromatin (Chrom.) extracts of HEK293-HPT-BAHD1 cells or control HPT-blue cells were separated by two successive steps of chromatography. Eluates were separated by gradient SDS-PAGE, and stained with Coomassie colloidal staining. E1, eluted fractions from the anti-protein C resin (1/100 total); E2, eluted fraction from the nickel-sepharose resin (1/10 total). Note that affinity-purified HPT-BAHD1 is specific of the chromatin extracts. In other fractions, recovered material is mostly non-specific, as highlighted by the comparison with HPT-blue lanes. The HPT tag consists of a His6, protein C epitope, TEV cleavage site sequence.
(B) Preparative gel for the analysis of the HPT-BAHD1-associated complex by mass spectrometry. 1/4th of the chromatin-specific E1 and E2 eluates were separated by gradient
SDS-PAGE, and stained with Coomassie colloidal staining. Bands 1-15 from the two-step purified, chromatin-associated complex were cut out and proteins were identified by LC-MS-MS. Those containing BAHD1, KAP1, HDAC1/2 and HP1 are highlighted.
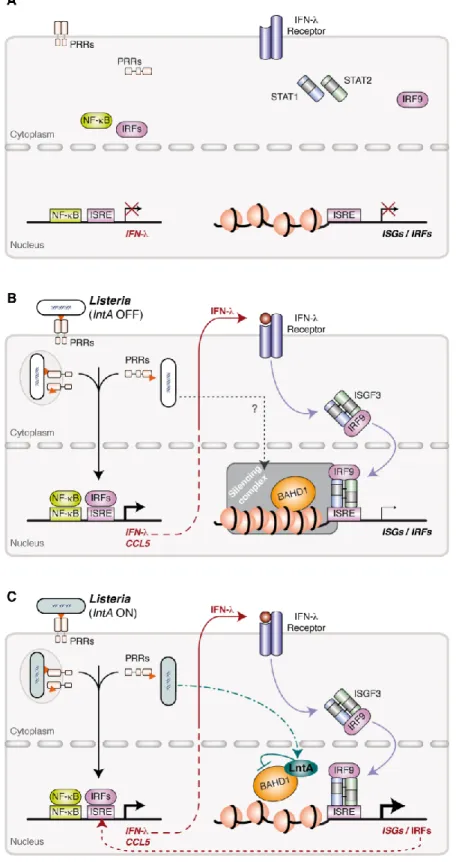
Fig. S7. Proposed model for BAHD1/LntA-mediated regulation of ISGs.
(A) Interferon genes and ISGs are not expressed in resting cells.
(B) During infection of epithelial cells by L. monocytogenes, the recognition of bacterial molecules (MAMPs, Microbial Associated Molecular Patterns) by Patterns Recognition Receptors (PRRs) activates NF-B and IRF transcriptional factors, which translocate into the nucleus and induce expression of type III, and to a lesser extend type I, interferons, as well as
of other NF-B/IRF-dependent genes, such as CCL5. Subsequently, IFN-s are secreted, activate their receptor and the downstream JAK/STAT pathway, leading to translocation of ISGF3 (e.g. STAT1/2-IRF9 complex) transcription factor into the nucleus. However, in response to a still non-identified infection-triggered signaling pathway, the BAHD1 silencing complex down-regulates ISGs by compacting chromatin.
(C) Under specific conditions, i.e. in specific tissues and at a given time point during infection, Listeria secretes LntA, which enters the host cell nucleus. Binding of LntA to BAHD1 destabilizes the repressive complex and enhances expression of ISGs and IRFs genes that further amplify IFN- and CCL5 expression.
DNA binding sites for IRFs, NF-B and ISGF3 are shown by boxes. Chromatin nucleosomes are shown by circles. MAMPs. IRF, Interferon Regulatory Factor; ISRE, Interferon Stimulation Response Element; ISGF3, Interferon-Stimulated Gene Factor-3.
Fig. S8. Bacterial intracellular multiplication in LoVo cells is not altered by IFN--stimulation.
LoVo cells were pre-stimulated 24 h before infection with WT L. monocytogenes (left) or stimulated together with infection (right), with increasing concentration of purified recombinant IFN-2. Cell response to IFN-2 was checked in parallel by quantifying representative ISG transcripts by qRT-PCR (not shown). The number of intracellular bacteria in infected cells was not statistically different, with or without IFN-2 treatment.