HAL Id: hal-01880400
https://hal.archives-ouvertes.fr/hal-01880400
Submitted on 25 Sep 2018
HAL is a multi-disciplinary open access
archive for the deposit and dissemination of
sci-entific research documents, whether they are
pub-lished or not. The documents may come from
teaching and research institutions in France or
abroad, or from public or private research centers.
L’archive ouverte pluridisciplinaire HAL, est
destinée au dépôt et à la diffusion de documents
scientifiques de niveau recherche, publiés ou non,
émanant des établissements d’enseignement et de
recherche français ou étrangers, des laboratoires
publics ou privés.
An empirical study to determine the optimal k in
Ek-NNclus method
Yiru Zhang, Tassadit Bouadi, Arnaud Martin
To cite this version:
Yiru Zhang, Tassadit Bouadi, Arnaud Martin. An empirical study to determine the optimal k in
Ek-NNclus method. 5th International Conference on Beleif Functions (BELIEF2018), BFAS, Sep 2018,
Compiègne, France. �hal-01880400�
in Ek-NNclus method
Yiru Zhang, Tassadit Bouadi, and Arnaud Martin Univ Rennes 1, CNRS, IRISA
{firstname.lastname}@irisa.fr http://www-druid.irisa.fr/
Abstract. Ek-NNclus is a clustering algorithm based on the evidential k-nearest-neighbor rule. It has the advantage that the number of clusters can be detected unlike a c-means for example. However, the parameter k has crucial influence on the clustering results, especially for the number of clusters and clustering quality. Thus, the determination of k is an important issue to optimize the use of the Ek-NNclus algorithm. The authors of Ek-NNclus only give a large interval of k, which is not precise enough for real applications. In traditional clustering algorithms such as c-means and c-medo¨ıd, the determination of c is a real issue and some methods have been proposed in the literature and proved to be efficient. In this paper, we borrow some methods from c determination solutions and propose a k determination strategy based on an empirical study. Keywords: Ek-NNclus; k determination; clustering
1
Introduction
In cluster analysis, choosing the optimal number of clusters is a well-known problem [7, 1]. For many clustering algorithms (such as c-means, c-medoids, etc.), the number of clusters noted by c must be pre-defined1. The correct choice of
c is not simple, needing most of the time a subjective interpretation of some criterion directly linked with the structure of data and the wanted clustering resolution.
The Ek-NNclus method, proposed by [3], does not need the pre-definition of the parameter c and is able to detect the number of clusters. However, as Ek-NNclus is based on the k-nearest neighbors, the parameter k, given the size of neighborhood, should be set. Different k may result in various clustering results and often with different number of clusters. Therefore, Ek-NNclus has replaced the problem of c determination by the problem of finding a proper value for k. In [3], the authors concluded that the results of clustering are mostly conducted by the parameter k. Following the rule of thumb, such as the determination k in
1
In many articles, the number of clusters is denoted by k. To avoid ambiguity with another parameter k of k-nearest neighbors in Ek-NNclus algorithm, we use c in this article.
2 Yiru Zhang, Tassadit Bouadi, and Arnaud Martin
the k-nearest neighbors classifier, the authors also give an empirical suggestion on the determination of k, which is two or three times √n where n denotes the number of all objects. The range between two or three times √n is sometimes too wide and even within this range, the clustering results are still quite dif-ferent. Besides, in Ek-NNclus, the existence of some random processes makes the method not perfectly reproducible (i.e. on one dataset, with identical k, clustering results may not be even close).
Moreover, the optimal k varies with the scale of the data, making the deter-mination of k necessary for every clustering analysis problem. The deterdeter-mination of k is two-fold. An optimal k in Ek-NNclus should:
1. Cluster the data into the correct number of clusters;
2. Return a result with high quality, close to the real partitions of objects. There are already some often-applied methods to determine c, such as evaluation criteria (e.g. silhouette coefficient [10]) optimization, elbow method and infor-mation criterion approach. In this article, we borrow and test these methods to evaluate if they are still applicable for the determination of k in Ek-NNclus. We also propose a determination strategy based on these methods.
In the following parts, we briefly introduce the Ek-NNclus algorithm as well as some criteria for c determination in c-means in Section 2 and 3. In Section 4, we introduce the proposed k determination strategy. We illustrate this strategy on synthetic data and real-world data in Section 5 and give a conclusion in Section 6.
2
Ek-NNclus algorithm
Ek-NNclus is a clustering algorithm based on the evidential k-nearest-neighbor classifier. It requires only the pairwise metric for k-nearest-neighbor searching. Ek-NNclus starts from an initial random partition, and reassigns objects to clus-ters iteratively using Ek-NN classifier [2]. The algorithm converges to a stable partition. For each object, its membership to clusters is described by a mass function in a framework of each cluster and the whole set of clusters (i.e. ig-norance). Given a matrix of pairwise distances D = (dij), where dij denotes
the distance between object oi and object oj, according to [3], the procedure of
EkNNclus can be briefly divided into the following parts:
– Preparation Calculate the mass value αijof the event: ojis in the k-nearest
neighbors of oi based on dij by a non-increasing mapping function φ(dij).
Naturally, αij = 0 if oj does not belong to the k-nearest neighbors of oi.
– Initialization Initialize the labels of each object randomly. The authors of [3] suggest that the number of clusters c can be set to the number of objects n if n is not too large.
– Iteration Randomly reorder all objects. Then, for every object oi0 in the
new order, calculate the plausibility of belonging to each cluster. Assign oi0
– Convergence condition The iterations stop when the labels of all objects are stable.
In this procedure, the number of k at the preparation step has a vital impact on the clustering results. If k is too small, the matrix of α becomes sparse. In this case, the number of iterations is small and the clustering result highly depends on the initialization step, which is usually random. If k is too large, two objects far away from each other may be considered as in the same neighborhood. This may have two consequences:
1. The computation time becomes important;
2. Objects naturally in different clusters may be targeted as in the same one, causing an underestimation of number of clusters.
Therefore, the determination of k is important to guarantee a good quality of clustering.
3
Some methods in c determination
Some solutions from c determination for c-means algorithm are borrowed to help the determination of k in Ek-NN algorithm. In this section, we introduce how Adjusted Rand Index (ARI), silhouette coefficient and elbow method are applied for the determination of optimal c.
Adjusted Rand Index (ARI)
Rand index (RI) [8] is a measure of similarity between two data clustering. Developed from RI, Adjusted RI (ARI) is adjusted for chance grouping of objects in clusters [8, 12]. We use ARI as the priority criterion for the evaluation of the clustering result with the knowledge of the ground truth given. Thus, the cluster number c that returns the highest ARI value is determined as the optimal one.
Silhouette coefficient
Silhouette coefficient is useful in determining the natural number of clusters [1, 10]. The silhouette coefficient is an evaluation criterion, in which the calcula-tion is only based on the intra-class and inter-class distances of each object pair. A higher silhouette coefficient score relates to a model with better defined clusters. Thus, the problem of optimal c determination can be transferred to a silhouette coefficient maximization problem [1]. Another advantage of silhouette coefficient is that only pairwise distances are needed and the calculating of cen-ters is avoided. Indeed, independent to centroid is a good property. For some metrics where only pairwise distances are given, the calculation of centroid is a metric k-center problem, proved to be NP-hard[4].
Elbow method
The elbow method [11] applies the distortion as a criterion for clustering result. The rule is simple: among different number of clusters C, one should choose a number c ∈ C, such that c + 1 clusters do not give a much better modeling of the data. Given n objects in c clusters, we denote the objects by x1, x2, . . . , xn and
4 Yiru Zhang, Tassadit Bouadi, and Arnaud Martin
the center of clusters by µ1, µ2, . . . , µc. The quality of the modeling is measured
by the distortion J of the clustering, calculated by:
J (c, µ) = 1 n n X i=1 ( c min j=1(xi− µj) 2) (1)
Therefore, c can be subjectively determined with the help of a distortion plot helps, illustrated in the experiment part of Section 5.2.
A disadvantage of this method is that the “elbow” cannot always be unam-biguously identified [5]. The observation of the “elbow” is subjective because “a cluster that does not give a much better modeling of the data” cannot be justified quantitatively. Another inconvenience of the elbow method is that the calcula-tion of distorcalcula-tion is based on the centroid of each cluster. This jeopardizes the property that Ek-NNclus is independent of the calculation of centroid.
4
A k determination strategy
The idea of k determination is simple: an optimal k in EkNNclus should return a high quality clustering result. Given a dataset, the quality of clustering can be easily evaluated if knowledge of ground truth is provided. A high value of ARI between clustering result and the ground truth implies a good clustering quality. However, in most cases, the ground truth is absent. The results of clustering are often evaluated by how well different clusters are separated. Silhouette coefficient is such a criteria and it is often strongly correlated with ARI. The correlation is plotted in the Section 5.1. However, to determine k only by silhouette coefficient is still risky. Fewer clusters may sometimes return a higher silhouette coefficient (example illustrated in Section 5.1 and Figure 4b). Thus, other conditions are needed. Elbow method is used as the second criterion to avoid that too few clusters are detected. The strategy is straightforward. From the intersection of the set of k (Kc) corresponding to the best c and the set of k (Ksil) corresponding
to relatively high silhouette coefficient, the interval of values of k is obtained. We denote a set of all possible k by K. A proper subset of k is therefore refined by: Kref ine= Kc∩ Ksil. We define a silhouette efficient function fsc(k), implying
the silhouette coefficient of the clustering result with k in Ek-NNclus algorithm. Thus, the optimal k is given by:
k = arg max
k∈Kref ine
(fsc(k)). (2)
Note that the elbow method is subjective and that “relatively high silhouette coefficients” are also subjectively defined, both Kcand Ksilare not definite sets.
Thus, if Kref ine = ∅, we can extend Kc by softer condition or Ksil by lower
threshold to obtain a non empty Kref ine.
5
Experimentation results
In this section, we study the correlation between ARI and silhouette coefficient, and then applied our strategy on toy datasets. The synthetic data are generated
by Gaussian distributions. For the sake of better visualization, the synthetic data are always generated in a 2 dimensional space.
5.1 Correlation between ARI and silhouette coefficient
We generate synthetic datasets for this experiment. The procedure is as follows: 1. Given a set of standard deviation (noted std) and the number of clusters denoted by nclus, we generate a set of datasets Sdata = {X1, X2, . . . , XD}
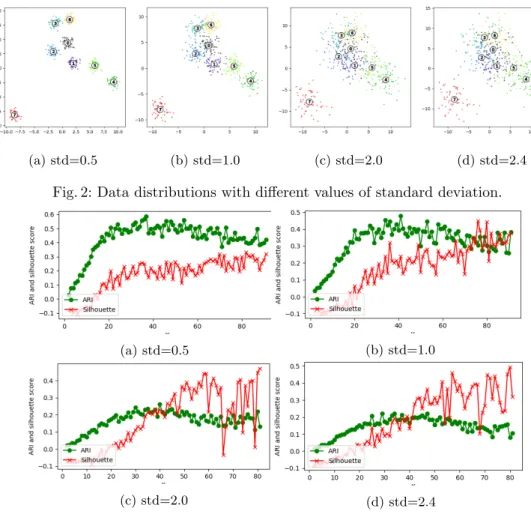
with ground truth. Datasets with 8 clusters and with std = 0.5, 1.0, 2, 2.5 are illustrated in Figure 2.
2. On one dataset Xd ∈ Sdata, given a set of parameter values
K = {k1, k2, . . . , k|K|}, calculate ARI and silhouette coefficient of each k ∈ K.
A set of ARIs and silhouette coefficients are obtained corresponding to dif-ferent k, respectively denoted as SARI and Ssil. The Pearson correlation
coefficient [9] ρ(SARI, SARI) is calculated for dataset Xd, denoted by ρd.
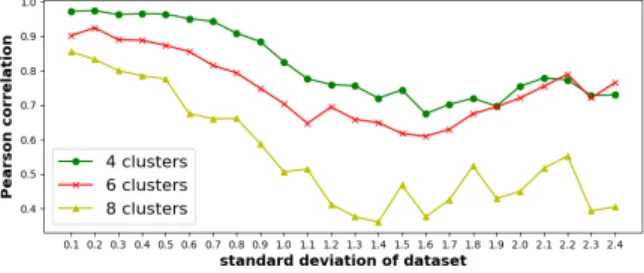
Fig. 1: Pearson correlation coefficient between ARI and silhouette vs data sets with different std.
Figure 1 illustrates the variation of the correlation between ARI and silhou-ette coefficient via different standard deviations. We observe that the correlation declines while data are distributed more sparsely. From a certain standard devi-ation, the correlation has a tendency to increase. These are datasets used in the experiment of Figure 1. While std is small, data are obviously clustered. Thus a clustering result regrouping objects nearby is consistent with the knowledge of the ground truth, which returns a high correlation. With std increasing, dif-ferent clusters overlap and the correlation decreases. When std is high enough that data distribution converges to random, the clustering returns lows values on both ARI and silhouette coefficient, making them “correlated” again.
However, the strong correlation cannot guarantee that silhouette coefficient is enough for k determination. The ARI and silhouette coefficient obtained from different k on data in Figure 2 are respectively plotted in Figure 3. We observe that a high silhouette coefficient does not always correspond to a high ARI when value of k is large, even if objects in different clusters are naturally well separated (e.g. dataset with std = 0.5). This has been explained in Section 2 that a high value on k may cause underestimation of the number of clusters c, which may
6 Yiru Zhang, Tassadit Bouadi, and Arnaud Martin
(a) std=0.5 (b) std=1.0 (c) std=2.0 (d) std=2.4 Fig. 2: Data distributions with different values of standard deviation.
(a) std=0.5 (b) std=1.0
(c) std=2.0 (d) std=2.4
Fig. 3: ARI and Silhouette coefficient via k on different datasets.
result in a satisfying silhouette coefficient. Elbow method determining the c helps to provide a constraint condition.
5.2 Optimal k determination strategy on real toy datasets
We applied the strategy in Section 4 on real toy datasets: Iris and Wine datasets from UCI2 to help to refine the interval of k.
Toy dataset Iris: Figure 4 illustrates the plot supporting k determination strategy for Iris toy data. Results are obtained with a cross validation of 10 experiments. We still observe that the values of ARI, silhouette coefficient and number of clusters have large fluctuation, which proves that the determination of k is risky.
2 Iris: https://archive.ics.uci.edu/ml/datasets/Iris
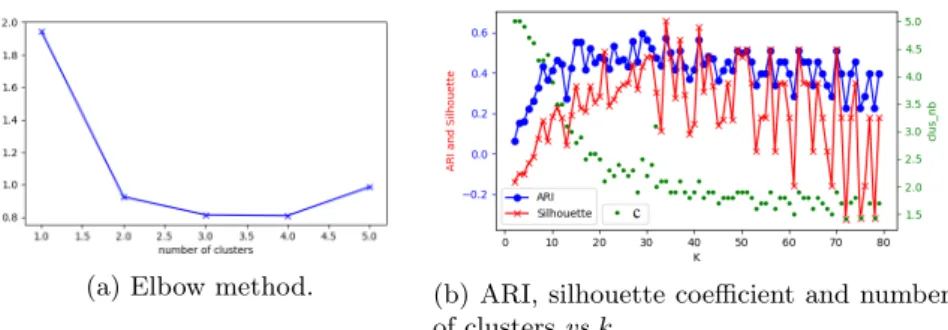
(a) Elbow method. (b) ARI, silhouette coefficient and number of clusters vs k.
Fig. 4: Results on Iris dataset.
Without knowledge of c, from the silhouette coefficient plot in Figure 4b, one may conclude that k ∈ [30, 50] is the best value. With elbow method, we can figure that c = 2 or 3 is a reasonable value, so k ∈ [15, 40] is more reasonable. Taking the intersection of both intervals, we focus on a refined interval k ∈ [30, 40]. In this interval, k = 35 returns the highest silhouette coefficient (given by the abscissa of Figure 4b). Thus, finally we determine k = 32 by equation (2). With the ARI plot (given by the ordinate of Figure 4b), we can verify that k ≈ 35 is the proper value, so the proposed strategy is adapted.
Toy dataset Wine: The elbow method and clustering criteria plot are illustrated in Figure 5. It is tricky to determine the number c of clusters by
(a) Elbow method. (b) ARI, silhouette coefficient and number of clusters vs k.
Fig. 5: Results on Wine dataset.
Elbow method for this dataset. Different observers may give different decisions on the best number of clusters. Therefore, 3 or 4 can both be concluded as c. According to Figure 5b, c ∈ {3, 4} corresponds approximately to k ∈ [20, 50]. A high silhouette coefficient value corresponds to the interval k ∈ [40, 70]. By taking the intersection of both intervals, we conclude that a proper k should be in the interval [40, 50] and we obtain k = 49 such as the optimal value by equation (2).
According to Figure 5b, with only silhouette coefficient, we may arbitrarily choose a high value k ∈ [60, 70]. However, this value gives an underestimation of the c value. The elbow method fixing a proper number of clusters helps to determine a k that returns the highest ARI.
8 Yiru Zhang, Tassadit Bouadi, and Arnaud Martin
6
Conclusion
In this article, we discuss a practical problem encountered in the application of EkNNclus algorithm: the determination of the optimal number of nearest neigh-bors k. Based on some methods borrowed from determination of the number c of clusters in c-means, we proposed a combined strategy. In this strategy, silhou-ette coefficient is applied to evaluate the clustering quality and elbow method is used as an extensive procedure for over-fitting. Comparing with an empirical suggestive interval for k determination given by [3], the proposed strategy gives a more refined selection of k and guarantees a relative high quality of clustering. The strategy has some short-comings conducted by elbow method. Firstly, the determination of c by elbow method is subjective and can be sometimes am-biguous. Besides, the distortion requires the calculation of centroids of clusters, which neutralizes an advantage of Ek-NNclus: Ek-NNclus is centroid indepen-dent. In the future, we can replace elbow method by centroid-independent c determination method, making the strategy more adaptable.
References
1. De Amorim, R.C., Hennig, C.: Recovering the number of clusters in data sets with noise features using feature rescaling factors. Information Sciences 324, 126–145 (2015)
2. Denoeux, T.: A k-nearest neighbor classification rule based on dempster-shafer theory. IEEE transactions on systems, man, and cybernetics 25(5), 804–813 (1995) 3. Denoeux, T., Kanjanatarakul, O., Sriboonchitta, S.: Ek-NNclus: A clustring pro-cedure based on the evidential k-nearest neighbor rule. Knowledge-Based Systems 88(C), 57–69 (2015)
4. Hsu, W.L., Nemhauser, G.L.: Easy and hard bottleneck location problems. Discrete Applied Mathematics 1(3), 209 – 215 (1979)
5. Ketchen Jr, D.J., Shook, C.L.: The application of cluster analysis in strategic management research: an analysis and critique. Strategic management journal pp. 441–458 (1996)
6. Llet´ı, R., Ortiz, M.C., Sarabia, L.A., S´anchez, M.S.: Selecting variables for k-means cluster analysis by using a genetic algorithm that optimises the silhouettes. Ana-lytica Chimica Acta 515(1), 87–100 (2004)
7. Pham, D.T., Dimov, S.S., Nguyen, C.D.: Selection of k in k-means clustering. Pro-ceedings of the Institution of Mechanical Engineers, Part C: Journal of Mechanical Engineering Science 219(1), 103–119 (2005)
8. Rand, W.M.: Objective criteria for the evaluation of clustering methods. Journal of the American Statistical association 66(336), 846–850 (1971)
9. Rodgers, J.L., Nicewander, W.A.: Thirteen ways to look at the correlation coeffi-cient. The American Statistician 42(1), 59–66 (1988)
10. Rousseeuw, P.J.: Silhouettes: A graphical aid to the interpretation and validation of cluster analysis. Journal of Computational and Applied Mathematics 20, 53 – 65 (1987)
11. Thorndike, R.L.: Who belongs in the family? Psychometrika 18(4), 267–276 (1953) 12. Vinh, N.X., Epps, J., Bailey, J.: Information theoretic measures for clusterings comparison: Variants, properties, normalization and correction for chance. Journal of Machine Learning Research 11(Oct), 2837–2854 (2010)