HAL Id: hal-01103540
https://hal.archives-ouvertes.fr/hal-01103540
Submitted on 17 Jan 2015
HAL is a multi-disciplinary open access
archive for the deposit and dissemination of
sci-entific research documents, whether they are
pub-lished or not. The documents may come from
teaching and research institutions in France or
abroad, or from public or private research centers.
L’archive ouverte pluridisciplinaire HAL, est
destinée au dépôt et à la diffusion de documents
scientifiques de niveau recherche, publiés ou non,
émanant des établissements d’enseignement et de
recherche français ou étrangers, des laboratoires
publics ou privés.
Southern westerlies in LGM and future (RCP4.5)
climates
Y. Chavaillaz, F. Codron, M. Kageyama
To cite this version:
Y. Chavaillaz, F. Codron, M. Kageyama. Southern westerlies in LGM and future (RCP4.5) climates.
Climate of the Past, European Geosciences Union (EGU), 2013, 9 (2), pp.517-524.
�10.5194/cp-9-517-2013�. �hal-01103540�
Clim. Past, 9, 517–524, 2013 www.clim-past.net/9/517/2013/ doi:10.5194/cp-9-517-2013
© Author(s) 2013. CC Attribution 3.0 License.
EGU Journal Logos (RGB)
Advances in
Geosciences
Open Access
Natural Hazards
and Earth System
Sciences
Open AccessAnnales
Geophysicae
Open AccessNonlinear Processes
in Geophysics
Open AccessAtmospheric
Chemistry
and Physics
Open AccessAtmospheric
Chemistry
and Physics
Open Access DiscussionsAtmospheric
Measurement
Techniques
Open AccessAtmospheric
Measurement
Techniques
Open Access DiscussionsBiogeosciences
Open Access Open Access
Biogeosciences
DiscussionsClimate
of the Past
Open Access Open Access
Climate
of the Past
Discussions
Earth System
Dynamics
Open Access Open Access
Earth System
Dynamics
DiscussionsGeoscientific
Instrumentation
Methods and
Data Systems
Open Access
Geoscientific
Instrumentation
Methods and
Data Systems
Open Access DiscussionsGeoscientific
Model Development
Open Access Open Access
Geoscientific
Model Development
DiscussionsHydrology and
Earth System
Sciences
Open AccessHydrology and
Earth System
Sciences
Open Access DiscussionsOcean Science
Open Access Open Access
Ocean Science
DiscussionsSolid Earth
Open Access Open Access
Solid Earth
DiscussionsThe Cryosphere
Open Access Open Access
The Cryosphere
Discussions
Natural Hazards
and Earth System
Sciences
Open Access
Discussions
Southern westerlies in LGM and future (RCP4.5) climates
Y. Chavaillaz1, F. Codron1, and M. Kageyama21LMD/IPSL, Laboratoire de M´et´eorologie Dynamique, UMR8539, CNRS, Universit´e Pierre et Marie Curie, Case Postale 99,
4 Place Jussieu, 75252 Paris Cedex 05, France
2LSCE/IPSL, Laboratoire des Sciences du Climat et de l’Environnement, UMR8112, CEA-CNRS-UVSQ – CE Saclay,
L’Orme des Merisiers, Bat. 701, 91191 Gif-sur-Yvette Cedex, France Correspondence to: F. Codron ([email protected])
Received: 31 July 2012 – Published in Clim. Past Discuss.: 15 August 2012
Revised: 21 December 2012 – Accepted: 26 January 2013 – Published: 1 March 2013
Abstract. Mid-latitude westerlies are a major component of the atmospheric circulation and understanding their be-haviour under climate change is important for understand-ing changes in precipitation, storms and atmosphere–ocean
momentum, heat and CO2exchanges. The Southern
Hemi-sphere westerlies have been particularly studied in terms of the latter aspects, since the Southern Ocean is a key region for
the global oceanic circulation as well as for CO2uptake. In
this study, we analyse, mainly in terms of jet stream position, the behaviour of the southern westerlies for the Last Glacial Maximum (LGM, 21 000 yr ago, which is the last past cold extreme) and for a future climate, obtained after stabilisation of the RCP4.5 scenario. The a priori guess would be that the behaviour of the westerly jet stream would be similar when examining its changes from LGM to pre-industrial (PI) con-ditions and from PI to RCP4.5, i.e. in both cases a poleward shift in response to global warming. We show that this is in fact not the case, due to the impact of altitude changes of the Antarctic ice sheet and/or to sea ice cover changes.
1 Introduction
The mid-latitude westerlies are one of the major features of the Earth’s atmospheric circulation. They are strongly related to mid-latitude weather and climate, in particular because the mid-latitude high precipitation regions are zones of frequent passages of mid-latitude storms which develop as instabili-ties along the mid-latitude jet streams. The equator-to-pole temperature gradient is one of the primary driving forces for the mid-latitude westerlies, which is expressed through the thermal wind relationship. But the eddies that develop along
the mean westerlies as a result of the baroclinic instability also feedback on the mean jet stream and help maintaining it. The fact that mid-latitude westerlies are related to storms implies a relationship with extreme storms. Thus, a better un-derstanding of the mid-latitude westerlies in climates differ-ent from the presdiffer-ent one is essdiffer-ential to gain improved con-fidence in our prediction of future changes in precipitation and extreme events. Mid-latitude westerlies also represent a strong forcing for the underlying ocean: they are responsi-ble for momentum and heat fluxes at the ocean–atmosphere interface, acting on the ocean mixed-layer and, by defini-tion, piloting the wind-driven circulation. As such, the North Atlantic westerlies have been the focus of many studies be-cause of their role in driving the Gulf stream and the North Atlantic drift, but also because they are key in driving the Atlantic Meridional Overturning Circulation (e.g. Wunsch, 2002; Kuhlbrodt et al., 2007).
The Southern Hemisphere mid-latitude westerlies run nearly undisturbed by continents and are associated with the strong Antarctic Circumpolar Current. Recently, they have received more and more attention because they are another key to the global ocean overturning circulation (Sijp and England, 2008; Marshall and Speer, 2012) but maybe even more so because they have been suggested to play an impor-tant role in the recent (Le Qu´er´e et al., 2007; Lenton et al., 2009) and future (Russell et al., 2006a) evolutions of the
up-take of anthropogenic CO2by the Southern Ocean. However,
the study of the their evolution under anthropogenic forcing and their potential impacts is currently hampered by the poor representation of the southern westerlies by climate models (Russell et al., 2006b), with an equatorward bias in the jet
518 Y. Chavaillaz et al.: Southern westerlies in LGM and future (RCP4.5) climates position which has only weakly improved in the CMIP5
ex-periments (Wilcox et al., 2012).
Southern mid-latitude westerlies have also been proposed to play a role in explaining the low level of atmospheric
CO2 concentration (185 ppmv, Monnin et al., 2001) at the
Last Glacial Maximum (LGM, 21 000 yr ago) and the
subse-quent atmospheric CO2increase during the last termination.
In particular, Toggweiler et al. (2006) and Banderas et al. (2012) suggest that an equatorward position of the
south-ern jet stream prevents CO2 stored in the deep ocean from
reaching the atmosphere at the LGM, but that as soon as the warming starts and the jet stream shifts poleward,
de-gassing of this CO2 to the atmosphere can start, therefore
providing a positive feedback to the initial warming. Many other factors, in particular involving marine biology and in-creased dust fluxes (e.g. Bopp et al., 2003), brine rejection and stratification-dependent ocean diffusion (Bouttes et al., 2012), have been proposed to play a role in the low level of
amospheric CO2concentration at the LGM but the idea that
a shift in the westerlies could have an impact on atmospheric
CO2level has fostered many studies on reconstructing these
westerlies from palaeodata.
Rojas et al. (2009) provide an extensive review of palaeo-data that have been used to reconstruct winds at the LGM. They classify these paleo-wind indicators into two cate-gories: (1) the “direct” wind indicators such as ocean up-welling or dust (although it could be argued that the latter also depends on dust sources, i.e. on vegetation, snow cover and soil humidity); and (2) indirect wind indicators such as pollen or terrigeneous supply, or glacier advances (e.g. Put-nam et al., 2010), which depend on the position of the mid-latitude front either via a dependence on precipitation or via a dependence on temperature. Hence, understanding the mech-anisms controlling the position of the mid-latitude westerlies at the LGM is important not only to evaluate its possible
im-pact on ocean circulation and atmospheric–ocean CO2
ex-changes, but also to disentangle the signals from the diverse palaeo-indicators interpreted as being related to wind. Cli-mate models can help in such a task by assessing the con-sistency in, for example, westerly wind position and pre-cipitation or temperature changes. Rojas et al. (2009) have studied four LGM simulations from the PMIP2 (Palaeocli-mate Modelling Intercomparison Project, phase 2, Bracon-not et al., 2007) in terms of changes of the southern wester-lies and storm tracks between the LGM and the pre-industrial climates. They point to a large variability in the models’ re-sponse to LGM boundary conditions and to the conflicting impacts of the increasing meridional equator-to-pole temper-ature gradient at the surface and the decreasing gradient at mid-tropospheric levels.
Turning to the future evolution of the southern westerlies, climate models consistently predict a nearly year-round pole-ward shift in response to increasing greenhouse gas concen-tration (Yin, 2005; Lorenz and DeWeaver, 2007). The ex-ception is the summer season, for which the recovery of the
ozone hole over the 21st century should compensate the im-pact of greenhouse gases (Perlwitz et al., 2008; Wilcox et al., 2012). The mechanism of this influence is not yet under-stood. Changes in the jet position are reinforced by posi-tive feedbacks between baroclinic eddies and the zonal-mean flow (Lorenz and Hartmann, 2001), that explain the domi-nance of jet shifts in the low-frequency natural variability, embodied by the Southern Annular Mode (SAM). These pos-itive feedbacks also explain why the SAM dominates the at-mospheric circulation response to climate forcings, but they tend to mask the initial causes. For example, the eddy length-scale increases in future simulations (Kidston et al., 2010), which could cause a shift of the jet, but it is not clear whether this larger scale is a direct impact of the warming (Kidston et al., 2011; Rivi`ere, 2011) or a response to the jet shift itself. In any case, it seems that changes in the meridional tem-perature gradient in the upper troposphere are a strong driver, or at least a good predictor of the jet shifts (Wilcox et al., 2012). This has been confirmed by a number of studies with idealised dynamical-core models using a Held and Suarez (1994) type of setup to which a prescribed heating was added (Butler et al., 2010; Rivi`ere, 2011; Lorenz and DeWeaver, 2007). In all cases, the modelled jets shift poleward as a re-sponse to heating in the tropical upper-troposphere or cooling of the polar stratosphere. On the contrary, a warming of the polar lower-troposphere – as expected from the polar ampli-fication predicted in the Northern Hemisphere – could lead to an equatorward jet shift.
Our objective here is to study the changes in the charac-teristics of the Southern Hemisphere westerlies in the con-trasting climates of the LGM and the future, compared to the pre-industrial reference state. We make use of the newly available CMIP5/PMIP3 simulations, performed for each of the 6 models analysed here, with the same model version for the LGM, pre-industrial and future climate simulations. Af-ter describing these simulations and the diagnostics chosen for our analyses (Sect. 2), we first assess the mean changes in southern jet stream for both climates and study the rela-tionship between these mean changes and the modes of inter-annual variability found for the pre-industrial state (Sect. 3). We then show that it is possible to derive a simple relation-ship, valid for the LGM and future climates, between changes in the temperature field and the position of the jet stream (Sect. 4). Section 5 discusses and summarizes our results.
2 Numerical experiments and jet stream definition 2.1 CMIP5/PMIP3 simulations
This work is based on simulations produced within the framework of the CMIP5 (Coupled Model Intercomparison Project, Taylor et al., 2012) and of the PMIP3 (Palaeoclimate Modelling Intercomparison Project, Otto-Bliesner et al., 2009; Braconnot et al., 2012) projects. These CMIP5/PMIP3
simulations use coupled atmosphere–ocean–sea ice (carbon cycle) models which do not include interactive ice sheets. For a given model, the same model version has been used for all CMIP5/PMIP3 simulations, which makes a rigorous comparaison of past vs. future simulated changes possible. Since our aim is to study, within a common framework, LGM vs. future changes in the Southern Hemisphere westerly jet stream, we selected models which had both performed an LGM simulation and the RCP4.5 scenario. We chose this middle RCP scenario because the corresponding radiative forcing is roughly the opposite to that of the LGM. We stud-ied the stabilised part of this scenario, after year 2100. For all models, we have computed and analysed the climatologi-cal averages over 50 yr, from year 2251 to year 2300, for the RCP4.5 scenario. The LGM and PI (pre-industrial) simula-tions being equilibrium ones, we have considered averages over the final 50 yr of these runs. Since we only study one RCP scenario, we will refer to these RCP4.5 simulations as the “RCP” simulations in the rest of the text.
At the time of analysis of these results (Spring 2012), there were six such models: CNRM-CM5, GISS-E2-R,
IPSL-CM5A-LR, NCAR-CCSM, MIROC-ESM and
MPI-ESM-P. For simplicity we will refer to them as follows: CNRM, GISS, IPSL, NCAR, MIROC and MPI, respectively. The LGM simulations all follow the PMIP3
protocol (https://wiki.lsce.ipsl.fr/pmip3/doku.php/pmip3:
design:21k:final), in particular in terms of orbital param-eters set to their 21 000 yr ago values (Berger, 1978) and lower concentration of atmospheric greenhouse gases (185 ppm for CO2, Monnin et al., 2001; 350 ppb for CH4,
Dallenbach et al., 2000; and 200 ppb for N2O, Fl¨uckiger
et al., 1999). All models use the PMIP3 LGM ice sheets (https://wiki.lsce.ipsl.fr/pmip3/doku.php/pmip3:design:21k: icesheet:index), except for the GISS model which uses the ICE5.2G ice sheets (Peltier, 2004). The LGM ice sheets are imposed as changes in the boundary conditions. This implies (1) adapting the coastlines to their LGM configuration, (2) changing the topography/bathymetry, and (3) changing the ice sheet extent. The way these changes are implemented differs from model to model. This can eventually result in differences in the models’ boundary conditions, as shown in Fig. 1 for the Antarctic changes in topography, as recom-puted from surface pressure; even though the same boundary conditions were applied to all models except GISS, the translation of this forcing for each of the models yields different altitude differences. These are particularly small for CNRM compared to the other four PMIP3 models. For these latter models, the largest altitude changes are located over West Antarctica, with local differences reaching 1500 m (more ice at LGM than for PI). The same is true for GISS, while in CNRM the altitude difference is only 1000 m at most and over more restricted regions than in other models.
For our analysis of the relationship between the change in maximum jet stream position and temperature changes at the pole and in the tropics (Sect. 4), we included
Fig. 1. LGM ice sheets for the six models included in the present analysis: altitude PI–LGM difference. This is a reconstructed dif-ference using surface pressure, as topography was not available for all models. Units are in equivalent-meters, using a height-scale of 7 km.
six other models for which the PI and RCP4.5 simula-tions were available: IPSL-CM5A-MR, IPSL-CM5B-LR, bcc-csm-1, CanESM2, FGOALS-g2 and NorESM1-M. The IPSL-CM5A-MR model is the same as the version used for the rest of the study, except for a higher horizontal resolution (leading to a more poleward jet, cf. Hourdin et al., 2012); IPSL-CM5B-LR has the same resolution but a new physical package. Adding these models increases the number of de-grees of freedom for the correlation calculations in this sec-tion and helps building more significant relasec-tionships. 2.2 Jet stream definition
To characterise the Southern Hemisphere westerly jets in the LGM, PI and RCP simulations, we have chosen to use the 850-hPa zonal wind. This level characterises the eddy-driven jet and its fluctuations while remaining above the surface boundary layer. The wind speed is larger at the tropopause level, but the upper-level jet is driven by a combination of ed-dies and the Hadley cell, and its position is less meaningful: a strong subtropical jet can hide changes in the near-surface winds, which are the ones interacting with the ocean.
The characteristics of the jet are computed by first taking a time and zonal average of the zonal wind. A quadratic in-terpolation around the grid point with maximum mean wind then yields the exact latitude of the mean jet as well as its velocity. These will be refered to as jet latitude or speed in the following.
520 Y. Chavaillaz et al.: Southern westerlies in LGM and future (RCP4.5) climates 3 Southern Hemisphere jet stream behaviour under
future and glacial conditions 3.1 Mean behaviour
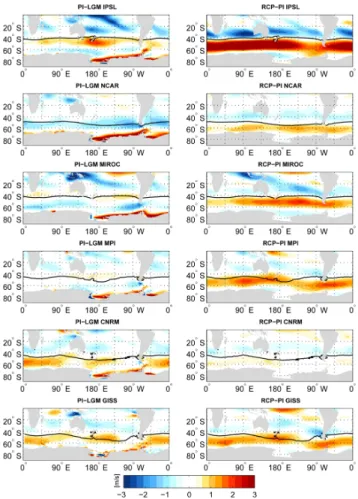
For an easier comparison between past and future climate changes, we examine the RCP–PI anomalies on the one hand, and the PI–LGM anomalies on the other, i.e. the anomalies corresponding to a warming in both cases: warming since the LGM for the latter case; predicted future warming, compared to PI conditions, for the former case. In the following, we will refer to the “LGM anomalies” for the PI–LGM anomalies and to the “RCP anomalies” for the RCP–PI anomalies.
Figure 2 shows, for each model, the position of the jet stream for the PI run and the LGM and RCP zonal wind anomalies. The structure of RCP anomalies for all models is a latitudinal dipole centered on the mean jet position, in-dicative of a poleward shift of the jet stream. This poleward shift is quantified from the zonal-mean 850-hPa zonal winds in Fig. 3 (left panel). It is strongest for the IPSL model, which
simulates a 3.5◦poleward shift and ranges from 0.7 to 1.5◦
for other models. Figure 3 (right panel) shows that the maxi-mum speed of the jet stream also increases in all the
simula-tions, by 0.5 to slightly more than 1 m s−1. These changes are
therefore consistent for all models, even though there are dif-ferences in the amplitude of the anomalies. In particular the anomalies simulated by the CNRM model appear as being the weakest on the maps of Fig. 2 (right panel).
The LGM anomalies, in contrast, are far from being con-sistent for all models. This can already be seen from the maps of Fig. 2 (left panel). IPSL, CNRM and GISS simulate a poleward displacement for all longitudes, NCAR simulates a decrease of the wind speed and a slight equatorward dis-placement of the jet maximum while MIROC and MPI sim-ulate an equatorward displacement and strengthening of the jet stream. This behaviour is summarised on Fig. 3.
In summary, the Southern Hemisphere westerlies show a consistent poleward shift and increase in maximum wind speed for the PI to future warming but not for the LGM to PI warming. This is intriguing because we could have expected a similar behaviour for both forcings, given that the the main forcing at LGM in the Southern Hemisphere is expected to be the one related to the lower greenhouse gas concentra-tions. Indeed, in contrast with the Northern Hemisphere sit-uation for which massive ice sheets are added to the North-ern Hemisphere continents at LGM, compared to PI, in the Southern Hemisphere the Antarctic ice sheet is present in the three types of simulation analysed here. In Sect. 4 we will further analyse potential reasons for the different behaviours of the jet stream for the LGM to PI and PI to RCP warmings. 3.2 Relationship with PI modes of variability
As discussed in the introduction, the atmospheric circula-tion response to an external forcing often projects strongly
Fig. 2. Anomalies (in m s−1) in 850-hPa mean annual zonal wind for the six models studied here. Left column: PI–LGM, right col-umn: RCP–PI. The position of the PI jet stream maximum is indi-cated as a black contour.
on the dominant modes of internal variability: being the least damped modes, they are also the most sensitive ones.
In the Southern Hemisphere, the first EOF of the zonal-mean zonal wind, i.e. the SAM, is a dipole centered on the mean jet latitude, and thus represents a meridional shift of that jet (Lorenz and Hartmann, 2001). This behaviour is well reproduced by all the models in the PI simulation (Fig. 4, showing EOFs of monthly 850-hPa zonal-mean zonal wind), with the node of the SAM following the different mean lat-itudes of the simulated jet. The second EOF is, by con-struction, orthogonal to the first, and can be interpreted as a strenghtening and narrowing of the jet (conserving angular momentum), although it could also play a role in large shifts of the jet (Fyfe and Lorenz, 2005).
The RCP and LGM time-mean changes of the zonal-mean zonal wind at 850 hPa are shown in Fig. 4 together with the anomalies corresponding to one monthly standard deviation of the first two EOFs. In all cases, the future changes project most strongly on the first EOF or SAM (average pattern cor-relation of 0.85), indicating that the changes are dominated by shifts of the jet (cf. Table 1). This is also true of LGM
Table 1. Spatial (90–0◦latitude) correlation of anomaly patterns of 850-hPa zonal-mean zonal wind: the first and second EOFs of the PI simulation, and the PI–LGM and RCP–PI differences.
IPSL NCAR MIROC MPI CNRM GISS RCP–PI EOF1 0.92 0.88 0.85 0.80 0.85 0.78 EOF2 0.25 −0.19 0.13 0.29 0.17 −0.06 PI–LGM EOF1 0.22 −0.09 −0.13 0.08 0.61 0.54 EOF2 0.39 −0.32 0.28 0.28 0.17 0.11
Fig. 3. Left panel: jet stream poleward shift (◦of latitude) and right panel: wind speed maximum anomaly (m s−1), PI–LGM (in blue) and RCP–PI (in red).
changes for the CNRM and GISS models, which both behave similarly in the past and future. For the other 4 models, how-ever, the LGM changes project better, if anything, on the sec-ond EOF, although the pattern correlations are weaker than for the RCP case (average of 0.32).
4 A simple relationship between jet stream and temperature differences?
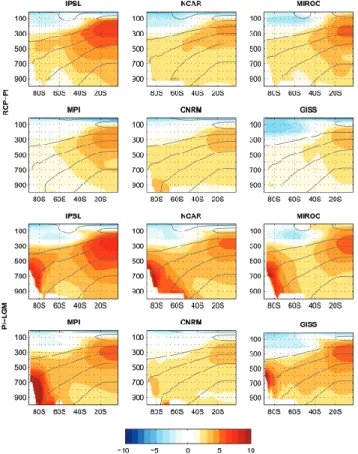
In order to try and understand the different behaviours of the southern westerlies in the PI–LGM vs. RCP–PI anoma-lies, we first turn to the zonal-mean temperature anomalies (Fig. 5), since the meridional thermal gradient is one of the drivers of the westerlies. For both the past and future situ-ations, this figure shows the expected general tropospheric warming and high-latitude stratospheric cooling. The spheric warming has a maximum near the top of the tropo-sphere in the tropics for both the past and future situations in all models, and a secondary maximum in the lower half of the troposphere at high latitudes for some models. Therefore, at the top of the troposphere, for the past and future evolutions, models simulate a strengthening of the meridional temper-ature gradient. This is consistent with a strengthening of the jet stream. The poleward shift of the jet stream is also consis-tent with the idealised studies (Rivi`ere, 2011), showing that a warming of the upper tropical troposphere is enough to cause a poleward shift of this jet stream.
In another idealised simulation, Rivi`ere (2011) shows that an imposed warming in the lower troposphere at high lati-tudes causes an equatorward shift of the jet stream. In the models analysed here, the maximum warming in the lower half of the troposphere at high latitudes is especially strong
−60 −40 −20 −4 −2 0 2 4 IPSL zonal wind (m/s) −60 −40 −20 −4 −2 0 2 4 NCAR −60 −40 −20 −4 −2 0 2 4 MIROC −60 −40 −20 −4 −2 0 2 4 MPI zonal wind (m/s) −60 −40 −20 −4 −2 0 2 4 latitude CNRM −60 −40 −20 −4 −2 0 2 4 GISS
Fig. 4. Latitudinal structure of the variability and response of the zonal-mean zonal wind at 850-hPa for all the models. Black lines: anomalies for 1 σ of the first (solid line) and second (dashed) EOF of the zonal-mean zonal wind in the PI simulation. Colors: mean PI– LGM (blue) and RCP–PI (red) difference. The vertical line indicates the jet position in the PI simulation.
for the PI–LGM anomaly, except for the CNRM model. In fact, a comparison of Figs. 3 and 5 shows that those models with strongest warming around Antarctica from LGM to PI (NCAR, MIROC, MPI) are those which simulate an equa-torward shift of the jet stream. In contrast, IPSL, CNRM and GISS show a near-surface high-latitude warming that is weaker or confined to Antarctica, and simulate a poleward shift of the westerlies. Hence, for the LGM to PI evolution, the westerlies are subject to contrasting influences: (1) the strengthening of the upper tropospheric temperature gradi-ent, and (2) the weakening of the lower troposphere temper-ature gradient. This appears to explain the range of model responses for the LGM case, with some models in which the upper-tropospheric influence is stronger, while in others it is the lower-tropospheric influence which is most important.
To test this idea, we study the quantitative relationships between the jet stream shift and the temperature differences at the high-latitudes and in the tropics. To do so, we define the following:
– Tpole as the averaged temperature for latitudes 90 to
65◦S and pressure levels 1000 to 600-hPa,
– Ttropas the averaged 2 m-temperature for latitudes 30◦S to the Equator.
These averages are mass and area weighted. We also define
δTtropand δTpoleas the RCP–PI or the PI–LGM anomalies in
Ttrop and Tpole, φ as the latitude of the jet stream and δφ as
its shift, with positive meaning a poleward shift.
Figure 6 shows the relationships between the jet stream
latitudinal shift δφ and the changes in Ttrop (left panel) and
Tpole(middle panel). The relationship between δφ and δTtrop
522 Y. Chavaillaz et al.: Southern westerlies in LGM and future (RCP4.5) climates
Fig. 5. Anomalies in the zonal mean temperature (in K) for the 6 models, for RCP–PI (first two rows) and PI–LGM (last two rows). Continuous lines show the mean temperature in PI.
increasing for an increase in δTtrop. The correlation between
these variables is 0.78, higher than the p = 0.01 level of 0.6 valid for this number of degrees of freedom. But this rela-tionship does not hold for the LGM (correlation of 0.26). On the other hand, Fig. 6 (middle panel) shows a significant
re-lationship between δφ and δTpolefor the LGM, with a larger
δφ for smaller values in δTpole (correlation of −0.78). But
this relationship does not hold for the RCP case (correlation of 0.25).
These results suggest that the jet stream shift could be
cor-related to a combination of the two indices δTtropand δTpole.
These two indices can be considered as independent since their correlation is 0.33. Therefore, we can perform a multi-linear regression attempting to find a relationship of the form: δφ = a × δTtrop+b × δTpole.
For a = 1.72 and b = 0.86, we find a correlation between
δφand (a × δTtrop+ b × δTpole) of 0.9. This relationship is
shown in the right panel of Fig. 6. This relationship implies a ratio of 1 : 2 between the influence of the high-latitude lower troposphere temperature change and that of the tropical tem-perature change (those having an opposite sign).
Figure 7 shows the contributions of each of these terms for each model, for the LGM and RCP cases. This figure
Fig. 6. Relationships between the anomaly of the jet stream max-imum position δφ and (a) the anomaly in tropical temperatures δTtrop, (b) the anomaly in high-latitude lower troposphere temper-ature δTpoleand (c) (a × δTtrop+ b × δTpole). See text (Sect. 4) for the definition of these quantities. The blue symbols accompanied by model names are the PI–LGM results. The corresponding red sym-bols are the RCP–PI results. Results from additional models listed in Sect. 2 are shown by filled red circles, except the IPSL models that are shown with filled blue (CM5B-LR) and green (CM5A-MR) squares.
Fig. 7. Contribution to (a × δTpole+ b × δTtrop) for each model, for PI–LGM and RCP–PI: in red a × δTtrop, in blue b × δTpole.
illustrates the stronger influence of the change in tropical temperatures for the RCP case, and the near balance between the two terms for the LGM case, except for the CNRM and GISS models.
5 Summary, discussion and perspectives
In this work, we have examined the behaviour of the southern westerlies for two constrasting climate changes compared to the pre-industrial conditions: the Last Glacial Maximum cli-mate and the stabilised part of the RCP4.5 future scenario. Because these climates are characterised by a radiative forc-ing of similar amplitude from PI to RCP and from LGM to PI, an a priori guess would have been to obtain a similar behaviour of the jet stream: since the jet streams had been shown to consistently move poleward under increased atmo-spheric greenhouse gas conditions, the guess was for a pole-ward shift from the LGM to the PI conditions as well.
We analysed the results of the 6 models for which LGM, PI and RCP4.5 simulations were available (in spring 2012) in the CMIP5 database. All models indeed show a poleward shift of the jet stream under the RCP conditions. The addi-tional RCP simulations analysed in Sect. 4 also show this poleward shift. However, in the case of the LGM to PI evo-lution (i.e. warming due to the deglaciation), three models
show a modest equatorward shift of the westerlies, while the other three show a poleward shift. A comparison with the dominant modes of variability in the PI simulation shows that the future changes project strongly on the first mode, the SAM, indicating that the jet shift dominates the response. There is, however, no such systematic relationship in the LGM to PI case.
An explanation for this a priori paradoxical behaviour of the LGM jet stream is found in the latitude-height structure of the temperature anomaly field. In the RCP case, the up-per tropospheric meridional temup-perature gradient strength-ens due to both an upper-tropospheric tropical warming and a polar stratospheric cooling. This behaviour is also found in the evolution from LGM to PI, but an additional factor comes into play: from LGM to PI, the three models which simulate an equatorward shift of the westerlies are those who simulate a strong warming in the lower troposphere over and around Antarctica. This could be due to the decreased altitude of the Antarctic ice sheet, even though this decrease is strong only over West Antarctica, and to possible sea ice cover changes between the LGM and PI states.
To assess the importance of the two factors, i.e. the tropical temperature changes vs. the lower troposphere high-latitude temperature changes, we have quantified their correlation with the jet stream latitudinal position. As expected, good correlations are obtained between the jet stream shift and the tropical temperature changes for the RCP case, while the best correlation is obtained with the lower troposphere high-latitude temperature changes in the LGM case. This can be expressed in a unified manner by performing a regression analysis between the jet stream shift and a combination of both these temperature changes.
This work therefore shows that in terms of the southern westerlies, contrary to theoretical expectations, the LGM to PI evolution does not necessarily ressemble the PI to fu-ture one. Altitude changes of the Antarctic ice sheet prob-ably play a large role, as well as Southern Ocean sea ice changes which could cause strong surface temperature changes. A perspective to this work is to test the impact of each of these changes with several models. This is the only way by which we will be able to know which fac-tor is most important. As seen in the introduction, if the westerlies are so sensitive to changes in the altitude of the Antarctic ice sheet, there are strong implications for the understanding of the LGM climate and atmosphere–
ocean CO2exchanges. Reconstructing the past evolution of
the Antarctic ice sheet is a very difficult task, as shown by the differences between the two available
reconstruc-tions (cf. https://pmip3.lsce.ipsl.fr/wiki/lib/exe/fetch.php/
pmip3:design:21k:icesheet:gaa5.pdf and corresponding dis-cussion on https://pmip3.lsce.ipsl.fr/wiki/doku.php/pmip3: design:21k:icesheet:index). Our work shows that LGM to PI Antarctic ice sheet altitude changes could have a profound impact on the Southern Hemisphere westerlies and that the differences related to the different reconstructions should be
investigated further. This has also implications for the future evolution of the westerlies, since at present, no model takes the ice sheet evolution into account but if the Antarctic ice sheet evolves, this could also have an impact on the southern westerlies.
Acknowledgements. We acknowledge the World Climate Research Programme’s Working Group on Coupled Modelling, which is responsible for CMIP, and we thank the climate modelling groups (listed in Sect. 2.1 of this paper) for producing and making available their model output. For CMIP the US Department of Energy’s Program for Climate Model Diagnosis and Intercomparison provides coordinating support and led development of software infrastructure in partnership with the Global Organization for Earth System Science Portals. We also thank the team led by S. Denvil at IPSL for their efficient CMIP5/PMIP3 data management.
Edited by: C. Brierley
The publication of this article is financed by CNRS-INSU.
References
Banderas, R., ´Alvarez-Solas, J., and Montoya, M.: Role of CO2and Southern Ocean winds in glacial abrupt climate change, Clim. Past, 8, 1011–1021, doi:10.5194/cp-8-1011-2012, 2012. Berger, A. L.: Long-term variations of daily insolation and
Quater-nary climatic changes, J. Atmos. Sci., 35, 2362–2367, 1978. Bopp, L., Kohfeld, K., Le Quere, C., and Aumont, O.: Dust impact
on marine biota and atmospheric CO2during glacial periods, Pa-leoceanography, 18, 1046, doi:10.1029/2002PA000810, 2003. Bouttes, N., Paillard, D., Roche, D. M., Waelbroeck, C., Kageyama,
M., Lourantou, A., Michel, E., and Bopp, L.: Impact of oceanic processes on the carbon cycle during the last termination, Clim. Past, 8, 149–170, doi:10.5194/cp-8-149-2012, 2012.
Braconnot, P., Otto-Bliesner, B., Harrison, S., Joussaume, S., Pe-terchmitt, J.-Y., Abe-Ouchi, A., Crucifix, M., Driesschaert, E., Fichefet, Th., Hewitt, C. D., Kageyama, M., Kitoh, A., Laˆın´e, A., Loutre, M.-F., Marti, O., Merkel, U., Ramstein, G., Valdes, P., Weber, S. L., Yu, Y., and Zhao, Y.: Results of PMIP2 coupled simulations of the Mid-Holocene and Last Glacial Maximum – Part 1: experiments and large-scale features, Clim. Past, 3, 261– 277, doi:10.5194/cp-3-261-2007, 2007.
Braconnot, P., Harrison, S. P., Kageyama, M., Bartlein, P. J., Masson-Delmotte, V., Abe-Ouchi, A., Otto-Bliesner, B., and Zhao, Y.: Evaluation of climate models using palaeoclimatic data, Nature Climate Change, 2, 417–424, doi:10.1038/NCLIMATE1456, 2012.
Butler, A. H., Thompson, D. W. J., and Heikes, R.: The Steady-State Atmospheric Circulation Response to Climate Change-like
Ther-524 Y. Chavaillaz et al.: Southern westerlies in LGM and future (RCP4.5) climates mal Forcings in a Simple General Circulation Model, J. Climate,
23, 3474–3496, doi:10.1175/2010JCLI3228.1, 2010.
Dallenbach, A., Blunier, T., Fluckiger, J., Stauffer, B., Chappellaz, J., and Raynaud, D.: Changes in the atmospheric CH4gradient between Greenland and Antarctica during the Last Glacial and the transition to the Holocene, Geophys. Res. Lett., 27, 1005– 1008, 2000.
Fl¨uckiger, J., D¨allenbach, A., Blunier, T., Stauffer, B., Stocker, T. F., Raynaud, D., and Barnola, J.-M.: Variations in atmospheric N2O concentration during abrupt climatic changes, Science, 285, 227– 230, 1999.
Fyfe, J. C. and Lorenz, D. J.: Characterizing Midlatitude Jet Vari-ability: Lessons from a Simple GCM, J. Climate, 18, 3400–3404, doi:10.1175/JCLI3486.1, 2005.
Held, I. M. and Suarez, M. J.: A Proposal for the Intercomparison of the Dynamical Cores of Atmospheric General Circulation Mod-els, B. Am. Meteorol. Soc., 75, 1825–1830, doi:10.1175/1520-0477(1994)075<1825:APFTIO>2.0.CO;2, 1994.
Hourdin, F., Foujols, M.-A., Codron, F., Guemas, V., Dufresne, J.-L., Bony, S., Denvil, S., Guez, J.-L., Lott, F., Ghattas, J., Bracon-not, P., Marti, O., Meurdesoif, Y., and Bopp, L.: Impact of the LMDZ atmospheric grid configuration on the climate and sensi-tivity of the IPSL-CM5A coupled model, Clim. Dynam., online first, doi:10.1007/s00382-012-1411-3, 2012.
Kidston, J., Dean, S. M., Renwick, J. A., and Vallis, G. K.: A robust increase in the eddy length scale in the simula-tion of future climates, Geophys. Res. Lett., 37, L03806, doi:10.1029/2009GL041615, 2010.
Kidston, J., Vallis, G. K., Dean, S. M., and Renwick, J. A.: Can the Increase in the Eddy Length Scale under Global Warming Cause the Poleward Shift of the Jet Streams?, J. Climate, 24, 3764– 3780, doi:10.1175/2010JCLI3738.1, 2011.
Kuhlbrodt, T., Griesel, A., Montoya, M., Levermann, A., Hofmann, M., and Rahmstorf, S.: On the driving processes of the Atlantic meridional overturning circulation, Rev. Geophys., 45, RG2001, doi:10.1029/2004RG000166, 2007.
Le Qu´er´e, C., R¨odenbeck, C., Buitenhuis, E. T., Conway, T. J., Langenfelds, R., Gomez, A., Labuschagne, C., Ramonet, M., Nakazawa, T., Metzl, N., Gillett, N., and Heimann, M.: Satura-tion of the Southern Ocean CO2 Sink Due to Recent Climate Change, Science, 316, 1735–1738, 2007.
Lenton, A., Codron, F., Bopp, L., Metzl, N., Cadule, P., Tagliabue, A., and Le Sommer, J.: Stratospheric ozone depletion reduces ocean carbon uptake and enhances ocean acidification, Geophys. Res. Lett., 36, L12606, doi:10.1029/2009GL038227, 2009. Lorenz, D. J. and DeWeaver, E. T.: Tropopause height and
zonal wind response to global warming in the IPCC scenario integrations, J. Geophys. Res., 112, D10119, doi:10.1029/2006JD008087, 2007.
Lorenz, D. J. and Hartmann, D. L.: Eddy–Zonal Flow Feedback in the Southern Hemisphere, J. Atmos. Sci., 58, 3312–3327, doi:10.1175/1520-0469(2001)058<3312:EZFFIT>2.0.CO;2, 2001.
Marshall, J. and Speer, K.: Closure of the meridional overturning circulation through Southern Ocean upwelling, Nat. Geosci., 5, 171–180, doi:10.1038/ngeo1391, 2012.
Monnin, E., Indermuhle, A., Dallenbach, A., Fluckiger, J., Stauffer, B., Stocker, T. F., Raynaud, D., and Barnola, J.-M.: Atmospheric CO2concentrations over the last glacial termination, Science, 291, 112–114, 2001.
Otto-Bliesner, B. L., Joussaume, S., Braconnot, P., Harrison, S. P., and Abe-Ouchi, A.: Modeling and Data Syntheses of Past Cli-mates, EOS T. Am. Geophys. Un., 90, p. 93, 2009.
Peltier, W. R.: Global glacial isostasy and the surface of the ice-age earth: The ICE-5G (VM2) Model and GRACE, Annu. Rev. Earth Planet. Sc., 32, 111–149, doi:10.1146/annurev.earth.32.082503.144359, 2004.
Perlwitz, J., Pawson, S., Fogt, R. L., Nielsen, J. E., and Neff, W. D.: Impact of stratospheric ozone hole recovery on Antarctic climate, Geophys. Res. Lett., 35, L08714, doi:10.1029/2008GL033317, 2008.
Putnam, A. E., Denton, G. H., Schaefer, J. M., David, J. A., Barrell, D. J. A., Andersen, B. G., Finkel, R. C., Schwartz, R., Doughty, A. M., Kaplan, M. R., and Schl¨uchter, C.: Glacier advance in southern middle-latitudes during the Antarctic Cold Reversal, Nat. Geosci., 3, 700–704, 2010.
Rivi`ere, G.: A dynamical interpretation of the poleward shift of the jet streams in global warming scenarios, J. Atmos. Sci., 68, 1253–1272, doi:10.1175/2011JAS3641.1, 2011.
Rojas, M., Moreno, P., Kageyama, M., Crucifix, M., Hewitt, C., Abe-Ouchi, A., Ohgaito, R., Brady, E. C., and Hope, P.: The Southern Westerlies during the last glacial maximum in PMIP2 simulations, Clim. Dynam., 32, 525–548, doi:10.1007/s00382-008-0421-7, 2009.
Russell, J. L., Dixon, K. W., Gnanadesikan, A., Stouffer, R. J., and Toggweiler, J. R.: The southern hemisphere westerlies in a warm-ing wolrd: proppwarm-ing open the door to the deep ocean, J. Climate, 19, 6392–6390, 2006a.
Russell, J. L., Stouffer, R. J., and Dixon, K. W.: Intercomparison of the southern ocean circulations in IPCC coupled model control simulations, J. Climate, 19, 4560–4575, 2006b.
Sijp, W. P. and England, M. H.: The effect of a northward shift in the southern hemisphere westerlies on the global ocean, Prog. Oceanogr., 79, 1–19, 2008.
Taylor, K. E., Stouffer, R. J., and Meehl, G. A.: An Overview of CMIP5 and the Experiment Design, B. Am. Meteorol. Soc., 93, 485–498, doi:10.1175/BAMS-D-11-00094.1, 2012.
Toggweiler, J. R., Russell, J. L., and Carson, S. R.: Mid-latitude westerlies, atmospheric CO2, and climate change during the ice ages, Paleoceanography, 21, PA2005, doi:10.1029/2005PA001154, 2006.
Wilcox, L. J., Charlton-Perez, A. J., and Gray, L. J.: Trends in Aus-tral jet position in ensembles of high- and low-top CMIP5 mod-els, J. Geophys. Res., 117, D13115, doi:10.1029/2012JD017597, 2012.
Wunsch, C.: What Is the Thermohaline Circulation?, Science, 298, 1179–1181, 2002.
Yin, J. H.: A consistent poleward shift of the storm-tracks in the simulations of the 21st century climate, Geophys. Res. Lett., 32, L18701, doi:10.1029/2005GL023684, 2005.


![[PDF] Cours UML diagramme d’état enjeux et pratique | Cours informatique](data:image/gif;base64,R0lGODlhAQABAIAAAP///wAAACH5BAEAAAAALAAAAAABAAEAAAICRAEAOw==)