HAL Id: hal-00330236
https://hal.archives-ouvertes.fr/hal-00330236
Submitted on 19 Apr 2007HAL is a multi-disciplinary open access
archive for the deposit and dissemination of sci-entific research documents, whether they are pub-lished or not. The documents may come from teaching and research institutions in France or abroad, or from public or private research centers.
L’archive ouverte pluridisciplinaire HAL, est destinée au dépôt et à la diffusion de documents scientifiques de niveau recherche, publiés ou non, émanant des établissements d’enseignement et de recherche français ou étrangers, des laboratoires publics ou privés.
Analyzing the causes and spatial pattern of the
European 2003 carbon flux anomaly in Europe using
seven models
M. Vetter, G. Churkina, M. Jung, M. Reichstein, S. Zaehle, Alberte Bondeau,
Y. Chen, P. Ciais, F. Feser, A. Freibauer, et al.
To cite this version:
M. Vetter, G. Churkina, M. Jung, M. Reichstein, S. Zaehle, et al.. Analyzing the causes and spatial pattern of the European 2003 carbon flux anomaly in Europe using seven models. Biogeosciences Discussions, European Geosciences Union, 2007, 4 (2), pp.1201-1240. �hal-00330236�
BGD
4, 1201–1240, 2007
European 2003 carbon flux anomaly
using 7 models M. Vetter et al. Title Page Abstract Introduction Conclusions References Tables Figures ◭ ◮ ◭ ◮ Back Close
Full Screen / Esc
Printer-friendly Version Interactive Discussion
EGU
Biogeosciences Discuss., 4, 1201–1240, 2007 www.biogeosciences-discuss.net/4/1201/2007/ © Author(s) 2007. This work is licensed
under a Creative Commons License.
Biogeosciences Discussions
Biogeosciences Discussions is the access reviewed discussion forum of Biogeosciences
Analyzing the causes and spatial pattern
of the European 2003 carbon flux anomaly
in Europe using seven models
M. Vetter1, G. Churkina1, M. Jung1, M. Reichstein1, S. Zaehle2,3, A. Bondeau2, Y. Chen1, P. Ciais3, F. Feser8, A. Freibauer1, R. Geyer5, C. Jones6, D. Papale4, J. Tenhunen5, E. Tomelleri1,7, K. Trusilova1, N. Viovy3, and M. Heimann1 1
Max-Planck Institute for Biogeochemistry, Hans-Kn ¨oll Strasse 10, 07745 Jena, Germany
2
Potsdam Inst. for Climate Impact Res. (PIK), Telegrafenberg A 31, 14473 Potsdam, Germany
3
LSCE, Orme point courrier 129, CEA-Orme des Merisiers, 91191 Gif-Sur-Yvette, CEDEX, France
4
DISAFRI, University of Tuscia, 01100 Viterbo, Italy
5
Department of Plant Ecology, University of Bayreuth, 95440 Bayreuth, Germany
6
Hadley Centre, Met Office, Exeter, UK
7
Centro di Ecologia Alpina (CEALP), Trento, Italy
8
GKSS-Research Centre, Institute for Coastal Research, Development of operational systems, Max-Planck-Straße 1, 21502 Geesthacht, Germany
Received: 15 March 2007 – Accepted: 27 March 2007 – Published: 19 April 2007 Correspondence to: M. Vetter ([email protected])
BGD
4, 1201–1240, 2007
European 2003 carbon flux anomaly
using 7 models M. Vetter et al. Title Page Abstract Introduction Conclusions References Tables Figures ◭ ◮ ◭ ◮ Back Close
Full Screen / Esc
Printer-friendly Version Interactive Discussion
EGU
Abstract
Globally, the year 2003 is associated with one of the largest atmospheric CO2rises on
record. In the same year, Europe experienced an anomalously strong flux of CO2from
the land to the atmosphere associated with an exceptionally dry and hot summer in Western and Central Europe. In this study we analyze the magnitude of this carbon flux
5
anomaly and key driving ecosystem processes using simulations of seven terrestrial ecosystem models of different complexity and types (process-oriented and diagnostic). We address the following questions: (1) how large were deviations in the net European carbon flux in 2003 relative to a short-term baseline (1998–2002) and to longer-term variations in annual fluxes (1980 to 2005), (2) which regions exhibited the largest shift
10
in carbon fluxes during the growing season 2003, and (3) which processes controlled the carbon balance anomaly .
In Western and Central Europe, the anomaly in net ecosystem productivity (NEP) over growing season 2003 was outside the 1σ bound of the carbon flux anomalies for 1980–2005. The estimated growing season anomaly ranged between –29 and
15
–196 Tg C for Western Europe and between 13 and –94 Tg C for Central Europe de-pending on the model used. All models responded to a dipole pattern of the climate anomaly in 2003. In Western and Central Europe NEP was reduced due to heat and drought. Over Western Russia NEP was decreased in response to lower than nor-mal temperatures and high precipitation. While models agree on changes in simulated
20
NEP and gross primary productivity anomalies in 2003 over Western and Central Eu-rope, models diverge in the estimates of anomalies in ecosystem respiration. Except for two process models which simulate respiration increase, most models simulated a decrease in ecosystem respiration in 2003. The diagnostic models showed a weaker decrease in ecosystem respiration than the process-oriented models.
25
Based on the multi-model simulations we estimated the total carbon flux anomaly over the 2003 growing season in Europe to range between –0.02 and –0.27 Pg C rela-tive to the net flux in 1998–2002.
BGD
4, 1201–1240, 2007
European 2003 carbon flux anomaly
using 7 models M. Vetter et al. Title Page Abstract Introduction Conclusions References Tables Figures ◭ ◮ ◭ ◮ Back Close
Full Screen / Esc
Printer-friendly Version Interactive Discussion
EGU
1 Introduction
Globally, the year 2003 is associated with one of the largest atmospheric CO2 rises
on record (Jones and Cox, 2005). This was particularly significant as there was no accompanying large El Nino event that is normally the case in years with high CO2 increase. Drought periods in mid-latitudes of the northern Hemisphere were 5
suggested to cause additional carbon release to the atmosphere large enough to modify dominant ENSO responses in 1998–2002 (Zeng et al., 2005). During these years, atmospheric model inversions have indicated that the Northern Hemisphere mid-latitudes went from being a sink (0.7 Pg C yr−1) to being close to neutral. As terrestrial
ecosystems seem to respond to droughts with an increased carbon flux to the
atmo-10
sphere, frequent droughts may lead to a faster increase in atmospheric carbon diox-ide concentration and accelerate global warming. Thus understanding the response of ecosystems to large-scale drought events is an important issue, particularly given that such drought events are projected to occur more frequently in the future (IPCC 2007; http://www.ipcc.ch/SPM2feb07.pdf). Western and Central Europe experienced
15
extremely hot and dry conditions during the summer of 2003, while Scandinavia, North-Eastern Europe and Russia had lower than normal temperatures and high precipita-tion (Zveryaev, 2004; Ding and Wang, 2005; Lucero and Rodriguez, 2002; Trigo et al., 2005; Chen at al., 2007). The Central European “summer drought” caused a de-crease in carbon sequestration over large areas (Reichstein et al., 2006; Schindler et
20
al., 2006; Ciais et al., 2005), whereas areas normally experiencing temperature limita-tion as the Alps, experienced an increase in carbon sequestralimita-tion (Jolly et al., 2005). Ciais et al. (2005) showed in a model study that the carbon flux anomaly was rather caused by a drop in the gross primary production than increased ecosystem respira-tion resulting in an anomalous source of 0.5 Pg of carbon to the atmosphere through
25
July–September 2003 relative to the average carbon flux from 1998–2002. Reichstein et al. (2006) conducted a model intercomparison on the 2003 carbon flux anomaly. This model intercomparison included four models, which drivers were not harmonized.
BGD
4, 1201–1240, 2007
European 2003 carbon flux anomaly
using 7 models M. Vetter et al. Title Page Abstract Introduction Conclusions References Tables Figures ◭ ◮ ◭ ◮ Back Close
Full Screen / Esc
Printer-friendly Version Interactive Discussion
EGU
Differences among the models could not be completely separated from the effect of dif-ferent inputs. As a result they could not conduct an in depth analysis of the responses of the component carbon fluxes, only stating that both gross primary productivity (GPP) and ecosystem respiration (Reco) were reduced in the year 2003.
In this study, we use five process-based terrestrial ecosystem models (TEMs), one
5
remote-sensing driven model and one artificial neural network to analyze European ecosystem responses to climate variations with special emphasis on 2003. All models are driven with the same input data. This allows us to assess the regional significance of the 2003 anomaly in the European carbon balance together with the uncertainty in its estimates caused by different parameterizations and assumptions used in the different
10
models.
We will address the following questions: (1) how large were the shifts in the re-gional carbon fluxes during 2003 growing season (May–September) relative to long-term growing season variation?, (2) do the models agree on which regions exhibited the largest shift in carbon fluxes during the growing season 2003? and finally (3) which
15
processes, photosynthesis or respiration, controlled the carbon balance anomaly in the models?
2 Methods
2.1 Model descriptions
In this study, we use five process-based terrestrial ecosystem models of different
20
complexity (Biome-BGC, LPJ, ORCHIDEE, JULES and PIXGRO) and two data ori-ented models (MOD17+ and NETWORKANN) to simulate carbon fluxes. Except
NETWORKANN all models simulated gross primary productivity and respiration
inde-pendently. The models also differed by the number of simulated biomes as well as implementation of crop- and crop management. Key features of the models in terms
25
summa-BGD
4, 1201–1240, 2007
European 2003 carbon flux anomaly
using 7 models M. Vetter et al. Title Page Abstract Introduction Conclusions References Tables Figures ◭ ◮ ◭ ◮ Back Close
Full Screen / Esc
Printer-friendly Version Interactive Discussion
EGU
rized in Table 1.
Biome-BGC: Biome-BGC is a terrestrial ecosystem model describing the carbon,
ni-trogen and water cycles (Running and Gower, 1991; Thornton et al., 2002) see details in Table 1. It has been corroborated for a number of hydrological, carbon cycle com-ponents and forest management (Cienciala et al., 1998; Churkina and Running, 2000;
5
Churkina et al., 2003; Thornton et al., 2002; Vetter et al., 2005). Biome-BGC is param-eterized for seven biomes including evergreen needleleaf (enf), evergreen broadleaf (ebf) (Trusilova et al., 20071), deciduous needleleaf (dnf), deciduous broadleaf (dbf), shrubs (sh), and grass as well as fertilized grasses (C3 and C4 type photosynthesis). The model does not include a special crop phenology, and simulates crops as fertilized
10
grasses with no further management such as harvest. Forest management was not included due to lack of detailed regional forest inventories.
Lund-Potsdam-Jena dynamic global vegetation model for managed Land (LPJmL): LPJmL is a terrestrial ecosystem model describing the coupled carbon and
water cycles of natural, semi-natural and anthropogenic ecosystems (Sitch et al., 2003;
15
Bondeau et al., 2007; Zaehle et al., 2007), see details in Table 1. It includes representa-tions of boreal and temperate evergreen needleleaf (enf), decidous needleleaved (dnf), deciduous broadleaf deciduous (dbf), and evergreen broadleaved tree types (ebf), as well as two grass and 11 croptypes. Vegetation dynamics and management are cal-culated separately for each landcover type. Crop land dynamics were simulated as
20
described by Bondeau et al. (2007), managed forest according to Zaehle et al. (2007). To be consistent with the other models in this comparison, cropland irrigation was not activated, and no land-use change was considered.
ORCHIDEE: The ORCHIDEE biosphere model describes the carbon, energy and
water fluxes on a half-hourly basis (Krinner et al., 2005; Viovy, 1996) see details in
25
Table 1. ORCHIDEE differentiates 12 different plant functional types, similar to LPJ, of
1
Trusilova, K., Churkina, G., Vetter, M., Reichstein, M., Schumacher, J., Knohl, A., Ran-nik, U., Gruenewald, T., Moors, E., and Granier, A.: Parameter estimation for the terrestrial ecosystem model BIOME-BGC using non linear inversions, Ecol. Modell., in review, 2007.
BGD
4, 1201–1240, 2007
European 2003 carbon flux anomaly
using 7 models M. Vetter et al. Title Page Abstract Introduction Conclusions References Tables Figures ◭ ◮ ◭ ◮ Back Close
Full Screen / Esc
Printer-friendly Version Interactive Discussion
EGU
which two are representing C3 and C4-type crops as fertile, but not harvested grass-land. Long-term vegetation dynamics, adapted from the LPJ model (Sitch et al., 2003) are not activated for the simulations presented here. ORCHIDEE runs with hourly time-steps climate forcing.
Joint UK Land Environment Simulator (JULES): JULES is a land-surface model
5
based on the MOSES2 land surface scheme (Essery et al., 2003) used in the Hadley Centre climate model HadGEM (Johns et al., 2006), also incorporating the TRIFFID DGVM (Cox, 2001; Cox et al., 2000), see details in Table 1. The model simulates carbon, water and energy fluxes on 9 sub-grid tiles, including 5 plant functional types: broadleaf and needleleaf trees, C3 and C4 grasses and shrubs. In this study JULES is
10
driven by hourly time-steps (see Table 2 and Table 3). JULES does not simulate crops and crop management and represent these as natural C3 grasses.
PIXGRO: PIXGRO is a canopy flux and, in the case of short-stature vegetation
(grassland, crops, tundra, or wetlands), growth model for simulation of carbon and water fluxes (Adiku et al., 2006; Reichstein, 2001; Reichstein et al., 2004), see details
15
in Table 1. The model has been applied on landscape to continental scale and regions (Tenhunen et al., 2007). In this continental scale study, the single-layered canopy model described in Owen et al. (2007) was applied, where canopy capacity for CO2
uptake for conifer and deciduous forest, for Mediterranean shrublands, for grasslands and tundra and for crops is based on data from flux measurement sites of
CarboEu-20
rope. PIXGRO uses remote sensing data from MODIS to establish the max LAI for forests and shrublands of each year. Crops are represented as summer and winter grains, root crops and maize. Phenology across the continent is based on tempera-ture climate and principles related to winter dormancy and release from dormancy as elaborated by Zhang et al. (2004). Crops are harvested rather than senescing.
25
MOD17+: MOD17+ is a semi-empirical relatively data-oriented model (Reichstein et
al., 2004, 2003b, 2005a, 2005b); a successor of a remote sensing driven radiation-use efficiency model (Nemani et al., 2003), that has also been implemented for calculating the operational global MODIS-NPP product at 1km resolution (Running et al., 2004),
BGD
4, 1201–1240, 2007
European 2003 carbon flux anomaly
using 7 models M. Vetter et al. Title Page Abstract Introduction Conclusions References Tables Figures ◭ ◮ ◭ ◮ Back Close
Full Screen / Esc
Printer-friendly Version Interactive Discussion
EGU
see Table 1 for details on how the carbon fluxes are simulated.
NETWORKANN: NETWORKANN is a completely data-oriented modeling approach based on Artificial Neural Networks (ANNs) (Papale and Valentini, 2003) for details see Table 1. ANN was trained with flux measurements covering 7 different landcovers: deciduous broadeleaf forest (11 sites), evergreen needleleaf forests (15 sites),
ever-5
green broadleaf forests and shrublands (6 sites), grasslands and wetland (18 sites), croplands (12 sites). The datasets used in the ANNs training were divided in three subset, training, test and validation sets, with the last one that is not used at all in the training phase but only to assess the ANN generalization ability.
2.2 Model inputs
10
The climate data were obtained with the regional climate model REMO (RE-gionalMOdel, Jacob and Podzun, 1997) forced with global 6-hourly NCEP (National Centers for Environmental Prediction) reanalyses (Kalnay et al., 1996) from 1948 until the current time. The prognostic variables are surface air pressure, temperature, hor-izontal wind components, specific humidity and cloud water. The physics scheme
ap-15
plied is a version of the global model ECHAM4 physics of the Max-Planck-Institute for meteorology adapted for the regional model (Koch and Feser, 2006). The model simu-lation was computed with additional “nudging of large scales” (von Storch et al., 2000). Thereby the simulated state is kept close to the driving state at larger scales, while allowing the model to freely generate regional-scale weather phenomena consistent
20
with the large-scale state. A more detailed description of the multi-decadal simulation is given in Feser et al. (2001). The atmospheric hourly values were then interpolated to a regular latitude-longitude grid with a grid spacing of 0.25◦
×0.25◦ and aggregated to daily and monthly values as needed by the different models (see Table 2, Table 3). To compare the model-outputs with other input climate drivers, the models used the
25
REMO-derived climate from 1958–2005. The major reason for choosing REMO de-rived climate data input in this study was the temporal consistency of the model output and its quality (Chen et al., 2007).
BGD
4, 1201–1240, 2007
European 2003 carbon flux anomaly
using 7 models M. Vetter et al. Title Page Abstract Introduction Conclusions References Tables Figures ◭ ◮ ◭ ◮ Back Close
Full Screen / Esc
Printer-friendly Version Interactive Discussion
EGU
To include the effect of environmental change on the estimates of the carbon-fluxes over Europe we used the annual values of the CO2 concentrations over the northern Hemisphere. These values were based on ice core data from Etheridge (1996) and atmospheric data from Mauna Loa (Keeling and Whorf, 2005). They cover the time until the end of 2004. The CO2concentration for the year 2005 was added by using the
5
annual global trend reported by NOAA/CMDL of 2.08 ppm as an average from January 2004–December 2005, (Table 3).
All models used the same maps of elevation above the sea level, soil texture, soil-depth and land use classification (Table 3). Biome-BGC is also simulating the nitrogen cycle and requires data on reactive nitrogen deposition. We used the atmospheric
ni-10
trogen deposition maps as reported by Galloway et al. (2004). For the spin-up runs we used the maximum pre-industrial constant of 0.0002 kg N/m2/yr (Holland et al., 1999). The nitrogen fertilizer inputs over agricultural areas were calculated accord-ing to Freibauer (2003) and the FAO Statistics June 2006 (http://faostat.fao.org/site/
422/default.aspx). We added both mineral nitrogen fertilizer as well as the total of
ma-15
nure and slurry from animal husbandry generating Europe-wide fertilization maps for 1961, 1989 and 2002 for the agricultural areas. The fertilization maps were interpolated between the years to describe the annual changes in fertilizer usage over Europe. 2.3 Model simulations
Using the same input drivers all models performed simulations over Europe in the
20
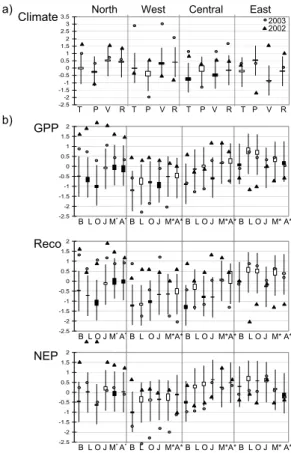
domain bounded by 15◦W–60◦E and 30◦N–75◦N. This covers area from Iceland to
Ural Mountains and from the Mediterranean Sea to the Barents Sea. Europe has been further divided into four regions (North, West, Central and East; Fig. 1) in order to regionally examine the changes in terrestrial CO2exchange.
The process oriented models which also calculate the carbon pools need to
spin-25
up to initialize slow carbon and nitrogen pools. We forced the models in a pre-industrial steady-state using atmospheric CO2concentrations (and nitrogen deposition for Biome-BGC) from ∼1850 (285.2 ppm, 0.0002 kgN/m2/yr) and recycling one decade
BGD
4, 1201–1240, 2007
European 2003 carbon flux anomaly
using 7 models M. Vetter et al. Title Page Abstract Introduction Conclusions References Tables Figures ◭ ◮ ◭ ◮ Back Close
Full Screen / Esc
Printer-friendly Version Interactive Discussion
EGU
of meteorological data that does not exhibit significant trends of temperature and pre-cipitation change over Europe (1958–1967). After establishing the slow pools, we run the models from 1850 to 1957 with transient atmospheric CO2using the same decade
of meteorological data. The last transient model runs from 1958–2005 use observed CO2concentrations and corresponding meteorological data from REMO. Although
ris-5
ing CO2 levels are responsible for long term net carbon uptake, interannual
variabil-ity in these simulations is driven solely by climate variations (Harrison and Jones, 20072).These final runs are the basis of our analysis.
The diagnostic models were forced with climate divers from the period 2000–2004 since they rely on remotely sensed input data from MODIS (launch in 2000). PIXGRO
10
was forced with CO2and climate drivers only for the period 2002–2003 because this model is computationally very demanding. In this study all models used prescribed land surface types which were held constant during the simulations.
2.4 Analysis of spatial and temporal pattern of the climate and carbon flux anomalies in 2003
15
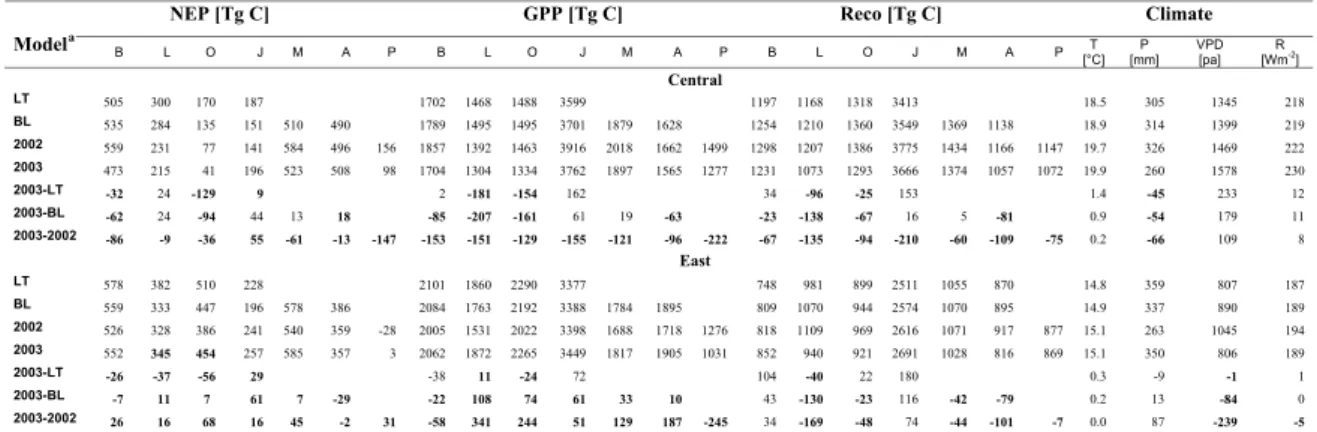
Our analysis is based on carbon fluxes simulations from 1980–2005. We define the growing season from beginning of May to the end of September. The carbon fluxes are summed over this period. The carbon flux anomaly Ai ,j in 2003 for each grid-cell is calculated as
Aj,i = F2003
j,i− ¯F1998−2002j,i (1)
20
where F2003denotes total carbon flux over the growing season 2003,
¯
F1998−2002 denotes the total carbon flux averaged over five growing seasons (1998–
2002), j and i are the longitude and latitude respectively. In addition we estimate the change in carbon fluxes between the years 2003 and 2002, for better comparison with
2
Harrison, R and Jones, C. D.: Competing roles of rising CO2 and climate change in the contemporary European carbon balance, Biogeosci Discuss., submitted, 2007.
BGD
4, 1201–1240, 2007
European 2003 carbon flux anomaly
using 7 models M. Vetter et al. Title Page Abstract Introduction Conclusions References Tables Figures ◭ ◮ ◭ ◮ Back Close
Full Screen / Esc
Printer-friendly Version Interactive Discussion
EGU
other studies of the carbon-flux anomaly in 2003 (Reichstein et al., 2006; Ciais et al., 2005), and for explaining differences in carbon flux responses between PIXGRO and the other models.
For each of the four European regions (Fig. 1) we also estimated the area weighted carbon flux anomaly for the growing seasons 1980–2005 using the average growing
5
season from 1998–2002 as baseline. We have chosen the period 1998-2002 as a reference for our study because this period has been used in previous studies (Ciais et al., 2005) and also because it is consistent with the time period used by atmospheric inversion models. We only use the model results from the period 1980–2005 as the quality of the climate data for this period is good. In PIXGRO the carbon flux anomaly
10
is based only on the years 2002 and 2003.
To examine the carbon flux anomaly in 2003 relative to the anomalies during growing seasons in 1980–2005, we estimated the anomalies of each growing season (1980– 2005) relative to the reference period 1998–2002. Based on these anomalies we de-rived the mean anomaly for the growing seasons 1980–2005, as well as the standard
15
deviations, and the median. As the anomalies in carbon fluxes simulated by the models varied in magnitude, we normalized the anomalies by dividing them with the standard deviations. In this way we forced the standard deviation of the carbon flux anomaly of each model to be 1, and the analysis of the carbon flux anomaly and its variation could be performed.
20
The climate anomalies were derived analog to the above described carbon flux anomalies, representing growing season averages for temperature, radiation, VPD and water balance, whereas the growing season sums were estimated for the precipitation.
BGD
4, 1201–1240, 2007
European 2003 carbon flux anomaly
using 7 models M. Vetter et al. Title Page Abstract Introduction Conclusions References Tables Figures ◭ ◮ ◭ ◮ Back Close
Full Screen / Esc
Printer-friendly Version Interactive Discussion
EGU
3 Results and discussion
3.1 Regional climate and carbon flux anomalies of the growing season 2003
Although all models agreed in the sign of the 2003 NEP anomaly over Western Europe, they disagree on the dominating ecosystem processes causing the anomalous flux. The NEP anomaly in 2003 was driven by an increase in respiration in Biome-BGC and
5
JULES (the increase exceeded the 1σ range). LPJ, ORCHIDEE, MOD17+ and ANN showed that the NEP anomaly in 2003 was driven by the decline in GPP (decrease exceeded the 1σ range). Our analysis suggest that the differences among the models result mainly from the different descriptions of the ecosystem processes and soil water calculations, as well as the inclusion of crops and crop management.
10
Northern Europe
The 2003 growing season in this region was rather warm and wet relative to the base-line and long-term (1980–2005) means. The growing season 2002 was even warmer (Fig. 2a, Table 4). All models agreed in an increase in GPP in both 2003 and 2002, the increase in 2002 being larger relative to both baseline as well as long-term mean
15
(Fig. 2b, upper panel, Table 4). The GPP anomaly 2003 was outside 1σ for Biome-BGC, LPJ, ORCHIDEE and JULES whereas the data-oriented models showed an in-crease too, but not as significant. This is mainly due to the inin-creased temperature in this area (∼0.7◦C) relative to baseline (Table 4). This is in agreement with Churkina
and Running (1998) who showed that the vegetation in the northern latitudes is
tem-20
perature limited. Northern Europe is dominated by natural vegetation, mainly forests (coniferous and deciduous forests), which may also explain why the models showed good agreement in this region. Biome-BGC, LPJ, ORCHIDEE and JULES estimated a total GPP in the growing season 2003 between 1140 and 1507 Tg where as PIXGRO, MOD17+ and ANN estimated a slightly smaller productivity ranging between 896 and
25
BGD
4, 1201–1240, 2007
European 2003 carbon flux anomaly
using 7 models M. Vetter et al. Title Page Abstract Introduction Conclusions References Tables Figures ◭ ◮ ◭ ◮ Back Close
Full Screen / Esc
Printer-friendly Version Interactive Discussion
EGU
The Reco anomaly in 2003 followed mainly that of the GPP (Fig. 2b, middle panel, Table 4). All models showed an increase in respiration in 2003 relative to both base-line ranging between 76 Tg (JULES) and 7 Tg (MOD17+) and long-term mean ranging between 87 Tg (ORCHIDEE and JULES) and 6 Tg (MOD17+). The increase in Reco in 2002 was even more pronounced, except for LPJ and ORCHIDEE. This is mainly
5
explained by the increased temperature in both 2003 and 2002 (Fig. 2a, Table 4). Biome-BGC, LPJ, ORCHIDEE and JULES showed that the Reco anomaly 2003 was outside of 1σ bound whereas it was still inside the 1σ bound for MOD17+ and ANN. Biome-BGC and PIXGRO estimated the smallest total Reco in the growing season 2003 (801 and 798 Tg respectively) and JULES estimated the largest Reco (1343 Tg)
10
among the process oriented models. The estimated Reco over the growing season 2003 as estimated by the diagnostic models (MOD17+, ANN) was smaller (607 and 683 Tg respectively), but they agree with the majority of models with respect to the sign of the Reco anomaly. The reason for this behavior may be due to the fact that GPP and Reco are calculated independently in the data-oriented models, so that the
15
link between GPP and Reco is not so strong.
The resulting standardized NEP anomaly 2003 in Northern Europe was within the 1σ range for any of the models, being close to baseline, whereas the NEP anomaly 2002 clearly indicates enhanced land carbon uptake. All models except ORCHIDEE agreed in an increased NEP in 2003 relative to baseline. In this region, the increase in
20
temperature and radiation seem to force the increase in NEP due to enhanced photo-synthesis (Churkina and Running, 1998) (Fig. 2b and Table 4). All models agreed that the NEP anomaly 2003 relative to 2002 showed a decrease (Table 4). The range of the NEP over the growing season 2003 did not differ much among the models (Biome-BGC, LPJ, ORCHIDEE, MOD17+ and ANN ranged between 340–284 Tg). JULES and
25
BGD
4, 1201–1240, 2007
European 2003 carbon flux anomaly
using 7 models M. Vetter et al. Title Page Abstract Introduction Conclusions References Tables Figures ◭ ◮ ◭ ◮ Back Close
Full Screen / Esc
Printer-friendly Version Interactive Discussion
EGU
Western Europe
In 2003 this region experienced a strong heat and drought event with a temperature increase of more than two degrees Celsius with corresponding increase in radiation and VPD and decrease in precipitation (Fig. 2a, Table 4). The models differ in their responses to the climate anomaly in 2003 in their estimation of the GPP anomaly in
5
2003. All models showed a reduction in GPP in 2003. On the other hand all models agreed in an increase in GPP in 2002 (Fig. 2b, Table 4). The year 2002 was warm, but wetter in this region which is normally water limited. Increased precipitation leads to increased productivity. LPJ, ORCHIDEE, MOD17+ and ANN estimated the largest GPP anomaly 2003 being outside the lower 1σ bound ranging from –326 to –107 Tg.
10
Biome-BGC and JULES also showed a reduction of in GPP 2003 relative to baseline being –49 and –11 Tg respectively (Table 4), but the reduction was not significant (in-side the 1σ bound, Fig. 2b). The estimated reduction in GPP 2003 is in agreement with other studies (Reichstein et al., 2006; Schindler et al., 2006; Ciais et al., 2005). Biome-BGC, MOD17+, ANN and PIXGRO estimated the total GPP over the growing
15
season 2003 between 1031 and 1290 Tg. On the other hand LPJ and ORCHIDEE es-timated less GPP in the growing season 2003 of 915 and 822 Tg respectively. JULES estimated the highest GPP with 2715 Tg. Relative to the growing season 2002, the GPP anomaly over the growing season 2003 was even stronger (Table 4).
Biome-BGC and JULES estimated an increase in Reco in 2003 relative to baseline.
20
Reco anomaly simulated by these two models was outside of the 1σ bound (43 and 116 Tg, respectively, Table 4), whereas the LPJ and ORCHIDEE estimated a decrease in Reco relative to baseline (–130 and –23 Tg, respectively, see Fig. 2b, middle panel, Table 4) still being inside the 1σ bound. PIXGRO estimated almost no difference in Reco between 2003 and 2002 (7 Tg, Table 4). The sensitivity of the Reco with respect
25
to 2003 climate conditions seems less pronounced in Biome-BGC and JULES com-pared with the other process models. Both MOD17+ and ANN estimated a reduction of Reco through the growing season 2003 relative to both baseline and 2002 (–42
BGD
4, 1201–1240, 2007
European 2003 carbon flux anomaly
using 7 models M. Vetter et al. Title Page Abstract Introduction Conclusions References Tables Figures ◭ ◮ ◭ ◮ Back Close
Full Screen / Esc
Printer-friendly Version Interactive Discussion
EGU
and –44 Tg and –79 and –101 Tg, respectively, Table 4)). The mayor difference to the process-oriented models are the direct description of Reco based on the abiotic input in MOD17+, whereas Reco as estimated by ANN, is just the difference between the estimated NEP (-NEE) and the estimated GPP, without any explicit assumptions about the soil conditions. The 2002 Reco anomaly showed an increase in Reco in all models.
5
The resulting NEP anomaly in 2003 showed a decrease mostly outside the one σ range, with the exception of Biome-BGC, which showed a less significant decrease in comparison with the other models. All models agreed on negative NEP 2003 anomaly relative to long-term mean, baseline and 2002 shown in Table 4. Given the very differ-ent models, this common response among the models reveals a high confidence in the
10
net carbon flux responses to the climate anomaly in this region. This NEP anomaly is caused by the strong increase in temperature, VPD and radiation, and reduction in pre-cipitation (Fig. 2b, Table 4), far outside the 1 σ range for all parameters. The growing season 2003 experienced a severe heat and drought anomaly whereas the growing season 2002 did not show large deviations from baseline with a corresponding NEP
15
anomaly 2002 being closer to baseline estimated by all models. The total NEP over the growing season 2003 differed strongly between the models. Biome-BGC, MOD17+, ANN and PIXGRO estimated the total NEP over the growing season 2003 to 229 Tg, 262 Tg, 357 Tg and 162 Tg respectively (Table 4). LPJ, ORCHIDEE and JULES es-timated NEP values of the growing season 2003 close to neutral, the two first even
20
estimated a negative NEP in 2003, –25 Tg and –99 Tg respectively (Table 4). Central Europe
In Central Europe the GPP anomaly in 2003 was less pronounced than in Western Europe (Fig. 2a, upper panel, Table 5). This is also in agreement with the less pro-nounced climate anomaly in this region (Fig. 2a). Biome-BGC, LPJ, ORCHIDEE and
25
ANN agreed in a reduction in GPP relative to baseline ranging between –63 and – 207 Tg, the three latter also relative to the long-term mean (Table 5). The decrease was even larger relative to the growing season 2002 which ranged between –96 and
BGD
4, 1201–1240, 2007
European 2003 carbon flux anomaly
using 7 models M. Vetter et al. Title Page Abstract Introduction Conclusions References Tables Figures ◭ ◮ ◭ ◮ Back Close
Full Screen / Esc
Printer-friendly Version Interactive Discussion
EGU
–153 Tg (Table 5). JULES and MOD17+ showed an increase of 61 and 19 Tg respec-tively for the GPP anomaly in 2003, but agreed in a reduction of the GPP in 2003 versus 2002 (–155 and –121 Tg respectively). PIXGRO estimated the GPP anomaly of 2003 in Central Europe to be –222 Tg.
Biome-BGC and JULES estimated an increase in Reco in 2003 relative to long-term
5
mean (34 and 153 Tg, respectively, Table 5), but being close to baseline (Fig. 2b, middle panel, Table 5). ANN showed a decrease in the Reco anomaly 2003 which was outside the 1σ range (Fig. 2b, middle panel) resulting in a total reduction of –81 Tg (Table 5). All other models estimated the 2003 carbon flux anomaly to be inside the 1σ bound. All models agreed in an increase in the Reco anomaly 2002.
10
The NEP anomaly in 2003 showed mainly the same pattern as for Western Europe for the models Biome-BGC, LPJ and ORCHIDEE, but the decrease in NEP was not as significant (Fig. 2b, lower panel). Also the climate anomaly over Central Europe showed the same tendency, all parameters showing mainly the same pattern as for Western Europe, only less significant (Fig. 2a, Table 5). JULES, MOD17+ and ANN
15
showed a slightly increased NEP but not outside of the 1σ range (Fig. 2b, lower panel). The NEP anomaly 2002 was slightly less prominent compared with the anomaly 2003 for the models LPJ, ORCHIDEE and ANN, whereas the estimated NEP anomaly 2002 showed a stronger increase for Biome-BGC, MOD17+ and ANN. JULES showed that the NEP anomaly 2002 was more decreased compared with 2003. The total NEP of
20
the growing season 2003 ranged between 523 and 41 Tg depending on model. Biome-BGC, MOD17+ and ANN estimating the largest NEP values (523–473 Tg) and LPJ, JULES and PIXGRO estimating the total NEP of the growing season 2003 between 215–196 Tg. ORCHIDEE estimated a close to neutral NEP for Central Europe in 2003 (41 Tg).
25
Eastern Europe
All models agreed that the GPP carbon flux anomaly in 2003 relative to baseline was small (Fig. 2b, upper panel). Biome-BGC was the only model which estimated a small
BGD
4, 1201–1240, 2007
European 2003 carbon flux anomaly
using 7 models M. Vetter et al. Title Page Abstract Introduction Conclusions References Tables Figures ◭ ◮ ◭ ◮ Back Close
Full Screen / Esc
Printer-friendly Version Interactive Discussion
EGU
decrease in GPP in 2003 (–22 Tg, Table 5). LPJ, ORCHIDEE, JULES, MOD17+ and ANN showed an increase in GPP anomaly relative to baseline of 108, 74, 61, 33 and 10 Tg respectively (Fig. 2b, upper panel, Table 5). The estimated GPP through the growing season 2003 ranged between 1378 and 3449 Tg (Table 5). Again JULES estimated the largest GPP 2003, and PIXGRO estimated the least.
5
The Reco anomaly in 2003 was close to the long-term mean of the anomalies 1980– 2005 (Fig. 2b, middle panel). Except Biome-BGC and JULES all models estimated an increase in respiration in 2003. The Reco anomaly in 2002 decreased strongly in all models (being outside of the 1σ range), except for Biome-BGC and JULES which estimated the 2002 anomaly to be close to baseline.
10
The NEP anomaly in 2003 was inside the 1 σ range for all models and did not differ much from the carbon flux anomaly in 2002 (Fig. 2b, lower panel, Table 5). All models agreed in a positive NEP over the growing season 2003 and was estimated between 257 and 552 Tg by the process oriented models, and ranged between 357 and 585 Tg by the data-oriented models. PIXGRO differed strongly estimating a NEP over the
15
growing season 2003 close to 0. All models agreed in the sign of the NEP anomaly in Western Europe, which was also the region with the strongest heat and drought signal as estimated by REMO.
Why do the models differ in their carbon flux responses to the climate anomalies?
The reasons for the different GPP and Reco responses to the climate anomalies among
20
different models can be summarized as follows:
(i) The first reason is various treatment of the crop-/cropland phenology among the models. Biome-BGC, ORCHIDEE and JULES represent the crops with fertil-ized grasses, super grasses and natural grasses respectively, with no harvest. Thus, GPP is accumulated over the whole period and the grass/crop is left to senescence.
25
This causes a larger standing biomass, which results in larger autotrophic respiration (mainly maintenance respiration) and a higher heterotrophic respiration due to larger litter and soil organic matter pools compared with models including harvest. In contrast
BGD
4, 1201–1240, 2007
European 2003 carbon flux anomaly
using 7 models M. Vetter et al. Title Page Abstract Introduction Conclusions References Tables Figures ◭ ◮ ◭ ◮ Back Close
Full Screen / Esc
Printer-friendly Version Interactive Discussion
EGU
to Biome-BGC, ORCHIDEE and JULES, LPJ and PIXGRO account for the manage-ment of the crops. In LPJ, harvest is determined through a sum over growing degree days (Bondeau et al., 2007) which determines maturity, thereafter the crop is har-vested. In 2003 the warm temperatures accelerated the maturity-processes, and crops were harvested earlier compared with not so warm periods. Hence the time for
as-5
similating carbon was also shorter. In addition less biomass is left to senescence and cause less heterotrophic respiration compared with the other models. PIXGRO use a simple climate zone dependence to establish the sawing and harvesting of the crops. The data-oriented models, both MOD17+ and ANN has a direct connection between the abiotic factors and GPP and has no direct coupling with the soil-processes, further
10
the harvesting is implicit through the input data (satellite fAPAR, and measured NEE, respectively).
(ii) The second reason is related to representation of carbon flux responses to droughts in different process-oriented models. This response is a function of the more or less detailed soil structure, biogeochemistry and soil hydrology. Only Biome-BGC
15
utilizes a single bucket soil module, which allows all water not being run-off or evapo-rated to be available for the plants. The other process models utilize at least a two layer soil model, which allows the upper layer to dry faster than the lower layers. These mod-els have also a differentiated vertical root distribution, where grasses have most of the roots in the upper layer (short rooting depth) and shrubs and trees have deeper rooting
20
depths. In this way the estimated drought effect is stronger in these models than com-pared with Biome-BGC. In LPJ 80% of the below ground biomass for the grass and crop types, is situated in the upper layer which also experience the largest evapora-tion and drought stress. ORCHIDEE uses the SVAT-SECHIBA model (Ducoudre er al., 1993; Rosnay and Polcher, 1998), which has a high temporal resolution of the water
25
and energy fluxes (1/2 hourly). Both ORCHIDEE and JULES have a high temporal resolution, daily variation of the input data, hence a short rain shower may be enough to reduce the water stress enough to achieve transpiration and decomposition, daily resolution differed between these two models. This gives ORCHIDEE and JULES a
BGD
4, 1201–1240, 2007
European 2003 carbon flux anomaly
using 7 models M. Vetter et al. Title Page Abstract Introduction Conclusions References Tables Figures ◭ ◮ ◭ ◮ Back Close
Full Screen / Esc
Printer-friendly Version Interactive Discussion
EGU
high temporal resolution of the coupled carbon and water fluxes and hence a stronger sensitivity of Reco to sub daily variations than compared with Biome-BGC and LPJ. JULES utilizes a four layer soil module, and its hydrology was found to perform well in the recent GSWP-2 intercomparison project (Guo and Dirmeyer, 2006). In JULES, the decomposition of soil organic carbon is only sensitive to soil humidity and temperature
5
in the upper 10 cm. Depending on the root distribution, the decomposition and water availability is more or less drought sensitive. JULES seems to be dominated by the temperature signal in the decomposition. PIXGRO has also a high temporal resolution, but the productivity is decoupled from the soil processes (Table 1). PIXGRO estimated almost no change on Reco between 2003 and 2002.
10
Also differences in the model simulations of evapotranspiration occur due to the dif-ferences in soil structure and management. Biome-BGC estimates the conductance as a direct function of VPD, soil-water potential and minimum temperature. In 2003 the VPD estimated by REMO was extremely high, and stomatal conductance was strongly reduced as well as the transpiration. In Biome-BGC higher plant available water causes
15
the microbial activity to increase stronger and increases the decomposition which may lead to increased soil mineral N, which further leads to higher GPP also under water stressed conditions hence reducing the drought reduction in GPP compared with the other models (LPJ, ORCHIDEE, JULES and PIXGRO). JULES estimates an even less reduction in GPP, which shows that this model seems to be less sensitive to drought
20
stress, a direct impact of the differentiated soil water distribution and the below-ground biomass distribution (Table 1).
(iii) The sensitivity of carbon fluxes to drought varies from model to model and can be directly related to the different modeling approaches. Models which simulate crop or grass harvest seem to have higher drought sensitivity than models without harvest
25
which may be due to increased bare-soil evaporation. Also the sensitivity to drought is higher in the models utilizing a two layer soil hydrology model. JULES has a very de-tailed soil hydrology and seems to be the least drought sensitive model here. It has yet to be determined whether the different model sensitivities to drought are due to the
car-BGD
4, 1201–1240, 2007
European 2003 carbon flux anomaly
using 7 models M. Vetter et al. Title Page Abstract Introduction Conclusions References Tables Figures ◭ ◮ ◭ ◮ Back Close
Full Screen / Esc
Printer-friendly Version Interactive Discussion
EGU
bon components sensitivity to soil moisture, or different hydrology schemes simulating different soil drying under the same climate forcings. Guo and Dirmeyer (2006) showed that many hydrology models simulate interannual variability of soil moisture better than the absolute values. However, the carbon flux sensitivity to drying will depend on the baseline level as well as the anomaly. Hence, our findings illustrate the need of
fur-5
ther model development and model evaluation against site-level measurements and inventories, including soil moisture observations where available, which may reduce the model differences and increase the reliability of the model estimated European carbon balance in the future.
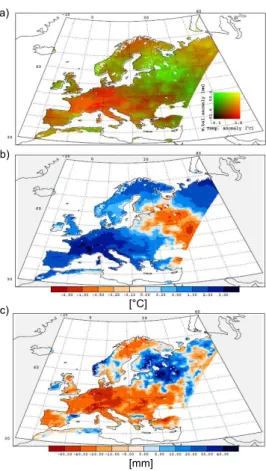
3.2 Spatial patterns of the climate and carbon flux anomalies in 2003
10
In 2003 the climate anomaly over Europe showed a typical dipole pattern (Fig. 3). Western and Central Europe were exposed to a strong heat and drought anomaly, which was more prominent in western parts than in the central region. Eastern Europe exhibited a cold and wet anomaly. The region between these major anomalies exhibited intermediate conditions. This climate anomaly pattern was also seen in the spatial NEP
15
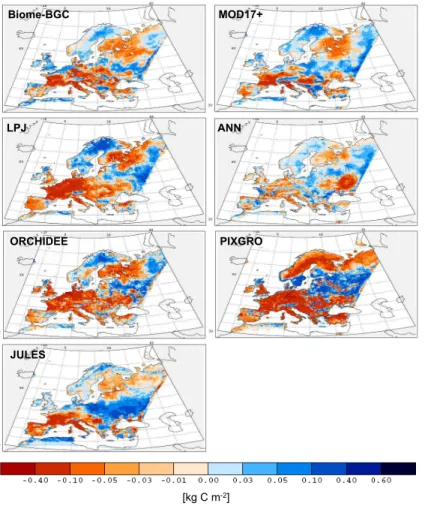
anomaly in 2003 (Fig. 4).
In 2003 the NEP decreased over large areas of Europe (Fig. 4, areas in red color), showing a clear dipole pattern. These affected areas correspond directly to the cli-mate anomalies over the same time period (Fig. 3). LPJ, ORCHIDEE and PIXGRO estimated greater affected areas (5.18 106, 5.42 106 and 5.64 106km2, respectively)
20
than JULES, Biome-BGC, MOD17+ and ANN (4.19 106, 4.76 106, 3.93 106and 3.37 106km2, respectively). The three latter models estimated a more heterogeneous pat-tern over Wespat-tern and Central Europe. Models agreed well in the spatial patpat-tern of vegetation responses to the cold and wet anomaly. There exist an area with increased carbon sequestration (blue colors) between the dry and warm area, and the cold and
25
wet area. MOD17+, ANN and JULES show the greatest extent of this area in Eastern Europe. All models agreed that the 2003 NEP anomaly was positive over Scandinavia and North Eastern Russia. The spatial pattern of 2003 anomaly estimated by PIXGRO
BGD
4, 1201–1240, 2007
European 2003 carbon flux anomaly
using 7 models M. Vetter et al. Title Page Abstract Introduction Conclusions References Tables Figures ◭ ◮ ◭ ◮ Back Close
Full Screen / Esc
Printer-friendly Version Interactive Discussion
EGU
differs relative to the other models especially for Northern and North Eastern Europe as the growing season 2002 is used for the anomaly estimate. As shown earlier, the growing season 2002 was exceptionally warm in comparison with both 2003 and base-line for this area (Fig. 2a, Table 4). This caused an increased productivity in 2002 relative to 2003. Nevertheless, the strong agreement in the spatial pattern of the net
5
ecosystem productivity anomaly in 2003 among the models of different complexity and structure reveals a high confidence in this pattern. Reichstein et al. (2006) showed that on a transect through Europe most site-measurements of NEP showed a negative av-eraged monthly NEP anomaly (July–September) as the difference between 2003 and 2002. In Germany, southern upper Rhine plain, the measured NEE in August and
10
September 2003 was significantly lower than in 2004 (Schindler et al., 2006). Jolly et al. (2005) also showed that the heat wave in 2003 caused an increased productivity in the Alps, which could also be seen in all models.
3.3 Contribution of the European carbon flux anomaly to the atmosphere in 2003 Independent of the reference period (long-term mean, baseline or 2002) all models
15
agreed on a reduction in NEP (Table 6). The estimates of the NEP change from the European terrestrial biosphere over the growing season 2003 relative to baseline (1998–2002) resulted in an additional atmospheric CO2 source about 0.002–0.27 Pg depending on model. Ciais et al. (2005) estimated the anomaly of the summer 2003 (July-September) for Europe to be –0.5 Pg relative to baseline (1998–2002) using
OR-20
CHIDEE. This value is larger than the maximum value in our study (–0.27 Pg, OR-CHIDEE) which can be related to different definitions of the growing season in these two studies (Mai–September in this study, relative to July–September in Cias et al., 2005). The growing season 2002 was obviously not an average year, being more pro-ductive than the long-term mean and the baseline for most of the models. Using this
25
year to estimate the carbon flux anomaly of the growing season 2003, would lead to a high estimate of the anomalous flux ranging between 0.01 and 0.41 Pg. The addi-tional carbon flux from land to the atmosphere resulted from a reduced gross primary
BGD
4, 1201–1240, 2007
European 2003 carbon flux anomaly
using 7 models M. Vetter et al. Title Page Abstract Introduction Conclusions References Tables Figures ◭ ◮ ◭ ◮ Back Close
Full Screen / Esc
Printer-friendly Version Interactive Discussion
EGU
productivity which reduction was between –0.37 Pg and –0.06 Pg relative to baseline over whole Europe. One model (JULES) estimated an increase in gross primary pro-ductivity of 0.19 Pg over the growing season 2003. All models agreed on a reduction of GPP in the growing season 2003 relative to 2002. Biome-BGC, ORCHIDEE and JULES estimated an overall increase in ecosystem respiration in 2003 relative to
base-5
line of 0.06, 0.02 and 0.12 Pg, respectively. The other models LPJ, MOD17+ and ANN, indicated a total decrease of ecosystem respiration over the growing season 2003 of –0.14, –0.003 and –0.12 Pg relative to baseline, respectively.
4 Conclusions
Our multi-model comparison study suggests that land ecosystems of Europe emitted
10
additional 0.02–0.27 Pg of carbon to the atmosphere in response to the drought in 2003 relative to baseline (1998–2002). Our estimates are comparable to the previously re-ported value (0.5 Pg, Ciais et al., 2005), which was calculated from the ORCHIDEE ecosystem model over a two-month shorter period of time (July–September) and thus yielded a stronger anomaly. Our study shows that a heat/drought anomaly over
West-15
ern and Central Europe was accompanied by a cold and wet anomaly over Western Russia. All models agreed in the response of the NEP anomaly over both the hot and dry areas as well as the cold and wet areas.
The models differ in their response to the heat and dry anomaly in Western and Central Europe regarding the gross fluxes GPP and Reco. An analysis of the different
20
sensitivities of the simulated carbon fluxes in the models to meteorological conditions as well as the model simulated soil-water content is currently in progress (Vetter et al., 20073). The diagnostic models estimated less variation in Reco compared to the
3
Vetter, M., Churkina, G.,Jung, M., Reichstein, M., Zaehle, S., Bondeau, A., Chen, Y., Ciais, P., Feser, F., Freibauer, A., Geyer, R., Jones, C. D., Papale, D., Tenhunen, J., Tomelleri, E., Trusilova, K., Viovy, N., and Heimann, M.: Sensitivity analysis of modeled carbon flux anoma-lies to input climate parameters: A special emphasis on the ecosystem respiration and its
BGD
4, 1201–1240, 2007
European 2003 carbon flux anomaly
using 7 models M. Vetter et al. Title Page Abstract Introduction Conclusions References Tables Figures ◭ ◮ ◭ ◮ Back Close
Full Screen / Esc
Printer-friendly Version Interactive Discussion
EGU
process-oriented models. The link between GPP and Reco as well as belowground processes should be revisited in the model structure for both, the process-oriented and the diagnostic models. A detailed data-model comparison exercise aims to identify model skill and uncertainties with emphasis on the response to drought (Jung et al., 20074).
5
An interesting question to explore is how the 2003 drought influences the functioning of land ecosystems in the following years. Previous studies suggested that effect of anomalous climatic events could be detected in ecosystem carbon fluxes for at least 3-5 years after the event’s occurrence and ecosystem responses could be discontinuous (Schimel et al., 2005). Given that European ecosystems experienced drought again in
10
2005 the recovery of ecosystems will most likely take longer and should be investigated in the future.
Acknowledgements. This study was funded through the CARBOEUROPE-Integrated Project “Assessment of the European Carbon Balance”, contract number: GOCE-CT-2003-505572.
References
15
Adiku, S. G. K., Reichstein, M., Lohila, A., Dinh, N. Q., Aurela, M., Laurila, T., Lueers, J., and Tenhunen, J. D.: PIXGRO: A model for simulating the ecosystem CO2exchange and growth of spring Barley, Ecol. Modell., 190, 260–276, 2006.
Andren, O. and Paustian, K.: Barley straw decomposition in the field – A comparison of models, Ecology, 68(5), 1150–1200, 1987.
20
Ball, J. T., Berry, J. A., and Woodrow I. E.: Conductance and its contribution to the control of photosynthesis under different environmental conditions, In: Progress in Photosynthesis Research, Vol. VI, edited by: Binggins, I. J., Martin Nijhof, Dordrecht, 221–224, 1987. constituents, in preparation, 2007.
4
Jung, M., Reichstein, M., Le Maire, G., Vetter, M., Zaehle, S., Viovy, N., et al.: The re-sponse of photosynthesis to drought in European forests: Investigating the performance of global biogeochemical models using eddy-covariance based data, in preparation, 2007.
BGD
4, 1201–1240, 2007
European 2003 carbon flux anomaly
using 7 models M. Vetter et al. Title Page Abstract Introduction Conclusions References Tables Figures ◭ ◮ ◭ ◮ Back Close
Full Screen / Esc
Printer-friendly Version Interactive Discussion
EGU
Ball, J. T. and Berry, J. A.: The C/C ratio: a basis for predicting stomatal control of photosyn-theis, Carnegie Institute Washington Year Book, 81, 88–92, 1982.
Bondeau, A., Smith, P. C., S ¨onke, Z., Schaphoff, S., Lucht, W., Cramer, W., Gerten, D., Lotze-Campen, H., M ¨uller, C., Reichstein, M., and Smith, B.: Modelling the role of agriculture for the 20th century global terrestrial carbon balance, Global Change Biology, Published article
5
online: 18-Jan-2007, doi:10.1111/j.1365-2486.2006.01305.x, 2007.
Botta, A., Viovy, N., Ciais, P., and Friedlingstein, P.: A global prognostic scheme of leaf onset using satellite data, Global Change Biology, 6, 709–726, 2000.
Chen, Y., Churkina, G., and Heimann, M.: A comparison of regional climate variables between various data sources. Technical reports – Max-Planck-Institute fr Biogeochemie, 8, 2007,
10
ISSN 1615-7400, 2007.
Churkina, G., Tenhunen, J., Thornton, P. E., Elbers, J. A., Erhard, M., Falge, E., Gruenwald, T., Kowalski, A. S., Rannik, U., and Sprinz, D. E.: Analyzing the ecosystem carbon dynamics of four European coniferous forests using a biogeochemistry model, ECOSYSTEMS, 6, 168– 184, 2003.
15
Churkina, G. and Running, S. W.: Investigating the balance between timber harvest and pro-ductivity of the global coniferous forests under global change, Climatic Change, 47, 167–191, 2000.
Churkina, G. and Running, S. W.: Contrasting climatic controls on the estimated productivity of global terrestrial biomes, Ecosystems, 1, 206–215, 1998.
20
Ciais, P., Reichstein, M., Viovy, N. Granier, A., Ogee, J., Allard, V., Aubinet, M., Buchmann, N., Bernhofer, C., Carrara, A., Chevallier, F., De Noblet, N., Friend, A. D., Friedlingstein, P., Gr ¨unwald, T., Heinesch, B., Keronen, P., Knohl, A., Krinner, G., Loustau, D., Manca, G., Matteucci, G., Miglietta, F., Ourcival, J. M., Papale, D., Pilegaard, K., Rambal, S., Seufert, G., Sousanna, J. F, Sanz, M.J., Schulze, E. D., Vesala, T., and Valentini, R.:. Europe-wide
25
reduction in primary productivity caused by the heat and drought in 2003, Nature, 437, 529– 533, 2005.
Cienciala, E., Running, S. W., Lindroth, A., Grelle, A., and Ryan, M. G.: Analysis of carbon and water fluxes from the NOPEX boreal forest: comparison of measurements with Forest-BGC simulations, J. Hydrol., 212–213, 62–78, 1998.
30
Cosby, B. J., Hornberger, G. M., Clapp, R. B., and Ginn, T. R.: A statistical exploration of the relationships of soil moisture characteristics to the physical properties of soils, Water Resour. Res., 20, 682–690, 1984.
BGD
4, 1201–1240, 2007
European 2003 carbon flux anomaly
using 7 models M. Vetter et al. Title Page Abstract Introduction Conclusions References Tables Figures ◭ ◮ ◭ ◮ Back Close
Full Screen / Esc
Printer-friendly Version Interactive Discussion
EGU
Collatz, G. J., Ribas-Carbo, M., and Berry, J. A.: A coupled photosynthesis- stomatal conduc-tance model for leaves of C4 plants, Australian J. Plant Physiology, 19, 519–538, 1992. Collatz, G. J., Ball, J. T., Grivet, C., and Berry, J. A.: Physiological and environmental regulation
of stomatal conductance, photosynthesis and transpiration: A model that includes a laminar boundary layer, Agric. Forest Meteorol., 54, 107–136, 1991.
5
Cox, P. M.: Description of the TRIFFID Dynamic Global Vegetation Model, Hadley Centre Tech-nical Note 24, Hadley Centre, Met Office, Exeter, UK, 2001.
Cox, P. M., Betts, R. A., Jones, C. D., Spall, S. A., and Totterdell, I. J.: Acceleration of global warming due to carbon-cycle feedbacks in a coupled climate model, Nature, 408, 184–187, 2000.
10
Cox, P. M., Betts, R. A., Bunton, C. B., Essery, R. L. H., Rowntree, P. R., and Smith, J.: The impact of new land surface physics on the GCM simulation of climate and climate sensitivity, Climate Dyn., 15, 183–203, 1999.
Cox, P. M., Huntingford, C., and Harding, R. J.: A canopy conductance and photo-synthesis model for use in a GCM land surface scheme, J. Hydrol., 212–213, 79–94, 1998.
15
De Pury, D.G.G., and Farquhar, G.D.: Simple scaling of photosynthesis from leaves to canopies without the errors of big-leaf models, Plant, Cell and Enviroment, 20(5), 537–557, 1997. Ding, Q. and Wang, B.: Circumglobal teleconnection in the northern hemisphere summer, J.
Climate, 18, 3483–3505, 2005.
Ducoudre, N., Laval, K., and Perrier, D.: SECHIBA, a new set of parameterizations of the
hy-20
drologic exchanges at the land-atmosphere interface within the LMD atmospheric circulation model, J. Climate, 6, 248–273, 1993.
Essery, R. L. H., Best, M. J., Betts, R. A., Cox, P. M., and Taylor, C. M.: Explicit representation of subgrid heterogeneity in a GCM land-surface scheme, J. Hydrometeorol., 43, 530–543, 2003.
25
Etheridge, D. M., Steele, L. P., Langenfelds, R. L., Francey, R. J., Barnola J.-M., and Morgan, V. I.: Natural and anthropogenic changes in atmospheric CO2over the last 1000 years from air in Antarctic ice and firn, J. Geophys. Res., 101, 4115–4128, 1996.
Farquahar, G., von Caemmerer, S., and Berry, J.: A biochemical model of photosynthetic CO2 assimilation in leaves of C3 species, Planta, 149, 78–80, 1980.
30
FAO Statistics June 2006 (http://faostat.fao.org/site/422/default.aspx), 2006.
Feser, F., Weisse, R., and von Storch, H.: Multi-decadal Atmospheric Modeling for Europe Yields Multi-purpose Data, EOS Transactions, 82, 305–310, 2001.
BGD
4, 1201–1240, 2007
European 2003 carbon flux anomaly
using 7 models M. Vetter et al. Title Page Abstract Introduction Conclusions References Tables Figures ◭ ◮ ◭ ◮ Back Close
Full Screen / Esc
Printer-friendly Version Interactive Discussion
EGU
Friend, A. D., Shugart, H. H., and Running, S. W.: A physiology-based model of forest dynam-ics, Ecology, 74, 797–797, 1993
Freibauer, A.: Regionalized inventory of biogenic greenhouse gas emissions from European agriculture, European J. Agronomy, 19, 135–160, 2003.
Friedlingstein, P., Joel, G., Field, C. B., and Fung, I.: Towards an allocation scheme for global
5
terrestrial carbon models, Global Change Biol., 5, 755, 1998.
Foley, J. A.: An equilibrium model of the terrestrial carbon budget, Tellus, 47B, 310–319, 1995. Galloway, J. N., Dentner, F. J., Capone, D. G., Boyer, E. W., Howarth, R. W., Seitzinger, S.
P., Asner, G. P., Cleveland, C. C., Green, P. A., Holland, E. A., Karl, D. M., Michaelis, A. F., Porter, J. H., Townsend, A. R., and V ¨ors ¨omarty, C. J.: Nitrogen cycles: past, present and
10
future, Biogeochemistry, 70, 153–226, 2004.
Gregory, D. and Smith, R. N. B.: Canopy, surface and soil hydrology. Unified Model documen-tation paper 25, Meteorological Offce, London Rd, Bracknell, Berkshire, RG12 2SY, 1990. Guo, Z., and Dirmeyer, P. A.: Evaluation of the Second Global Soil Wetness Project soil moisture simulations: 1. Intermodel comparison, J. Geophys. Res., 111, D22S02,
15
doi:10.1029/2006JD007233.u, 2006.
Haxeltine, A. and Prentice, I. C.: BIOME3:an equilibrium terrestrial biosphere model based on ecophysiological constraints, resource availability and competition among plant functional types, Global Biogeochem. Cycles, 10, 693—710, 1996.
Holland, E. A., Dentner, F. J., Braswell, B. H., and Sulzmann, J. M.: Contemporary and
pre-20
industrial global reactive nitrogen budgets, Biogeochemistry, 46, 7-43, 1999.
Intergovernmental Panel of Climate Change (IPCC): Climate change 2007: Physical science basis. Summary for Policymakers. IPCC, Genf, Switzerland,http://www.ipcc.ch/SPM2feb07.
pdf, 2007.
Jacob, D. and Podzun, R.: Sensitivity Studies with the Regional Climate Model REMO,
Meteo-25
rol. Atmos. Phys., 63, 119–129, 1997.
Jacobs, C.: Direct impact of atmospheric CO2enrichment on regional transpiration, PhD thesis, Wageningen Agricultural University, 1994.
Johns, T. C., Durman, C. F., Banks, H.T ., Roberts, M. J., McLaren, A. J., Ridley, J. K., Senior, C. A., Williams, K. D., Jones, A., Rickard, G. J., Cusack, S., Ingram, I. M., Crucifix, M.,
30
Sexton, M. H., Joshi, M. M., Dong, B. W., Spencer, H., Hill, R. S. R., Gregory, J. M., Keen, A. B., Pardaens, A. K., Lowe, J. A., Bodas-Salcedo, A., Stark, S., and Searl, Y.: The new Hadley Centre climate model HadGEM1: Evaluation of coupled simulations, J. Climate, 19,
BGD
4, 1201–1240, 2007
European 2003 carbon flux anomaly
using 7 models M. Vetter et al. Title Page Abstract Introduction Conclusions References Tables Figures ◭ ◮ ◭ ◮ Back Close
Full Screen / Esc
Printer-friendly Version Interactive Discussion
EGU
7, 1327–1353, 2006.
Jolly, W. M., Dobberlin, M., Zimmermann, N. E., and Reichstein, M.: Divergent vegetation growth responses to the 2003 heat wave in the Swiss Alps, Geophys. Res. Lett., 32, L18409, doi:10.1029/2005GL023252, 2005.
Jones, C. D. and Cox, P. M.: On the significance of atmospheric CO2growth-rate anomalies in
5
2002-03, Geophys. Res. Lett., 32, L14816, doi:10,1029/2005GL023027, 2005.
Jung, M., Henkel, K., Herold, M., and Churkina, G.: Exploiting synergies of global land cover products for carbon cycle modeling, Remote Sens. Environ., 101, 534–553, 2006.
Kalnay, E., Kanamitsu, M., Kistler, R., Collins, W., Deaven, D., Gandin, L., Iredell, M., Saha, S., White, G., Woollen, J., Zhu, Y., Chelliah, M., Ebisuzaki, W., Higgins, W., Janowiak, J., Mo,
10
K. C., Ropelewski, C., Wang ,J., Leetmaa, A., Reynolds, R., Jenne, R., and Joseph, D.: The NCEP/NCAR reanalysis project, Bull. Am. Meteorol. Soc., 77, 437–471, 1996.
Keeling, C. D. and Whorf, T. P.: Atmospheric CO2 records from sites in the SIO air sampling network. In Trends: A Compendium of Data on Global Change. Carbon Dioxide Information Analysis Center, Oak Ridge National Laboratory, U.S. Department of Energy, Oak Ridge,
15
Tenn., U.S.A, 2005.
Lloyd, J., and Taylor, J. A.: On the temperature dependence of soil respiration, Functional Ecol., 8, 315–323, 1994.
Koch, W. and Feser, F.: Relationship between SAR derived wind vectors and wind at ten meters height represented by a mesoscale model, Monthly Weather Rev., 134(5), 1505–1517, 2006.
20
Korner, C., Perterer, J., Altrichter, C., Meusburger, A., Slovik, S., and Zoschg, M.: A simple empirical model to estimate annual dry deposition of atmospheric pollutants in needles of spruce and pine, Allgemiene Forst und Jagdzeitung, 166(1), 1–9, 1995.
Krinner, G., Viovy, N., de Noblet-Ducoudre, N., Ogee, J., Polcher, J., Friedlingstein, P., Ciais, P., Sitch, S., and Prentice, I. C.: A dynamic global vegetation model for studies of
25
the coupled atmosphere-biosphere system, Global biogeochemical cycles, 19, GB1015, doi:10.1029/2003GB002199, 2005.
Lucero, O. A. and Rodriguez, N. C.: Spatial organization in Europe of decadal and interdecadal fluctuations in annual rainfall, Int. J. Climatol., 22, 805–820, 2002.
Lucht, W., Schaaf C. B., and Strahler, A. H.: An Algorithm for the retrieval of albedo from space
30
using semiempirical BRDF models, IEEE Trans. Geosci. Remote Sens., 38, 977–998, 2000. McGuire, A., Melillo, J., Joyce, L., Kicklighter, D., Grace, A., Ill, B. M., and Vorosmarty, C.:
BGD
4, 1201–1240, 2007
European 2003 carbon flux anomaly
using 7 models M. Vetter et al. Title Page Abstract Introduction Conclusions References Tables Figures ◭ ◮ ◭ ◮ Back Close
Full Screen / Esc
Printer-friendly Version Interactive Discussion
EGU
for potential vegetation in North America, Global Biogeochem. Cycles, 6, 101-124, 1992. Monteith, J. L.: Accomodation between transpiring vegetation and the convective boundary
level, J. Hydrol., 166, 251–263, 1995.
Monteith, J. L.: Evaporation and environment, Symposium of the society of experimental biol-ogy, 19, 205–234, 1965.
5
Neilson, R. P.: Vegetation redistribution: a possible biosphere source of CO2 during climate change, Water, air and soil pollution, 70, 659–673, 1993.
Nemani, R. R., Keeling, C. D., Hashimoto, H., Jolly, W. M., Piper, S. C., Tucker, C. J., Myneni, R. B., and Running, S. W.: Climate-driven increases in global terrestrial net primary production from 1982 to 1999, Science, 300(5625), 1560–1563, 2003.
10
Orchard, V. A. and Cook, F. J.: Relationship between soil respiration and soil moisture, Soil Biol. Biochem., 15(4), 447–453, 1983.
Owen, K. E., Tenhunen, J., Reichstein, M., Wang, Q., Falge, E., Geyer, R., Xiao, X., Stoy, P., Ammann, C., Arain, A., Aubinet, M., Auerla, M., Bernhofer, Ch., Chojnicki, B., Granier, A., Gruenwald, T., Hadley, J., Heinesch, B., Hollinger, D., Knohl, A., Kutsch, W., Lohila,
15
A., Meyers, T., Moors, E., Moureaux, C., Pilegaard, K., Saigusa, N., Verma, S., Vesala, T., and Vogel, C.: Linking flux network measurements to continental scale simulations: ecosystem CO2 exchange capacity under non-water-stressed conditions, Global Change Biol., doi:10.1111/j.1365-2486.2007.01326.x, 2007.
Papale, D., Reichstein, M., Aubinet, M., Canfora, E., Bernhofer, C., Kutsch, W., Longdoz, B.,
20
Rambal, S., Valentini, R., Vesala, T., and Yakir, D.: Towards a standardized processing of Net Ecosystem Exchange measured with eddy covariance technique: algorithms and uncertainty estimation, Biogeosciences, 3, 571–583, 2006,http://www.biogeosciences.net/3/571/2006/. Papale, D. and Valentini, R.: A new assessment of European forests carbon exchanges by eddy
fluxes and artificial neural network spatialization, Global Change Biol., 9, 525–535, 2003.
25
Reichstein, M., Ciais, P., Papale, D., Valentini, R., Running, S. W., Viovy, N., Cramer, W., Granier, A., Ogee, J., Allard, V., Aubinet, M., Bernhofer, C., Buchmann, N., Carrara, A., Gr ¨unwlad, T., Heimann, M., Heinesch, B., Knohl, A., Kutsch,W., Loustau, D., Manca, G., Mat-teucci, G., Miglietta, F., Ourcival, J. M., Pilegaard, K., Pumpanen, J., Rambal, S., Schaphoff, S., Seuffert, G., Sousanna, J. F., Sanz, M. J., Vesala, T., and Zhao, M.: Reduction of
30
ecosystem productivity and respiration during the European summer 2003 climate anomaly: a joint flux tower, remote sensing and modelling analysis, Global Change Biol., 12, 1–18, doi:10.1111/j.1365-2486.2006.01224.x, 2006.