HAL Id: hal-02768775
https://hal.inrae.fr/hal-02768775
Submitted on 4 Jun 2020HAL is a multi-disciplinary open access archive for the deposit and dissemination of sci-entific research documents, whether they are pub-lished or not. The documents may come from teaching and research institutions in France or
L’archive ouverte pluridisciplinaire HAL, est destinée au dépôt et à la diffusion de documents scientifiques de niveau recherche, publiés ou non, émanant des établissements d’enseignement et de recherche français ou étrangers, des laboratoires
Effects of surface condition and hillslope position on
hydrologic and erosion processes
Chi-Hua Huang, Chantal Gascuel-Odoux, Frédéric Darboux, - Cros-Cayot,
Sylvie Cros-Cayot, Philippe Davy, Djilali Heddadj
To cite this version:
Chi-Hua Huang, Chantal Gascuel-Odoux, Frédéric Darboux, - Cros-Cayot, Sylvie Cros-Cayot, et al.. Effects of surface condition and hillslope position on hydrologic and erosion processes. 16. Congrès mondial de science du sol, Aug 1998, Montpellier, France. �hal-02768775�
Scientific Registration n° : 831 Symposium n° : 31
Presentation : oral
Effects of surface condition and hillslope position on
hydrologic and erosion processes
Influence des conditions de surface et de la position dans
le versant sur les processus de ruissellement et d'érosion
HUANG Chi-hua (1), GASCUEL-ODOUX Chantal (2), DARBOUX Frederic (2), CROS-CAYOT Sylvie (2), DAVY Philippe (3), HEDDADJ Djilali (4)
(1) NSERL, 1196 SOIL Bldg, Purdue Univ., W. Lafayette, IN, 47907, USA. (2) INRA, 65 Route de Saint-Brieuc, F-35042 Rennes Cedex, France.
(3) Géosciences Rennes, Campus de Beaulieu, F-35042 Rennes Cedex, France.
(4) ENSAR, Science du sol, 65 Route de Saint-Brieuc, F-35042 Rennes Cedex, France.
INTRODUCTION
Runoff and sediment productions from a hillslope are highly variable, both spatially and temporally. This natural variability results from differences in surface conditions at both hillslope and local scales as well as the seasonal rainfall and crop growth patterns. Measurements of runoff and sediment transport are frequently conducted from delimited plots that do not take into account spatial and temporal variations in the hillslope. Therefore, these data can not be extrapolated to represent processes at the hillslope scale. In order to develop a process-based erosion prediction model, we need to understand relationships between surface condition and processes of runoff and sediment production at different spatial and temporal scales.
The assessment of variations of sheet flow and erosion is limited in the literature due to difficulty of acquiring dynamic data in time and space. Unlike concentrated flow erosion which has well defined flow pathway, sheet flow follows surface microtopography in a succession of small depressional ponds and overland flow elements. These microtopographic features also dictate the flow direction, depth, and velocity and consequently sediment production and deposition. These spatial variations also change in time from a succession of rainfall events, field cultivations and crop growth.
It is necessary to incorporate different scales in hillslope predictive models. In small scales, i.e., 1- to 2- meter sized surfaces, microtopography and surface sealing have a major effect in water flow and sediment movement. As the areal extent increases, more large-scale topographic effects become important. These large-large-scale topographic factors include
redistribution in the profile. Changes in slope steepness also cause different levels of erosion, deposition and sediment redistribution on the surface. This redistribution of water and sediment can cause runoff production from small areas but not from a larger scale hillslope (Gascuel-Odoux et al.,1996).
Runoff initiation marks the beginning of surface erosion and it is affected by soil morphology ranging from topographic features to microtopography in mm scales. Surface morphology (1) controls the water pathway; (2) decreases flow velocity and increases flow tortuosity; (3) increases particle detachability; (4) affects raindrop impact and surface sealing; (5) modifies infiltration rate; and (6) traps sediment and water. In the past, microtopographic effects on surface flow processes are lumped into an empirically defined friction term. This is due to the use of large grids, 10 m or greater, which is too large to account for mm-scale microtopographic effects. Recent development in laser scanning technology enables a precise digitization of surface microtopography and its minute change after rainfall. This capability allows an opportunity to quantify microtopographic effects on surface flow and transport in minute details.
This paper contains three examples of addressing spatial and temporal variability in runoff and erosion processes. These efforts include monitoring natural runoff and sediment production in the field, recreating surface hydrologic conditions in a laboratory plot box and developing numerical models for surface flow network from microtopography in mm grids. Encompassing scales from 1 mm to 200 m, these studies typify a multi-faceted approach that all efforts are complementary and beneficial to each other. Field data were used to show sources of variability and identify subject areas that need further quantification. Laboratory study was conducted for specific conditions or processes identified from field observations. These multi-scale approaches provide a basic framework toward the understanding hillslope scale erosion processes that would eventually be used to build a physically-based erosion prediction model.
Example 1: Spatial and Temporal Variability under Natural Hillslope Conditions The field study site was located near Rennes in western France. The soil is loamy (distric and aquic eutrochrepts) and well drained. The study is situated in a gentle slope. After a short summit, there is a midslope section approximately 200 m long sloping at 4.5% and gradually changing to 1.5% in the last 50 metres, resulting in a slightly concave downslope element. The study field had been in corn with rows directly downslope. Corn was planted at the beginning of May and harvested in November. The field remained bare through winter months until next April when the soil was tilled for planting.
The experimental design consists of a network of unbounded, non-overlapping plots with simple collectors that allow easy runoff and sediment transport measurements. The collectors were placed at various landscape positions to study spatial variability of surface flow. Each collector intercepted overland flow from the crop interrows with an upslope contributing area defined by the oriented crop rows. Detailed descriptions of the field site and runoff collection procedure were given by Gascuel-Odoux et al. (1996).
Runoff samples were collected from three replicate plots at five landscape positions: summit, shoulder, midslope, footslope and toeslope. These plots were monitored for one year, from April to April. The amount of water and sediment was measured after each rainfall event if the rainfall amount was greater that 4 mm or the mean hourly intensity higher than 2.5 mm/h. A total of 44 rainfall events were monitored. Surface rilling was not observed during the year. Results of the field natural runoff study were presented graphically by showing relative contributions of different runoff and erosion intensity classes from each of the five hillslope positions (Fig. 1).
There are three distinguishable stages of sediment production in the annual cycle. During the first stage that corresponds to soil crust development, sheet flow was low and restricted to the upslope region. The degree of crust development depended on both slope gradient and landscape position. Large aggregates were clearly visible at the lower portion of the hillslope, i.e., from footslope to toeslope, where runoff was low. At upslope locations with higher runoff, structural and depositional crusts developed in depressions and along flow pathways. In this period, the potential for soil erosion was high, but soil roughness and high infiltration limited both sheet flow and erosion. During the second stage which last up to crop harvesting, the soil was dry and well crusted at the surface. Heavy rainfall events induced sheet flow and sediment transport from the upslope to the footslope. A similar spatial distribution as Stage 1, high at portions of high slope gradients and decreasing downslope, was observed but at a much higher intensity. Sediments were mostly deposited beyond the footslope excepted during higher intensity rainfall events. The third stage, from fall to early spring, corresponds to a period of numerous low intensity rainfall events. During this stage, sheet flow was frequent but mainly came from the lower slopes. The sediment load was low, measuring only a few grams per litre. This spatial distribution was due to higher moisture contents at the bottom portion of the hillslope which facilitated the buildup of water table and quick saturation condition. Despite a high sheet flow at the lower slope portions, the sediment transport remained low due to low slope gradients and short slope segments.
Figure 1. Partition of runoff and sediment at five hillslope positions from natural runoff plots.
These results demonstrate a real space and time distribution of sheet flow and sediment transport as affected by rainfall characteristics, vegetation cover, and soil moisture and surface conditions. This shows the difficulty of extending data from small runoff plots to field situations without first knowing characteristics of the hillslope.
Example 2: Laboratory Study of Soil Hydrologic Effects on Erosion Process
The laboratory study was conducted on a dual-box system consisting of a 5-m long test box and a 1.8-m long feeder box. Both boxes are 1.2-m wide and 0.3-m deep. The feeder box is positioned upslope from the test box. These two boxes can be connected such that sediment from the feeder box can be fed to the upper-end of the test box. When disconnected, runoff samples can be collected separately from each box.
The test box can be set to either seepage or drainage condition by a water circulation system (Gabbard et al., 1998). The feeder box was free drained and at 10% slope. These two boxes were filled with test soil and placed under two separate sets of oscillating nozzle, programmable rainfall simulators.
Runoff Distribution Sediment Distribution
0 25 50 75 100
summit shoulder midslope footslope toeslope
Stage 1 0 25 50 75 100
summit shoulder midslope footslope toeslope
Stage 2 0 25 50 75 100
summit shoulder midslope footslope toeslope 0 to 1 l 1 to 60 l > 60 l Stage 3 0 25 50 75 100
summit shoulder midslope footslope toeslope
Stage 1 0 25 50 75 100
summit shoulder midslope footslope toeslope
Stage 2 0 25 50 75 100
summit shoulder midslope footslope toeslope 0 to 1 g/l 1 to 10 g/l 10 to 50 g/l > 50 g/l
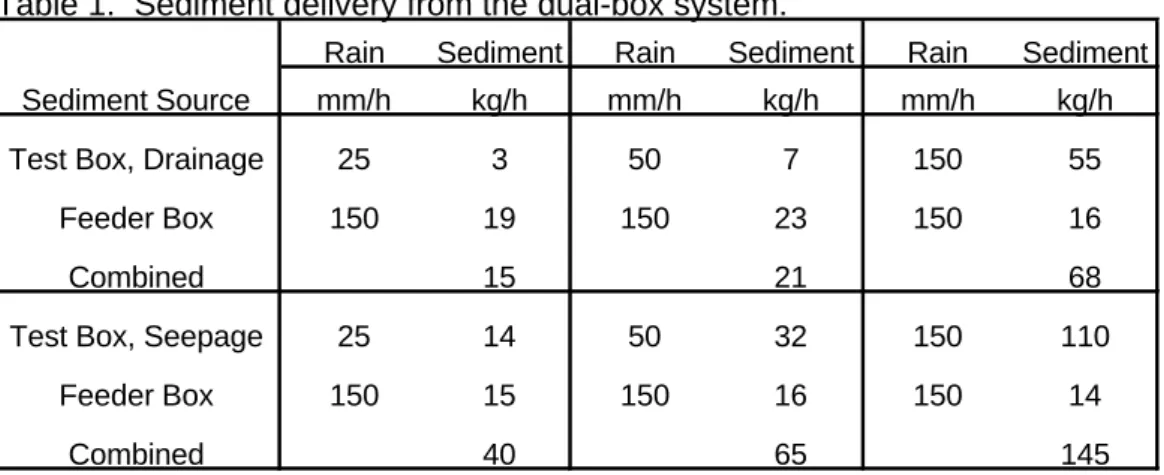
The experiment was conducted on a Cincinnati silt loam soil under either +20 cm seepage or free drainage condition. The rainfall intensity on the test box varied form 25 to 150 mm h-1 while the intensity at the feeder box remained constant at 150 mm h-1. Sediment delivery data are tabulated in Table 1.
After-run surface under seepage condition showed severe rilling while the surface under drainage showed a sealed condition with minor scours and no evidence of rilling. Differences in the surface features from seepage and drainage conditions are also confirmed by the sediment delivery data that showed 2 to 5 times higher sediment delivery under seepage conditions. Sediment data in Table 1 also suggests two entirely different sediment regimes: a detachment limiting regime under drainage condition and a transport limiting regime under seepage condition.
If we compare the sediment budget the dual-box system, we found that the total sediment production from both boxes rained separately was greater than when the sediment from the text box when both boxes were connected under drainage conditions. This indicates two possibilities: 1) some feeder sediments may have been deposited in the test box; and 2) the feeder runoff may have reduced the sediment production in the test box. Contrarily, under seepage condition, sediment productions from the test box with runoff from the feeder box were always greater than the combined sediment from both boxes rained separately. Since seepage condition reduced soil cohesion and made the soil ready for transport, runoff water from the feeder box caused additional sediment transport in the test box. Sediment delivery under seepage condition was limited by the transport capacity of the flow because the sediments were readily available for transport. Since drainage condition increases soil cohesion and reduces soil detachability, the sediment delivery under drainage condition is limited by the detachment rate or under a detachment limiting regime.
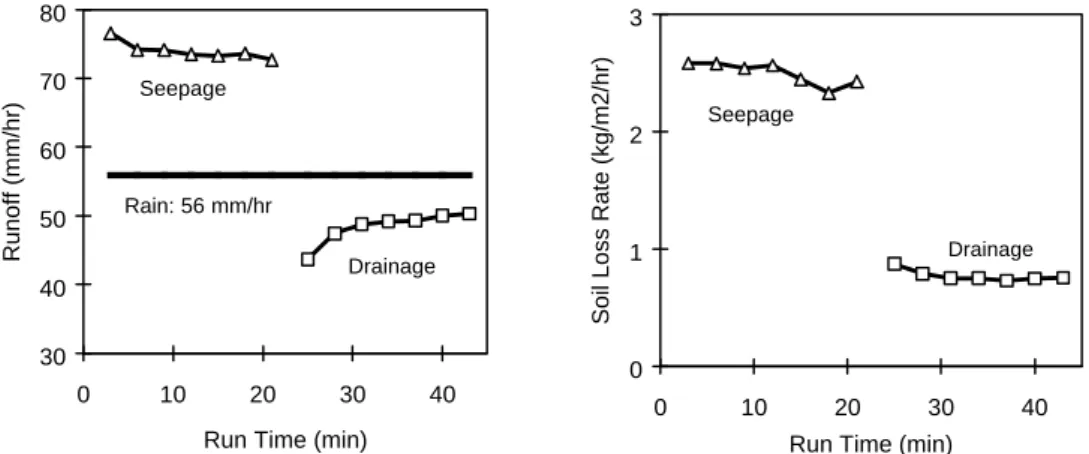
The effect of near-surface hydraulic gradient on soil erosion is further illustrated by a data set that sudden reversal from seepage to drainage condition occurred during the rainstorm (Fig. 2). The study soil was a Glynwood clay loam, with 20 cm seepage pressure
Table 1. Sediment delivery from the dual-box system.
Rain Sediment Rain Sediment Rain Sediment
Sediment Source mm/h kg/h mm/h kg/h mm/h kg/h
Test Box, Drainage 25 3 50 7 150 55
Feeder Box 150 19 150 23 150 16
Combined 15 21 68
Test Box, Seepage 25 14 50 32 150 110
Feeder Box 150 15 150 16 150 14
under 56 mm h-1 rainstorm. The reversal from seepage to drainage condition caused a reduction of runoff from 75 to 48 mm h-1 and sediment delivery from 2.5 to 0.7 kg m-2 h-1.
This illustrates the role of surface hydrologic conditions, especially seepage and drainage gradients, in erosion.
Figure 2. Changes in runoff and erosion as the Test Box was changed from seepage to drainage conditions during the rainstorm.
Example 3: Microtopography and Flow Network Development.
A combined experimental and numerical procedure was used in the study of microtopographic effects on runoff initiation and flow network development. Experimentally, a laser scanner (Huang and Bradford, 1990) was used to digitize the surface of a 2.5 m x 2.5 m soil box in mm grids after successive simulated rainfalls. Based on the digitized microtopography, the flow network development was simulated numerically using the conditioned walker model (Chase, 1992).
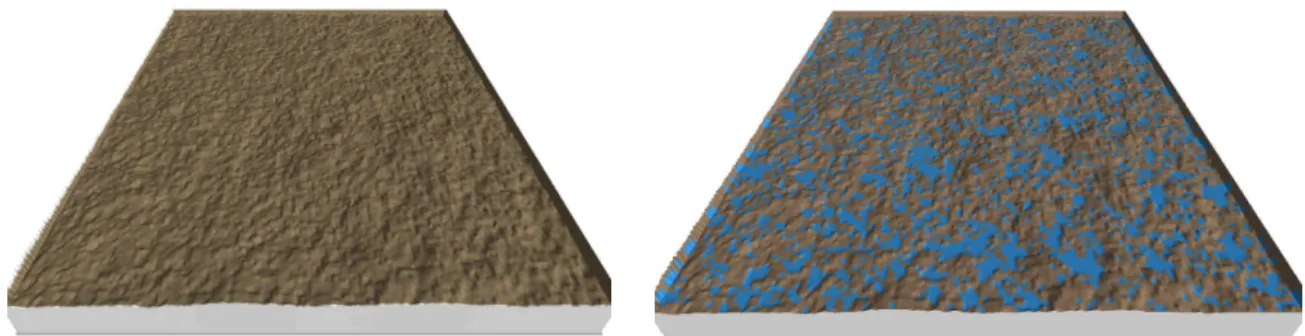
The walker model allows a gradual filling of surface depressions. A walker is introduced on the surface with a random position and a certain amount of water. It moves on the surface according to the steepest slope gradient. If the walker is trapped in a local minimum or depression, it fills the depression. If the carried water is less than the depression volume, the walker empties all its water to the depression and disappears; if the carried amount of water is sufficient to fill the local minimum, it fills it and continues to move with the remaining water. When a depression is filled, it outflows and feeds into another depression. At the beginning, few puddles are connected and water can be transferred for short distances only. As more and more depressions are filled and became connected, a network grows. When all the depressions are filled and connected, surface water can go through this system. Examples of a surface before and after the water filling were presented in Fig. 3.
This connectivity network development is measured using Percolation Theory (Stauffer and Aharony, 1994). Evolution of runoff contributing area often shows a threshold effect: below a certain amount of added water, most of depressions are disconnected; and above
30 40 50 60 70 80 0 10 20 30 40
Run Time (min)
Runoff (mm/hr) Rain: 56 mm/hr Seepage Drainage 0 1 2 3 0 10 20 30 40
Run Time (min)
Soil Loss Rate (kg/m2/hr)
Seepage
this critical water amount, most of depressions contribute to runoff. The digitized surface data set are used to derive geometric parameters for repeated surface simulation that enables a statistical analysis of surface properties on runoff initiation.
Figure 3. Surface microtopography before and after puddle filling.
CONCLUDING REMARKS
Quantifying spatial and temporal variability in runoff and erosion is paramount in building process-based hillslope models. This paper demonstrates a multi-scale approach encompassing field, laboratory and statistical-numerical procedures, that would eventually further the erosion science. Through cooperative efforts demonstrated in this endeavor, progress in understanding hillslope scale processes will definitely accelerate.
LIST OF REFERENCES
Chase, C.G. 1992. Fluvial landsculpting and the fractal dimension of topography.
Geomorphology. 5: 39-57.
Gabbard D.S., C. Huang, L.D. Norton, and G.C. Steinhardt. 1998. Landscape position, surface hydraulic gradients and erosion processes. Earth Surface Processes and
Landforms. 23:83-93.
Gascuel-Odoux, C., S. Cros-Cayot, and P. Durand. 1996. Spatial variations of sheet flow and sediment transport on an agricultural field. Earth Surface Processes and Landforms. 21:843-851.
Huang, C., and J.M. Bradford. 1990. Portable laser scanner for measuring soil surface roughness. Soil Sci. Soc. Am. J. 54:1402-1406.
Stauffer, D., and A. Aharnoy. 1994. Introduction to Percolation Theory. Taylor & Francis Inc., London.
Key words: soil erosion, surface condition, runoff, sediment, spatial and temporal variability Mots clés : érosion du sol, condition de surface, ruissellement, sédiment, variabilité spatiale