HAL Id: hal-02930837
https://hal.archives-ouvertes.fr/hal-02930837
Submitted on 8 Sep 2020
HAL is a multi-disciplinary open access
archive for the deposit and dissemination of
sci-entific research documents, whether they are
pub-lished or not. The documents may come from
teaching and research institutions in France or
abroad, or from public or private research centers.
L’archive ouverte pluridisciplinaire HAL, est
destinée au dépôt et à la diffusion de documents
scientifiques de niveau recherche, publiés ou non,
émanant des établissements d’enseignement et de
recherche français ou étrangers, des laboratoires
publics ou privés.
Scandinavia
A. Born, M. Kageyama, K. Nisancioglu
To cite this version:
A. Born, M. Kageyama, K. Nisancioglu. Warm Nordic Seas delayed glacial inception in Scandinavia.
Climate of the Past, European Geosciences Union (EGU), 2010, 6 (6), pp.817-826.
�10.5194/cp-6-817-2010�. �hal-02930837�
Clim. Past, 6, 817–826, 2010 www.clim-past.net/6/817/2010/ doi:10.5194/cp-6-817-2010
© Author(s) 2010. CC Attribution 3.0 License.
Climate
of the Past
Warm Nordic Seas delayed glacial inception in Scandinavia
A. Born1,2,3,*, M. Kageyama3, and K. H. Nisancioglu1,4
1Bjerknes Centre for Climate Research, Bergen, Norway 2Geophysical Institute, University of Bergen, Bergen, Norway
3Laboratoire des Sciences du Climat et l’Environnement, Gif sur Yvette, France 4UNI Research, Bergen, Norway
*now at: Climate and Environmental Physics, Physics Institute, University of Bern, Bern, Switzerland Received: 7 July 2010 – Published in Clim. Past Discuss.: 13 August 2010
Revised: 22 November 2010 – Accepted: 13 December 2010 – Published: 20 December 2010
Abstract. We simulate the last glacial inception, 115 000 years ago, with a three dimensional thermomechan-ical ice sheet model of the Northern Hemisphere, forced by a comprehensive coupled climate model. High oceanic heat transport into the Nordic Seas prevents large scale ice growth over Scandinavia. Glacial inception in the region starts on the highest mountains in the south when sea surface tem-peratures in the Nordic Seas are reduced by at least 3◦C. Ice growth in Northern Scandinavia requires a cooling by at least 4◦C. This is in good agreement with marine proxy data from the Nordic Seas and North Atlantic as well as available terrestrial data. This study thus provides a physical under-standing and revised timing of the first glacier advance over Scandinavia.
1 Introduction
During the past 800 000 years, climate has been relatively cold with ice sheets covering large parts of the Northern Hemisphere continents most of the time. At the last glacial maximum, 21 000 years before present, an ice sheet ex-isted over North America with a volume equivalent to the present day Antarctic ice sheet, decreasing global sea level by 74 m (Peltier, 2004). Eurasia was covered with an ice vol-ume equal to 2.5 times the present Greenland ice sheet, or 17 m sea level equivalent. Additional 25–30 m of sea level equivalent accumulated on the Antarctic ice sheet and on smaller ice caps (Lambeck and Chappell, 2001) for a to-tal sea level decrease of 120 to 130 m relative to present (Waelbroeck et al., 2002).
Correspondence to: A. Born
(born@climate.unibe.ch)
While extensive work addresses the extent and volume of ice sheets at their maximum, the erosive effect of the ice masses themselves removed most of the sediments holding information about glacial inception. Thus, little is known about advancing glaciers at the end of the last interglacial, the epoch when climate for the last time was similar to present day. Geological data suggests that ice first grew over the Canadian Arctic islands, Labrador, northern continental Canada, continental western Siberia and Eurasian Arctic is-lands (Andrews and Barry, 1978; Mangerud and Svendsen, 1992; Clark et al., 1993; Svendsen et al., 2004; Lambeck et al., 2006).
The last glacial maximum Fennoscandian ice sheet is thought to be the result of ice masses spreading west and south from mountain nucleation sites in western Siberia, the Eurasian Arctic islands, and probably on Svalbard. However, an independent glaciation over Scandinavia started soon af-ter the first global sea level decrease (Mangerud et al., 1981). This first ice growth was apparently rapid and large because the glacio-isostatic depression in south-western Norway was as fast as the global sea level decrease due to ice growth else-where (Mangerud, 1991). The ice front reached the fjord within a few kilometers from an excavation site at Fjøsanger, close to Bergen, allowing the deposition of ice-rafted detri-tus in marine sediments off the coast (Baumann et al., 1995; Risebrobakken et al., 2005, 2007).
Despite these reconstructions, the history of early Scandi-navian glaciation is inconclusive (Mangerud, 2004). Coastal ice limits are known for only four localities in southern Nor-way, and the earliest limit is based on a single record. Dating is problematic because the time period of interest is beyond the applicability of radiocarbon dating. Even in younger sediments only intervals between glacier advances contain enough organic material to be used for this method. Instead, the chronology is based on correlation with other regions that can be dated by other means. Evidence for early glacier
advances and retreats in Southwestern Scandinavia is con-trasted by speleothems from karst caves north of the Arc-tic circle that suggest ice-free conditions until approximately 95 ka (Lauritzen, 1984, 1986; Mangerud, 1991).
The last two decades brought only minor advances from new field observations. Numerical ice sheet modeling could improve the understanding of this period but most studies focus on the primary inception regions over North America and western Siberia (Marshall and Clarke, 1999; Zweck and Huybrechts, 2005; Calov et al., 2005a; Kubatzki et al., 2006; Charbit et al., 2007; Peyaud et al., 2007). This is probably due to the lack of constraints on timing and extent of ice from data, but also because the steep Scandinavian topog-raphy and variable climate are a challenge for the realistic representation of glaciers. The interaction of land based ice with floating ice shelves like in the Barents Sea remains an issue (Peyaud et al., 2007). Moreover, recent studies reveal a major reorganization of ocean currents in the region dur-ing glacial inception (Risebrobakken et al., 2005, 2007; Born et al., 2010a,b), and ocean circulation is thought to have a crucial impact on glaciers in the maritime climate of Scandi-navia. The importance of ocean circulation changes has been shown in the study by Calov et al. (2005b), where an artifi-cially weakened Atlantic meridional overturning circulation facilitates ice sheet growth in southern Scandinavia due to lower temperatures, while less ice grows further north as a consequence of reduced precipitation.
Prolonged interglacial warmth in the North Atlantic, de-spite decreasing high latitude insolation and decreasing sea levels indicating progressing ice growth on land, is reported from a number of marine sediment cores (Ruddiman and McIntyre, 1975; McManus et al., 2002). Further north in the Nordic Seas, recent studies show that the gradual cli-mate cooling due to decreasing insolation after the last inter-glacial was interrupted by a period of transient warmth (Rise-brobakken et al., 2007). As a direct result of weaker sum-mer insolation, Arctic sea ice grows thicker and ice export in the East Greenland Current intensifies. The freshwater trans-port by sea ice into the subpolar North Atlantic reduces deep convection in the northwest Atlantic and thereby effectively changes the density stucture of the region. This causes a non-linear response of the subpolar gyre that amplifies freshening by sea ice. The weakening of the subpolar gyre results in a higher fraction of subtropical waters in the Atlantic inflow into the Nordic Seas and thus warming along the path of the Norwegian Atlantic Current (Born et al., 2010a,b).
As a result, ocean heat transport into the Nordic Seas increased between 119 ka and 115 ka. The anomalous warmth ends with rising summer insolation and an estimated temperature decrease of about 3◦C as inferred from plank-tic foraminiferal data. Ice-rafted detritus indicates that ice growth over Scandinavia started at about the same time. Since ice-rafted detritus is only found when ice sheets reach sea level and produce floating icebergs, a terrestrial expan-sion of glaciers could have occurred even earlier. However,
glaciers in Scandinavia are mostly found in close proximity to fjords and not far from sea level even in present day cli-mate. This, together with the arguably rapid onset of the Scandinavian inception (Mangerud et al., 1981), suggests that the occurrence of ice-rafted detritus gives a reasonable estimate for the a large-scale glacier advance in Scandinavia. Dating of terrestrial sediments involves uncertainties of sev-eral millennia and the better-dated marine sediment records are ambiguous about the location of glacier advances. Fur-thermore, neither of these records provide information on whether the presence of a warm ocean favored glaciation due to enhanced moisture supply or if the relatively warm climate caused a delay in glacial inception.
In this study we suggest that a well documented tran-sient strengthening of the Norwegian Atlantic Current de-layed large scale glacier advance over Scandinavia until after 115 000 years ago (115 ka), followed by a rapid accumula-tion of ice. The climate and ice sheet models used are de-scribed in Sect. 2. Section 3 presents a simulation of land ice at 115 ka and investigates the impact of ocean heat transport variability on ice growth. Section 4 quantifies the reduction of sea surface temperature necessary to accumulate ice over Scandinavia. We discuss and conclude in Sects. 5 and 6.
2 Model description and experiments
The numerical ice sheet model used in this study is SICOPO-LIS (SImulation COde for POLythermal Ice Sheets), a three dimensional thermomechanical ice sheet model (Greve, 1997). It simulates ice rheology and mass balance on a reg-ular grid, using a stereographic projection centered on the North Pole. The horizontal resolution is set to 40 km and there are 90 vertical layers: 80 equidistant layers in cold ice and 10 representing a layer of ice at the pressure melting point. The model employs the shallow ice approximation, neglecting longitudinal stress gradients. As a consequence of this simplification, floating ice shelves and ice streams cannot be accurately simulated. This introduces only a neg-ligible error for the simulation of the Northern Hemispere at a time of relatively low ice volume. Present day ice and bedrock topographies used for intialization of the model are taken from the ETOPO5 data set (NOAA, National Geophys-ical Data Center, 1988). Results shown represent a quasi-equilibrium after 50 000 years simulation time.
Mass balance at the upper boundary of the model is com-puted on the basis of monthly surface air temperature and total precipitation. The snow fraction of monthly precipita-tion is estimated as a linear funcprecipita-tion between −10 and 7◦C, with all precipitation falling as snow below that range and all as rain above. Only solid precipitation contributes to accu-mulation. Rain runs off immediately. Calculation of melt is based on a positive degree day model (Reeh, 1991) with pa-rameters βs=3 mm K−1for snow and βs=12 mm K−1for ice. The calculation of positive degree days from monthly
A. Born et al.: Warm Nordic Seas delayed glacial inception in Scandinavia 819 average data employs the semi-analytical approach by Calov
and Greve (2005). A constant geothermal heat flux of 55 mW m−2 is assumed at the lower boundary. Although this value is known to vary widely in different regions, the relatively thin ice caps formed in glacial inception are not sensitive to this parameter.
Climate data is provided by the Institut Pierre Simon Laplace coupled model version 4 (IPSL CM4). This com-prehensive climate model comprises ocean, sea ice, atmo-sphere and land surface components (Marti et al., 2010). The atmospheric model has a resolution of 3.75 zonally and 2.5 meridionally, thus approximately 250 km over Scandinavia, on 19 vertical levels (Hourdin et al., 2006). Sea ice is sim-ulated on the 2 degree horizontal ocean grid to compute ice rheology and advection, featuring two poles over continents in the Northern Hemisphere for a better representation of the Arctic Ocean. Thermodynamical processes are represented in three vertical layers, the uppermost for snow (Fichefet and Maqueda, 1999, 1997). Dynamical effects of land ice are neglected in this model. Surface elevation and albedo are invariant at preindustrial values.
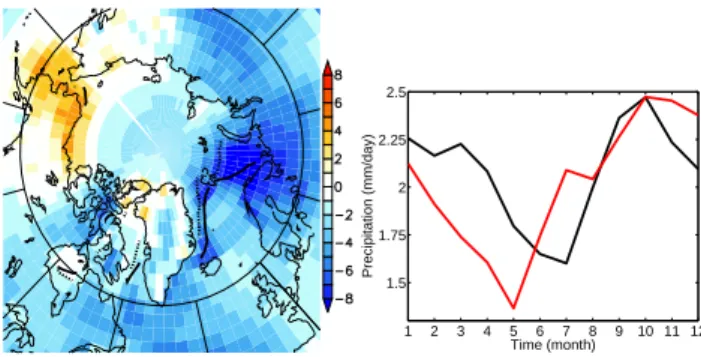
In order to estimate model biases, a 900 year control sim-ulation of preindustrial climate is compared to observational climatology (Uppala et al., 2005, Fig. 1). Simulated global surface air temperatures are 1.46◦C lower than observed, which can partly be attributed to lower greenhouse gas con-centrations of 280 ppmv. Temperatures over Scandinavia are between 2 and 7◦C lower than the present day clima-tology, the result of a weaker Atlantic ocean heat transport (Marti et al., 2010). The Barents Sea inflow is very weak in the preindustrial simulation, resulting in too large a sea ice area in this region and hence too low temperatures. While this direct comparison of preindustrial control simulation and present day climatology has to be interpreted cautiously, the ocean heat transport and temperature bias must partly be at-tributed to model shortcomings. However, since the temper-ature bias is too cold, the delay in inception due to too high temperatures found in this study is unlikely to depend on this particular shortcoming. Seasonal precipitation over Scandi-navia is realistically simulated in IPSL CM4 with most pre-cipitation occurring in fall. The climate model has previously been used to simulate the last glacial inception and was val-idated against the available proxy data to qualitatively simu-late the transient warmth in the Nordic Seas at 115 ka (Bra-connot et al., 2008; Born et al., 2010a,b).
The climate model data is interpolated bilinearly from its original resolution of about 250 km over Scandinavia to the 40 km resolution of the ice sheet model grid. While this hor-izontal downscaling is invariable and has to be done only once, a vertical correction is carried out at each time step. The temperature data is corrected for the vertical difference between the climate model elevation and the time-dependent elevation of the ice sheet model using a fixed lapse rate of
−6.5◦C km−1. This approach both corrects for an unrealis-tical climate model topography and ensures that an evolving
1 2 3 4 5 6 7 8 9 10 11 12 1.5 1.75 2 2.25 2.5 Precipitation (mm/day) Time (month)
Fig. 1.Left:Difference in annual average surface air temperature, preindustrial control climate
minus ERA-40 climatology, in◦C (colors). Contours show the annual average 50% sea ice
edge for the simulation (solid) and ERA-40 (dotted). Right:Monthly average precipitation on
land over Scandinavia (red box Fig. 4) for the IPSL CM4 preindustrial control experiment (black) and the ERA-40 climatology (red).
18
Fig. 1. Left: difference in annual average surface air tempera-ture, preindustrial control climate minus ERA-40 climatology, in ◦C (colors). Contours show the annual average 50% sea ice edge for the simulation (solid) and ERA-40 (dotted). Right: monthly av-erage precipitation on land over Scandinavia (red box Fig. 4) for the IPSL CM4 preindustrial control experiment (black) and the ERA-40 climatology (red).
ice topography is reflected in changing surface temperatures that are initially invariant in the climate model. The precipi-tation data is not corrected for elevation changes.
In addition to the coupled model experiments, we carried out a series of sensitivity experiments using only the atmo-sphere component of the model (LMDZ 3.3) with modified sea surface conditions taken from the coupled model equi-librium. In order to investigate the effect of weaker oceanic heat transport, sea surface temperatures in the Arctic Ocean, Nordic Seas and North Atlantic were decreased by fixed val-ues of 1, 2, 3 and 4◦C. This area of imposed cooling is bounded by land on all sides except in the North Atlantic where it extends to 50◦N. In order not to create an artificially sharp sea surface temperature contrast in the open ocean, the anomaly has been smoothed meridionally over three atmo-spheric grid boxes. Sea ice area was adjusted accordingly, increasing coverage linerarly from 0 % at 0◦C water tem-perature to 100 % at −1.8◦C. The simulations were run into quasi-equilibrium for 20 years.
3 Glacial inception over Scandinavia and ocean heat transport
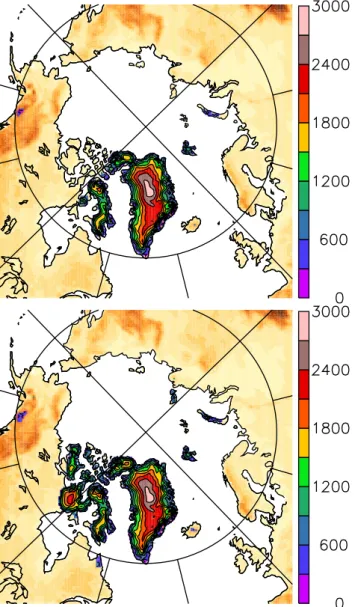
Forcing the ice sheet model with fixed 115 ka boundary conditions from the coupled climate model yields addi-tional ice growth compared to a preindustrial control exper-iment (Fig. 2). Ice grows on northern continental Canada, Labrador, the Canadian Archipelago and western Siberia. Ice caps on Iceland and Baffin Island are larger than in the prein-dustrial control. However, the Scandinavian peninsula re-mains ice-free. Present-day ice caps in Scandinavia are be-low model resolution and thus not simulated.
Mass balance variability of extra-tropical glaciers is usu-ally controlled by changes in ablation due to anomalous summer temperatures. Ice melting is a highly non-linear function of temperature and easily exceeds accumulation
Fig. 2. Modelled ice thickness (in m) for present day (upper) and 115 ka (lower). Preindustrial ice area and thickness are well repro-duced. Besides the Greenland ice sheet, smaller ice caps are visi-ble in the Canadian Arctic, Spitsbergen, Iceland, Novaya Zemlya, and south eastern Alaska. Most important differences with 115 ka forcing is additinal ice growth in northern continental Canada, Labrador, western Siberia and the Eurasian Arctic islands.
once a threshold in temperature is reached. Typical vari-ability in accumulation is smaller in all but the most marine climates, as has been shown for glaciers in southern Nor-way (Nesje and Dahl, 2000). In order to investigate further the robustness of an ice-free Scandinavia in a relatively cold 115 ka climate, the ice sheet model is forced by a composite climate based on the 40 years (10%) with coldest summers (April to September) over Scandinavia of the last 400 years of the coupled model experiment. Mass balance in the moun-tains of Scandinavia is close to positive under these con-ditions (Fig. 3). However, this is not sufficient to start ice accumulation.
Fig. 3. Upper: mass balance of the 115 ka control experiment, forced by a 100 year average of the climate model, in m yr−1. Lower: as above, but forced by an average of the 40 years of coldest summers over Scandinavia in the same model experiment (see Fig. 4).
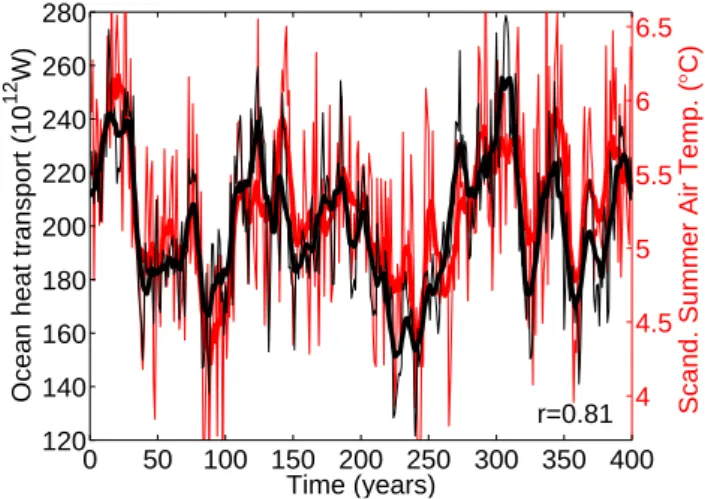
Although the temperature criterion was defined over land (see red box in Fig. 4), the temperature difference between the 40 years of warmest and coldest summers extends over the ocean tracing the sea ice edge. This suggests that sea ice and ocean heat transport into the Nordic Seas play an impor-tant role for decadal variability over Scandinavia at 115 ka. Indeed, the correlation of air temperature over Scandinavia and ocean heat transport across the Greenland Scotland ridge is high and significant with a coefficient r = 0.81 (Fig. 5). This maximum correlation is found for ocean heat trans-port leading by 1 year. The amplitude of surface air tem-perature variability over Scandinavia is about 1 K. A simi-lar correlation (r = 0.77) is found in the preindustrial control experiment, but with no lag.
A. Born et al.: Warm Nordic Seas delayed glacial inception in Scandinavia 821
Fig. 4. Difference in annual average surface air temperature, 40 years of coldest minus 40 years of warmest summers, in◦C (colors). Contours show the annual average 50% sea ice edge for the years of coldest (solid) and warmest (dotted) summers. Red box shows region where summer surface air temperature over land is taken as selection criterion.
4 How much sea surface cooling is needed to start Scandinavian glaciation?
Despite low insolation levels at 115 ka and ice growth at similar latitudes over North America and Siberia, climate is too warm over Scandinavia to support ice growth (Fig. 2). This result is robust and no ice grows even in years with cold summers. Ocean heat transport, probably through its impact on the sea ice edge, plays an important role for surface air temperature and land ice growth over Scandinavia (Fig. 5).
A series of experiments with artificially lowered sea sur-face temperatures in the North Atlantic, Nordic Seas and Arctic Ocean was carried out with the atmosphere model of IPSL CM4 only. Sea ice area was extended according to the modified temperatures (Figs. 6 and 7 upper). Although the temperature perturbation only concerns the sea surface, the magnitude of change in Scandinavian surface air tempera-tures is approximately the same as over the adjacent seas. Larger air temperature changes are observed in regions with additional sea ice. The lower sea surface conditions decrease evaporation and thus precipitation in the Arctic. The change in Scandinavian winter precipitation is amplified by a change in atmospheric dynamics, consisting in a southward shifting of the Icelandic low and thus redirecting precipitation from northern to western Europe (Fig. 7 lower).
At a reduction of 3◦C relative to the 115 ka coupled model experiment, a permanent ice cap develops over southern Nor-way, approximately at the location of present-day Jostedals-breen glacier (Fig. 6). For sea surface temperatures 4◦C
be-4 4.5 5 5.5 6 6.5
Scand. Summer Air Temp. (
° C) 0 50 100 150 200 250 300 350 400 120 140 160 180 200 220 240 260 280
Ocean heat transport (10
12
W)
Time (years)
r=0.81
Fig. 5. Time series of ocean heat transport into the Nordic Seas (black) and Scandinavian
summer surface air temperature (red, see red box in Fig. 4), both filtered with a 11 years running average. Thin lines show unfiltered time series. Curves correlate with r=0.81 and ocean heat transport leads by one year.
22
Fig. 5. Time series of ocean heat transport into the Nordic Seas (black) and Scandinavian summer surface air temperature (red, see red box in Fig. 4), both filtered with a 11 years running average. Thin lines show unfiltered time series. Curves correlate with r = 0.81 and ocean heat transport leads by one year.
low the coupled model average for 115 ka, ice grows over northern Norway. Ice caps grow also outside Scandinavia, most notably on the islands in the Barents and Kara Seas and in western and far-eastern continental Siberia.
These results show that sea surface temperatures have a strong impact on the mass balance in Scandinavia. However, the fact that the mass balance is positive when sea surface temperatures are low is not trivial. In addition to more favor-able conditions due to generally colder climate and weaker ablation, a cold sea surface also reduces moisture supply and accumulation (Fig. 7 lower). In the experiments presented here, the ablation effect dominates the mass balance change in most regions, especially over Southern Scandinavia and the Northern British Isles, where synoptic weather systems carry heat taken up from the Atlantic Ocean (Fig. 8). How-ever, despite large changes, the mass balance remains nega-tive in most regions.
The effect of the colder sea surface and larger sea ice area on accumulation is limited to coastal regions, most notably southeast Greenland and to some extent western Scandinavia (Fig. 8, lower). Changes in accumulation are about an order of magnitude weaker than changes in ablation and dominate exclusively in already glaciated areas of the unperturbed ex-periment (see Fig. 2). In these regions, summer temperatures are cold enough such that less snow melts in summer than accumulates in winter. Consequently, lower accumulation impacts the annual mass balance. In regions where summer melting exceeds accumulation, a small change in accumula-tion is unlikely to result in a positive mass balance because melting rates are usually much larger than accumulation.
Fig. 6. Ice thickness for experiments with sea surface temperatures reduced by 3◦C (upper) and 4◦C (lower) from the coupled model 115 ka average, in m. The 50% annual average sea ice extent is shown for the respective experiment (thick contour) and the unper-turbed 115 ka experiment (thin contour). With 3◦C colder sea sur-face, ice starts to grow in the region of present-day Jostedalsbreen in southern Norway. Cooling the sea surface by 4◦C allows additional ice growth over northern Scandinavia.
5 Discussion
Combining results from a comprehensive coupled climate model and a three-dimensional land ice model, ice growth at the end of the last interglacial was investigated. Simulated ice nucleation regions at 115 ka include the Canadian Arctic, Labrador and Siberian islands, in good agreement with re-constructions (Clark et al., 1993; Svendsen et al., 2004). In particular, glacier advances from Siberian islands were found to be important for the build-up of the Kara Sea ice sheet (M¨oller et al., 2007).
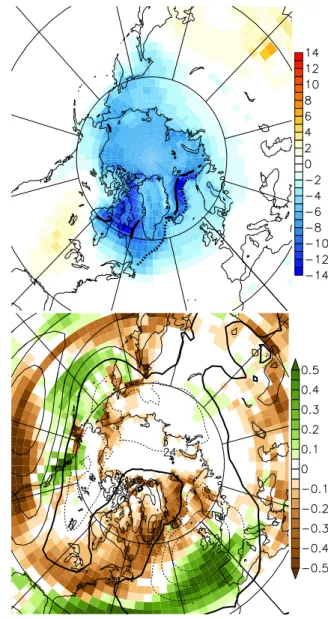
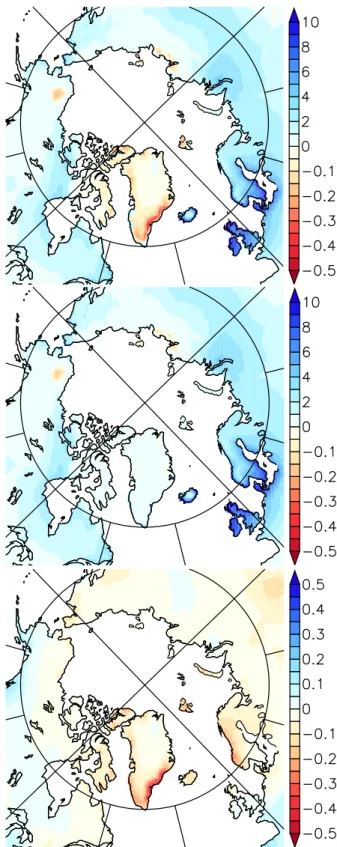
Fig. 7. Upper:Difference in annual average surface air temperature between the experiment
with 3◦C lower sea surface temperatures and the unperturbed 115 ka simulation (shading, in
◦C). Annual average 50% sea ice extent is shown as contours for the unperturbed 115 ka
ex-periment (solid) and with reduced sea surface temperatures (dashed). Surface air temperature
differences much larger than the 3◦C reduction of the sea surface are found along the sea ice
edge. Scandinavian temperature changes are similar to the sea surface. Lower:Total winter
precipitation (DJF, shading, in m/yr) decreases throughout the Arctic as a result of lower sea surface temperatures and a larger sea ice area. Precipitation over Scandinavia also decreases due to a change in atmospheric circulation seen as a negative anomaly in DJF sea level pres-sure (contour interval 2 hPa, negative dashed). This results in a southward shift of the Atlantic storm track and more precipitation in the Bay of Biscay region.
24
Fig. 7. Upper: difference in annual average surface air temperature between the experiment with 3◦C lower sea surface temperatures and the unperturbed 115 ka simulation (shading, in◦C). Annual av-erage 50% sea ice extent is shown as contours for the unperturbed 115 ka experiment (solid) and with reduced sea surface tempera-tures (dashed). Surface air temperature differences much larger than the 3◦C reduction of the sea surface are found along the sea ice edge. Scandinavian temperature changes are similar to the sea surface. Lower: total winter precipitation (DJF, shading, in m yr−1) decreases throughout the Arctic as a result of lower sea surface tem-peratures and a larger sea ice area. Precipitation over Scandinavia also decreases due to a change in atmospheric circulation seen as a negative anomaly in DJF sea level pressure (contour interval 2 hPa, negative dashed). This results in a southward shift of the Atlantic storm track and more precipitation in the Bay of Biscay region.
No ice is found over Scandinavia with 115 ka climate forc-ing. Even when forcing the ice model only with years of par-ticularly cold summers, ice did not accumulate. However,
A. Born et al.: Warm Nordic Seas delayed glacial inception in Scandinavia 823 ice accumulation was found sensitive to ocean heat transport
into the Nordic Seas (Fig. 5). This implies a relation between sea surface temperature and Scandinavian mass balance that can be used to help constrain the timing of the last glacial inception with high-resolution marine proxy data. Avail-able terrestrial data for Scandinavia has much lower tempo-ral resolution. Sea surface temperatures of the Nordic Seas need to cool by at least 3◦C from the 115 ka average for in-ception over southern Scandinavia. A 4◦C cooling induces ice growth over northern Scandinavia. Cooling also has a positive effect on other known nucleation sites like western Siberia, the Siberian islands and Beringia (Brigham-Grette, 2001; Brigham-Grette et al., 2001; Svendsen et al., 2004).
As shown by proxy data and models, strong ocean heat transport into the Nordic Seas between 119 ka and 115 ka was important for climate evolution of the last glacial incep-tion (Risebrobakken et al., 2007; Born et al., 2010b). The cli-mate model used in this study was validated against the avail-able proxy data to simulate this feature (Born et al., 2010a).
Layers of ice-rafted detritus, particles too big to be trans-ported other than by icebergs detached from ice sheets, are found in marine sediments of the Nordic Seas following a period of relatively warm conditions and immediately after a 3◦C drop in sea surface temperatures off the central Norwe-gian coast at 115 ka (Baumann et al., 1995; Risebrobakken et al., 2005, 2007), in good agreement with simulations pre-sented here. Other sources of ice-rafted detritus besides Scandinavia cannot be excluded but are highly unlikely. Cli-mate was still relatively warm so that icebergs from Green-land or even the young Laurentide ice sheet would not have reached the eastern Nordic Seas. Rapid ice growth on Scan-dinavia is also supported by terrestrial data from southwest-ern Scandinavia (Mangerud et al., 1981; Mangerud, 1991, 2004). However, the ice sheet model suggests that a larger temperature decrease is necessary to induce ice growth in northern Scandinavia. This is consistent with reconstructions from speleothems in this region that suggest significant ice growth only after 95 ka (Lauritzen, 1984, 1986).
Numerous studies of the last glacial cycle show that the large ice sheets of the glacial maximum nucleated over North America and western Siberia (Marshall and Clarke, 1999; Siegert et al., 2001; Zweck and Huybrechts, 2005; Calov et al., 2005a; Kubatzki et al., 2006; Charbit et al., 2007; Peyaud et al., 2007). Glacier advance over Scandinavia early during the last glacial cycle is regarded as of sec-ondary importance to the continental-scale glaciation. How-ever, the mechanism presented here, a rapid glacier advance over Scandinavia at 115 ka, is consistent with this previ-ous work. Decreasing heat transport into the Nordic Seas at 115 ka might also influence the primary nucleation sites around the Barents and Kara Seas and thereby the evolution of the Eurasian ice sheet later during the glacial.
While the climate model simulations have been discussed extensively in earlier publications (Braconnot et al., 2008; Born et al., 2010a,b), several aspects of the ice sheet model
Fig. 8. Mass balance difference (m yr−1) between atmosphere only experiment with 3◦C lower sea surface temperatures and the con-trol run (upper), decomposed into melt (middle) and precipitation differences (lower). Lower sea surface temperatures strongly facili-tate ice growth in most regions by decreasing melting. The negative effect of weaker moisture supply is limited and dominates over melt only in areas that are already glaciated in the unperturbed 115 ka ex-periment. Note the different scale in the lower panel.
need clarification here. Relatively large glaciers are present in Scandinavia today, but are not shown in the control experiment (Fig. 2). This is because the model resolution of 40 km is too coarse to resolve these glaciers. Resolution can become critical for the representation of ice masses in areas of steep topography, because glacier nucleation often occurs on the highest peaks and propagates to lower eleva-tions. It has been proposed to parameterize this effect by calculating the mass balance at the highest present day el-evation within each grid cell if it is higher than the simu-lated ice sheet (Zweck and Huybrechts, 2005). While this approach preserves information that would otherwise be lost due to averaging the topography over the grid size, it ne-glects the effect of steep topographic gradients of sub-grid scale. Steep slopes typically accompany the occurrence of high peaks and limit the spatial extent of glaciers originat-ing from high elevations. Ice is quickly transported to lower elevations and thus effectively removed. Accounting for the full sub-grid height distribution, including the presence of deep valleys and fjords, requires a more sophisticated ap-proach and a parametrization of alpine glaciers (Marshall and Clarke, 1999). This, however, is beyond the scope of the present study. We acknowledge that the finite model resolu-tion might impact the findings presented here quantitatively but not qualitatively.
The shallow ice approximation employed in our model inhibits the simulation of floating ice shelves that are be-lieved to have played a significant role for the evolution of the Eurasian ice sheet as ice grew across the Barents and Kara Seas. However, the first glaciation of Scandi-navia was the result of local accumulation of ice and the re-sults presented here are thus not affected by the limitation to grounded ice. The offline coupling scheme used does not communicate elevation and albedo changes back to the cli-mate model and thus neglects potentially important feedback mechanisms (Kageyama et al., 2004). However, simulated elevation changes are small due to limited ice accumulation. Albedo changes are minor because accumulation regions of the ice sheet model are already covered with snow in the cli-mate model.
6 Conclusions
Our modeling results are in good agreement with proxy data and the main findings are:
(a) Strong ocean heat transport into the Nordic Seas be-tween 119 ka and 115 ka delayed large scale ice growth over Scandinavia.
(b) Scandinavian glacial inception requires a 3◦C drop in sea surface temperatures, in good agreement with ma-rine and terrestrial proxy data.
(c) The positive effect of strong oceanic heat transport on ablation dominates the positive effect of enhanced evap-oration from the warm ocean surface.
(d) At inception, ice first started growing in the high moun-tains of Southern Scandinavia rather than in northern Scandinavia.
Acknowledgements. We kindly acknowledge Pascale Braconnot for access to IPSL CM4 model output as well as Jan Mangerud and John-Inge Svendsen for insightful discussions. We also appreciate helpful comments by two anonymous reviewers. A. B. was funded by the Marie Curie Actions project NICE (MRTN-CT-2006-036127) and the Research Council of Norway project TOPPNICE. M. K. is supported by INSU-CNRS. Computer time was provided by the University of Bergen and CEA-CCRT. ECMWF ERA-40 data used in this study have been provided by ECMWF. This is publication no. A298 from the Bjerknes Centre for Climate Research.
Edited by: V. Brovkin
References
Andrews, J. T. and Barry, R. G.: GLACIAL INCEPTION AND DISINTEGRATION DURING LAST GLACIATION, Annu. Rev. Earth Pl. Sc., 6, 205–228, 1978.
Baumann, K.-H., Lackschewitz, K. S., Mangerud, J., Spielhagen, R. F., Wolf-Welling, T. C. W., Henrich, R., and Kassens, H.: Re-flection of Scandinavia ice sheet fluctuations in Norwegian Sea sediments during the last 150 000 years, Quaternary Res., 43, 185–197, 1995.
Born, A., Nisancioglu, K. H., and Braconnot, P.: Sea ice induced changes in ocean circulation during the Eemian, Clim. Dynam., online, doi:10.1007/s00382-009-0709-2, 2010a.
Born, A., Nisancioglu, K. H., and Risebrobakken, B.: Late Eemian warming in the Nordic Seas as seen in proxy data and climate models, Paleoceanography, in revision, 2010b.
Braconnot, P., Marzin, C., Gr´egoire, L., Mosquet, E., and Marti, O.: Monsoon response to changes in Earth’s orbital parame-ters: comparisons between simulations of the Eemian and of the Holocene, Clim. Past, 4, 281–294, doi:10.5194/cp-4-281-2008, 2008.
Brigham-Grette, J.: New perspectives on Beringian Quaternary pa-leogeography, stratigraphy, and glacial history, Quaternary Sci. Rev., 20, 15–24, 2001.
Brigham-Grette, J., Hopkins, D. M., Benson, S. L., Heiser, P., Ivanov, V. F., Basilyan, A., and Pushkar, V.: Last Interglacial (isotope stage 5) glacial and sea-level history of coastal Chukotka Peninsula and St. Lawrence Island, Western Beringia, Quater-nary Sci. Rev., 20, 419–436, 2001.
Calov, R. and Greve, R.: A semi-analytical solution for the posi-tive degree-day model with stochastic temperature variations, J. Glaciol., 51, 173–175, 2005.
Calov, R., Ganopolski, A., Claussen, M., Petoukhov, V., and Greve, R.: Transient simulation of the last glacial inception. Part I: glacial inception as a bifurcation in the climate system, Clim. Dynam., 24, 545–561, 2005a.
A. Born et al.: Warm Nordic Seas delayed glacial inception in Scandinavia 825
Calov, R., Ganopolski, A., Petoukhov, V., Claussen, M., Brovkin, V., and Kubatzki, C.: Transient simulation of the last glacial in-ception. Part II: sensitivity and feedback analysis, Clim. Dynam., 24, 563–576, 2005b.
Charbit, S., Ritz, C., Philippon, G., Peyaud, V., and Kageyama, M.: Numerical reconstructions of the Northern Hemisphere ice sheets through the last glacial-interglacial cycle, Clim. Past, 3, 15–37, doi:10.5194/cp-3-15-2007, 2007.
Clark, P. U., Clague, J. J., Curry, B. B., Dreimanis, A., Hicock, S. R., Miller, G. H., Berger, G. W., Eyles, N., Lamothe, M., Miller, B. B., Mott, R. J., Oldale, R. N., Stea, R. R., Szabo, J. P., Thorleifson, L. H., and Vincent, J.-S.: Initiation and develop-ment of the Laurentide and Cordilleran Ice Sheets following the last interglaciation, Quaternary Sci. Rev., 12, 79–114, 1993. Fichefet, T. and Maqueda, M. A. M.: Sensitivity of a global sea ice
model to the treatment of ice thermodynamics and dynamics, J. Geophys. Res., 102, 12609–12646, 1997.
Fichefet, T. and Maqueda, M. A. M.: Modelling the influence of snow accumulation and snow-ice formation on the seasonal cycle of the Antarctic sea-ice cover, Clim. Dynam., 15, 251–268, 1999. Greve, R.: A continuum-mechanical formulation for shallow poly-thermal ice sheets, Philos. Trans. R. Soc. Lond. A, 355, 921–974, 1997.
Hourdin, F., Musat, I., Bony, S., Braconnot, P., Codron, F., Dufresne, J., Fairhead, L., Filiberti, M., Friedlingstein, P., Grand-peix, J., Krinner, G., Levan, P., Li, Z., and Lott, F.: The LMDZ4 general circulation model: climate performance and sensitivity to parametrized physics with emphasis on tropical convection, Clim. Dynam., 27(7–8), 787–813, 2006.
Kageyama, M., Charbit, S., Ritz, C., Khodri, M., and Ramstein, G.: Quantifying ice-sheet feedbacks during the last glacial inception, Geophys. Res. Lett., 31, L24203, doi:10.1029/2004GL021339, 2004.
Kubatzki, C., Claussen, M., Calov, R., and Ganopolski, A.: Sensi-tivity of the last glacial inception to initial and surface conditions, Clim. Dynam., 27, 333–344, 2006.
Lambeck, K. and Chappell, J.: Sea Level Change Through the Last Glacial Cycle, Science, 292, 679–686, 2001.
Lambeck, K., Purcell, A., Funder, S., Kjær, K. H., Larsen, E., and M¨oller, P.: Constraints on the Late Saalian to early Middle We-ichselian ice sheet of Eurasia from field data and rebound mod-elling, Boreas, 35, 539–575, 2006.
Lauritzen, S. E.: Speleothem dating in Norway: An interglacial chronology, Norsk geografisk tidsskrift, 38, p. 198, 1984. Lauritzen, S. E.: Karstformer i Nordland, Tech. rep., Direktoratet
for Naturforvaltning, Oslo, 1986.
Mangerud, J.: The Scandinavian Ice Sheet through the last inter-glacial/glacial cycle, in: Frenzel, B.: Klimageschichtliche Prob-leme der letzten 130 000 Jahre, P¨aleoklimaforschung, 1, 307– 330, 1991.
Mangerud, J.: Ice sheet limits on Norway and the Norwegian con-tinental shelf. in: Quaternary Glaciations – Extent and Chronol-ogy, edited by: Ehlers, J. and Gibbard, P.: Vol. 1 Europe, 271– 294, Elsevier, Amsterdam, 2004.
Mangerud, J. and Svendsen, J.-I.: THE LAST INTERGLACIAL-GLACIAL PERIOD ON SPITSBERGEN, SVALBARD, Quater-nary Sci. Rev., 11, 633–664, 1992.
Mangerud, J., Sønstegaard, E., Sejrup, H.-P., and Haldorsen, S.: A continuous Eemian-Early Weichelian sequence containing pollen
and marine fossils at Fjøsanger, western Norway, Boreas, 10, 138–205, 1981.
Marshall, S. J. and Clarke, G. K. C.: Ice sheet inception: subgrid hypsometric parameterization of mass balance in an ice sheet model, Clim. Dynam., 15, 533–550, 1999.
Marti, O., Braconnot, P., Dufresne, J.-L., Bellier, J., Benshila, R., Bony, S., Brockmann, P., Cadule, P., Caubel, A., Codron, F., de Noblet, N., Denvil, S., Fairhead, L., Fichefet, T., Foujols, M.-A., Friedlingstein, P., Goosse, H., Grandpeix, J.-Y., Guilyardi, E., Hourdin, F., Idelkadi, A., Kageyama, M., Krinner, G., L´evy, C., Madec, G., Mignot, J., Musat, I., Swingedouw, D., and Ta-landier, C.: Key features of the IPSL ocean atmosphere model and its sensitivity to atmospheric resolution, Clim. Dynam., 34, 1–26, doi:10.1007/s00382-009-0640-6, 2010.
McManus, J. F., Oppo, D. W., Keigwin, L. D., Cullen, J. L., and Bond, G. C.: Thermohaline Circulation and Prolonged Inter-glacial Warmth in the North Atlantic, Quaternary Res., 58, 17– 21, 2002.
M¨oller, P., Lubinski, D., Ing´olfsson, O., Forman, S. L., Siedenkrantz, M.-S., Bolshiyanov, D. Y., Lokrantz, H., Antonov, O., Pavlov, M., Ljung, K., Zeeberg, J. J., and Andreev, A.: Erra-tum to: Severnaya Zemlya, Arctic Russia: a nucleation area for Kara Sea ice sheets during the Middle to Late Quaternary: [Qua-ternary Sci. Rev., 25(21–22), 2894–2936, 2006], Qua[Qua-ternary Sci. Rev., 26, 1149–1191, 2007.
Nesje, A. and Dahl, S. O.: Glaciers and Environmental Change, Arnold, London, 2000.
NOAA, National Geophysical Data Center: Data Announcement 88-MGG-02, Digital relief of the Surface of the Earth, Tech. rep., Boulder, Colorado, 1988.
Peltier, W.: GLOBAL GLACIAL ISOSTASY AND THE SUR-FACE OF THE ICE-AGE EARTH: The ICE-5G (VM2) Model and GRACE, Annual Review of Earth and Plan-etary Sciences, 32, 111–149, doi:10.1146/annurev.earth.32. 082503.144359, http://arjournals.annualreviews.org/doi/abs/10. 1146/annurev.earth.32.082503.144359, 2004.
Peyaud, V., Ritz, C., and Krinner, G.: Modelling the Early We-ichselian Eurasian Ice Sheets: role of ice shelves and influence of ice-dammed lakes, Clim. Past, 3, 375–386, doi:10.5194/cp-3-375-2007, 2007.
Reeh, N.: Parameterization of melt rate and surface temperature on the Greenland Ice Sheet, Polarforschung, 59, 113–128, 1991. Risebrobakken, B., Dokken, T., and Jansen, E.: The extent and
vari-ability of the Meridional Atlantic Circulation in the Nordic Seas during Marine Isotope Stage 5 and its influence on the inception of the last glacial, in: The Nordic Seas: an Integrated Perspec-tive, edited by: Drange, H., Dokken, T., Furevik, T., Gerdes, R., Berger, W. H., 323–339, AGU Geophysical Monograph Series no. 158, Washington DC, 2005.
Risebrobakken, B., Dokken, T., Otter˚a, O. H., Jansen, E., Gao, Y., and Drange, H.: Inception of the Northern European ice sheet due to contrasting ocean and insolation forcing, Quaternary Res., 67, 128–135, 2007.
Ruddiman, W. F. and McIntyre, A.: Warmth of the Subpolar North Atlantic Ocean During Northern Hemisphere Ice-Sheet Growth, Science, 204, 173–175, 1975.
Siegert, M. J., Dowdeswell, J. A., Hald, M., and Svendsen, J.-I.: Modelling the Eurasian Ice Sheet through a full (Weichselian) glacial cycle, Global Planet. Change, 31, 367–385, 2001.
Svendsen, J. I., Alexanderson, H., Astakhov, V. I., Demidov, I., Dowdeswell, J. A., Funder, S., Gataullin, V., Henriksen, M., Hjort, C., Houmark-Nielsen, M., Hubberten, H. W., Ingolfs-son, O., JakobsIngolfs-son, M., Kjaer, K. H., Larsen, E., Lokrantz, H., Lunkka, J. P., Lysa, A., Mangerud, J., Matiouchkov, A., Murray, A., Moller, P., Niessen, F., Nikolskaya, O., Polyak, L., Saarnisto, M., Siegert, C., Siegert, M. J., Spielhagen, R. F., and Stein, R.: Late quaternary ice sheet history of northern Eurasia, Quaternary Sci. Rev., 23, 1229–1271, doi:10.1016/j.quascirev.2003.12.008, 2004.
Uppala, S. M., K˚allberg, P. W., Simmons, A. J., Andrae, U., Bech-told, V. D. C., Fiorino, M., Gibson, J. K., Haseler, J., Hernandez, A., Kelly, G. A., Li, X., Onogi, K., Saarinen, S., Sokka, N., Al-lan, R. P., Andersson, E., Arpe, K., Balmaseda, M. A., Beljaars, A. C. M., Berg, L. V. D., Bidlot, J., Bormann, N., Caires, S., Chevallier, F., Dethof, A., Dragosavac, M., Fisher, M., Fuentes, M., Hagemann, S., H´olm, E., Hoskins, B. J., Isaksen, L., Janssen, P. A. E. M., Jenne, R., Mcnally, A. P., Mahfouf, J.-F., Morcrette, J.-J., Rayner, N. A., Saunders, R. W., Simon, P., Sterl, A., Tren-berth, K. E., Untch, A., Vasiljevic, D., Viterbo, P., and Woollen, J.: The ERA-40 re-analysis, Q. J. Roy. Meteor. Soc., 131, 2961– 3012, 2005.
Waelbroeck, C., Labeyrie, L., Michel, E., Duplessy, J. C., Mc-Manus, J. F., Lambeck, K., Balbon, E., and Labracherie, M.: Sea-level and deep water temperature changes derived from ben-thic foraminifera isotopic records, Quaternary Sci. Rev., 21, 295– 305, 2002.
Zweck, C. and Huybrechts, P.: Modeling of the Northern Hemisphere ice sheets during the last glacial cycle and glaciological sensitivity, J. Geophys. Res., 110, D07103, doi:10.1029/2004JD005489, 2005.
![[PDF] Livre complet sur l’intelligence artificielle et python](data:image/gif;base64,R0lGODlhAQABAIAAAP///wAAACH5BAEAAAAALAAAAAABAAEAAAICRAEAOw==)