HAL Id: halshs-00962593
https://halshs.archives-ouvertes.fr/halshs-00962593
Preprint submitted on 21 Mar 2014
HAL is a multi-disciplinary open access archive for the deposit and dissemination of sci-entific research documents, whether they are pub-lished or not. The documents may come from teaching and research institutions in France or abroad, or from public or private research centers.
L’archive ouverte pluridisciplinaire HAL, est destinée au dépôt et à la diffusion de documents scientifiques de niveau recherche, publiés ou non, émanant des établissements d’enseignement et de recherche français ou étrangers, des laboratoires publics ou privés.
Export sophistication and economic growth: evidence
from China
Joachim Jarreau, Sandra Poncet
To cite this version:
Joachim Jarreau, Sandra Poncet. Export sophistication and economic growth: evidence from China. 2011. �halshs-00962593�
Export Sophistication and Economic Growth: evidence
from China
∗
Joachim Jarreau
†and Sandra Poncet
‡January 4, 2011
Abstract
We consider the effect of export sophistication on economic performance using re-gional variations within a single country (China) over the period 1997-2009. We confirm Hausmann, Hwang and Rodrik (2007)’s prediction that regions that specialize in more sophisticated goods subsequently grow faster. We find that at the province and prefecture level, there is substantial variation in export sophistication controlling for the level of de-velopment, and that this difference in turn matters for growth. Our results suggest that these gains are limited to ordinary export activities undertaken by domestic firms. No direct gains appear to derive from processing trade activities and from foreign firms even though they are the main contributors to the global upgrading of China’s exports. This finding suggests that the contribution of assembly trade and foreign entities must be dis-tinguished when one wants to measure the true improvement in the country’s technology level and its contribution to economic growth.
Keywords: Export sophistication, economic growth, processing trade, China. JEL classification: F1, O1, R1.
∗We thank the editor Eric Verhoogen and three anonymous referees for many valuable comments which
significantly improved the paper. We are grateful to Jean-Claude Berthélemy and seminar participants at the second joint economics research seminar of university of Fudan and university of Paris 1 Panthéon Sorbonne and at the RIEF 2010 seminar in Kiel, Germany for very helpful discussions and suggestions. We also thank the Cepremap, program ‘International Trade and Development’ for financial support.
†Paris School of Economics and CEPII; Email: [email protected]
‡Paris School of Economics - Université de Paris 1 Panthéon-Sorbonne and CEPII. Email:
1
Introduction
Since the early nineties, China has been integrating into world trade at an astounding pace. Chinese exports have more than quintupled between 1992 and 2007, faster than the growth rate of the economy. This has radically transformed the functioning of China’s economy, going from an isolated position with exports representing less than 10% of GDP in 1980 to a highly inte-grated one, with an export ratio of more than 37% in 2007. This process has been accompanied by a no less impressive diversification of China’s trade, as its manufactured exports pervaded all sectors of world trade, from low-technology textile to high tech electronics and computers.
Several aspects of China’s trade integration have been puzzling for economists. One of them is the rapid upgrading of China’s exports: economists (but also world consumers) have noticed since the mid-nineties the impressive broad range of China’s export products, and in particular, the ability of Chinese producers to export capital- and skill-intensive products, high technology products, and in general products that are usually found to belong to the area of specialization of more developed countries. Rodrik (2006) observes that China is an outlier in terms of the overall sophistication of its exports. Using the sophistication index of Hausmann, Hwang and Rodrik (2007), which estimates the average “income level of a country’s exports”, he finds that China’s export bundle is similar to that of a country with an income per-capita level three times higher than China. Relying on a different indicator, Schott (2007) also finds that China’s export bundle increasingly overlaps with that of the world’s most developed economies, and
that this overlap cannot be entirely explained by its factor endowments.1
Two related debates have emerged in the literature. The first one questions whether this discrepancy between China’s export structure and its level of development (sometimes named the “China-is-special” result) is an artefact due to improper measurement of export
sophistica-1
Refer also to Fontagné, Gaulier and Zignago (2007).
tion.2
The second asks if export upgrading, if any, has contributed to China’s real growth, and by how much. This paper relies on detailed trade data at the subnational level in China over the period 1997-2009 to empirically investigate these two related issues.
Some researchers have questioned whether there is anything really special about Chinese exports as claimed by Rodrik (2006) and Schott (2007). The importance of the processing trade regime3
in China’s export sector appears as a possible cause for an overvaluation of Chi-nese exports’ sophistication level, as many of the high technology goods exported by China are produced using labor-intensive processes and imported inputs. The observed level of so-phistication of such products thus reflects the technology embedded in imported inputs, and not an increased level of complexity or technology in the final assembly processes taking place in China. In addition, a big share of high technology exports are produced by partially or wholly foreign-owned firms (mainly operating in the assembly trade sector), which also brings up the question of whether the observed upgrading of Chinese exports signals a genuine adop-tion of technology at the local level (Lemoine and Ünal-Kesenci, 2006; Amiti and Freund, 2010; Wang and Wei, 2010; Lardy, 2005). Some statistics on China’s trade justify these concerns. In 2007, 54% of Chinese exports correspond to processing trade; this share rises to 85% for high technology exports. Foreign entities dominate these processing trade activities : in 2007, 82% of processing trade exports are made by foreign firms. This figure reaches 91% for high tech processing trade exports. Koopman, Wang and Wei (2008) who develop a general formula for computing domestic and foreign contents when processing trade exports are pervasive compute that the share of foreign value-added in China’s exports is at about 50%, much higher than most other countries.4
They also find that more sophisticated sectors such as electronic devices and telecommunication equipments have particularly high foreign content (about 80%). Yao (2009)
2
We thank an anonymous referee for pointing out the relevance of this literature.
3
The terms ‘processing’, or ‘assembly’, trade are used interchangeably to refer to the operations of firms importing inputs to assemble them in China and re-export them as finished products.
4
argues that once one takes into account China’s processing trade regime, Chinese exports no longer look very special compared to other countries with similar levels of development; a point also made by Van Assche and Gangnes (2010). In addition, these authors have also pointed that the uneven distribution of income levels, and of exports, across China’s provinces must be taken into account when estimating this ’China-is-special’ result. In China, the provinces that export the most, and the most sophisticated products, are also the richest; thus, there may not be much of a gap between income levels and export sophistication, once looking at province-level data (see e.g. Xu 2010).
The second and related issue is that of the contribution of export upgrading to China’s growth. Theoretically, it is linked to the question of whether reshaping the production struc-ture beyond the boundaries set by factor endowments (physical capital, human capital and natural resources) provides some benefits. According to the standard trade theory focusing on comparative advantages, the answer is clearly negative. An important theoretical litera-ture pertaining to endogenous growth has however proposed models going beyond the classical framework to show that the production structure is an important contributor to economic per-formance.5
These models focus on the process of learning and adoption of new technologies as a costly process. In this framework, beyond specializing in the sectors where its compar-ative advantage lies, an economy can reap additional gains by specializing in products with higher positive externalities. Policies favoring this discovery process, such as those encouraging technological learning and technology imports, can in this case lead to higher growth rates. Em-pirical validation of this has been recently provided by Hausmann, Hwang and Rodrik (2007). Based on cross-country panel regressions, they show that countries that acquire the capability to export a basket of more sophisticated products achieve higher growth rates, controlling for their initial income level and their factor endowments. They hence argue that “what a country
5
Refer among others to Stokey (1988), Young (1991), Aghion and Howitt (1998) and Hausmann, Hwang and Rodrik (2007).
exports matters”.
The issues of measuring China’s export upgrading, and of estimating the contribution of this process to real growth, are closely related. If indeed, as argued by many, this upgrading can be entirely attributed to the assembly sector, then one would expect the so-called “China is special” result to break down, once distinguishing between the processing and non-processing exports in the data. If, in addition, the sophistication level of China’s exports is accounted for by regional disparities in income levels, then one would expect measures of export sophistication to have no additional predictive power on real growth rates of provinces, after controlling for initial levels of income.
This paper relies on sub-national trade data differentiating between processing trade and ordinary (i.e. non-processing) trade, as well as between exports by domestic and foreign-owned firms, to contribute to the literature in three different ways.
First, we precisely estimate the upgrading of China’s exports by measuring separately export sophistication for ordinary and for processing trade transactions and for domestic and foreign firms6
. The decomposition of China’s export sophistication growth highlights that almost three quarters can be attributed to processing trade, in line with previous findings on the key role of processing trade in export upgrading (Lemoine and Ünal-Kesenci, 2006; Amiti and Freund, 2010; Wang and Wei, 2010). Virtually all of the processing trade contribution to China’s export sophistication come from foreign firms. We however find that the recent upgrading of China’s trade has also concerned domestic producers, especially their ordinary trade activities which account for the remaining quarter. The per capita income level associated to exports by domestic entities has increased by 15.5% between 1997 and 2007 to reach 12500$, similar to that of Lithuania, a country three times richer in PPP per capita terms than China. It remains
6
Here and in the rest of the article, we define “foreign firms” as including all firms with some foreign capital ownership, that is, wholly foreign-owned firms as well as joint ventures (this latter group covering several contractual forms: equity and non-equity joint ventures, and joint cooperatives).
however lower than that of foreign entities that has risen by 25.7% over the period to reach 15776$, similar to the income level associated to the export bundle of Great Britain, a country seven times richer in PPP per capita terms than China.
Second, we estimate the relationship between export sophistication and real growth in China. Since we rely on regional variations within a single country (China), our study thus provides a test of Hausmann, Hwang and Rodrik (2007)’s model relating production structure to economic growth, with the advantage that, by comparing China’s provinces, we are able to mitigate issues of omitted variables associated to different legal and institutional systems likely to arise in cross-country studies. We find that the empirical patterns found by Hausmann, Hwang and Rodrik (2007) to hold across countries also hold across regions within China. Our results confirm the relevance of Hausmann, Hwang and Rodrik (2007)’s approach in the Chinese context: regions that specialize in sophisticated goods grow subsequently faster. They moreover contrast with Yao (2009) and Xu (2007)’s lines of criticism by showing that, even at the sub-national level, there is substantial variation in export sophistication, controlling for the level of income, and that this difference in turn matters for growth. Our results indicate that our story relating export sophistication and growth is robust to a number of sensitivity checks and is not restricted to locations that export a lot.
Third, we investigate whether the relationship between export sophistication and income per capita growth depends on the trade regime (processing or ordinary), and on the ownership type (domestic or foreign) of the firms exporting these products. We find that export sophistication in the assembly sector has no direct predictive power on real growth. This confirms that export upgrading in this sector must not be taken as signalling a process of technological adoption in China, but rather as an artefact due to China’s participation to the increasing fragmentation of production processes. This finding suggests that the contribution of assembly exports to the upgrading of China’s exports must be put aside when one wants to measure the true
improvement in the country’s technology level.
More interestingly, we find that growth enhancing gains are limited to ordinary export activities undertaken by domestic entities. No additional direct benefits are found from foreign exporters upgrading, either in assembly or ordinary exports. This appears to have interesting implications in the Chinese case. The country has adopted, starting in the early 1980s, a policy of opening to foreign investment, precisely in the hope that technological capabilities and management practices would spillover and enable the country to increase its productivity and export performance and sustain high growth rates. These policies were believed by many to be the key factor explaining both China’s high-end export structure and rapid growth (Rodrik, 2006). In contrast, we find that, even though foreign producers are the main contributors to export upgrading, foreign sophistication appears to have little association with subsequent growth. In terms of policy implications, these results thus suggest that policies designed to promote innovation by local entrepreneurs are more efficient to support the development process than FDI promotion.
The rest of this article is organized as follows. In Section 2, we present our measure of export sophistication and the dataset used and we describe the recent evolution of China’s export sophistication. Section 3 presents our empirical approach and discusses our results. Section 4 concludes.
2
Evolution of China’s trade structure
2.1
Measuring export sophistication
We rely on Hausmann, Hwang and Rodrik (2007)’s measure of the sophistication of a country’s export basket, obtained by comparing it with the income level of countries with similar export structures. This measure assumes that each good k that a country can potentially produce and
export has an intrinsic level of sophistication7
associated to it, P RODYk, that is the weighted
average of the income levels of this good k ’s exporters, where the weights correspond to the
revealed comparative advantage of each country j in good k:8
P RODYk = 1 Ck X j xjk Xj × Yj, (1)
where xjk is the value of exports of good k by country j, Xj is the total value of country
j’s exports and Yj is the per capita level of income of country j, measured as the real GDP per
capita, in PPP. Ck is a normalization term used to have the coefficients sum to 1. The bigger
share a given good k weighs in the exports of rich countries, the higher its P RODY , the more sophisticated it is.
The purpose of this measure is to avoid determining directly the intrinsic features (the tech-nology embedded in it, the levels of specialized skills required to produce it, R&D investments, etc.) that make a product sophisticated. Instead, it infers, from observed patterns of trade, which products require a high level of development to export.
The sophistication level associated with a country j’s export bundle, noted EXP Yj, is then
computed as the average level of sophistication of its export basket. It is the weighted sum
of the sophistication levels associated to each exported good k, P RODYk, with the weights
being the shares of each good in the country’s total exports. It thus measures the degree of
specialization of a country in high-P RODY goods9
. EXP Yjt = X k xjkt Xjt P RODYk (2) 7
While Hausmann, Hwang and Rodrik (2007) use the word “productivity” to describe sophistication at the good level, we prefer terms like sophistication, high quality or technological advancement.
8
The numerator of the weight, xjk/Xj, is the value-share of the commodity in the country j’s overall export
basket while the denominator of the weight, Ck=
P
j(xjk/Xj), aggregates the value-shares across all countries
exporting the good.
9
Or, equivalently, the similarity of a given export basket with that of the most developed countries.
Measures of product-level sophistication P RODY are computed for the year 199710
using the BACI world trade dataset.11
This dataset, which is constructed using COMTRADE original data, provides bilateral trade flows at the 6-digit product level (Gaulier and Zignago, 2010).12
In the rest of the paper, we will successively construct the index EXP Y for the export bas-kets of China, of its international partners and of Chinese localities (provinces and prefectures) based on Equation 2. Our main source for this study is the Chinese customs data, which report
region-level exports and imports by 6-digit product over the period 1997-2007.13
A feature of interest to us in this dataset is that it allows to differentiate between domestic and foreign
trading firms, and between processing trade and ordinary trade.14
Hausmann, Hwang and Rodrik (2007)’s measure of the sophistication EXP Y has been criticized on several grounds. Is has been argued to be sensitive to the size of the country (Kumakura, 2007) and the choice of product nomenclature (Yao, 2009). Given these weaknesses, we will use an alternative measure of sophistication to verify that our results on the positive association between export sophistication and subsequent growth are robust. We will compute the share of high technology manufactures in total exports. The identification of high technology products is based on Lall (2000)’s classification of products by technological level. The two measures of export sophistication are closely related as can be seen in Figure 4 in the Appendix. The coefficient of correlation between EXP Y and the share of high tech products in exports
10
The PRODY indicator is thus calculated with 1997 as reference year, the first year of our sample. This approach reduces the likelihood of a bias in the index. First, it is important to use a consistent sample of countries since non-reporting is likely to be correlated with income, and thus, constructing PRODY for different countries during different years could introduce serious bias into the index. Also, the choice of the year 1997 helps ensure that the index is not affected by the uprising of China in international trade (or by any other evolution of world trade structure over the period).
11
BACI is downloadable from http://www.cepii.fr/anglaisgraph/bdd/baci.htm. World countries real GDP per capita in PPP are taken from the World Development Indicators database (World Bank).
12
It is developed using an original procedure that reconciles the declarations of the exporter and the importer. The harmonization procedure enables to extend considerably the number of countries for which trade data are available, as compared to the original dataset.
13
To compute the EXP Y index for China’s trade, the Chinese customs data were converted into the 1992 Harmonized system (HS) classification to match the 1992 classification used in the BACI dataset.
14
The data also refers to a third (“Others”) category that groups other flows such as aid, border trade and consignment, representing overall less than 1% of total trade value in each year. When considering the processing/ordinary trade distinction, this category is dropped.
across Chinese provinces is 61.2% in 1997. It varies between 55.1% and 80.3% depending on the year of our sample.
2.2
China’s export sophistication
Figure 1 shows how EXPY varies across countries in 1997. The sophistication level of China is represented separately for the exports of domestic firms and of foreign firms. The scatterplot of EXPY against per-capita GDP indicates, unsurprisingly given its construction, a similar pattern as in Rodrik (2006): there is a very strong correlation of 0.79 between these two variables in our sample of around 170 countries. Rich (poor) countries export products that tend to be exported by other rich (poor) countries. China is an ‘outlier’ in this relationship both when we look at the product bundle exported by domestic and by foreign firms. In 1997, the export bundle of domestic firms had a level of sophistication (10800$) similar to that of Belarus, a country 2.5 times richer than China in PPP per capita terms. That of foreign firms is higher at 12500$, similar to that of Portugal, a country eight times richer than China in PPP per capita terms in 1997. AUS BGD BLR BOL BRA CANCHE CHL COL CYP DEUDNK DZA ECU ESP FIN GRC HRV HTI HUN IDN IND IRL ISL ITA JAM KEN KOR LCA LKA LTU MAC MDG MEX MYS NLD NZL OMN PER PRT PRY ROM SAU SGP SWE THA TTO TUR TWN USA CHN_foreign CHN_domestic 8.5 9 9.5 10 7 8 9 10 11 Ln GDP per capita
Fitted values Ln Export Sophistication
Figure 1: Relationship between per-capita PPP GDP and EXPY (in logs), 1997. Source: Authors’ computations based on BACI and WDI.
When we look at the evolution of China’s sophistication over time distinguishing between domestic and foreign entities, we observe that the recent upgrading of China’s exports is not confined to foreign entities (typically operating in processing trade), but has also concerned domestic producers. The export sophistication level for both types of exporters has risen rapidly. The income level associated to exports by domestic entities has increased by 15.5% between 1997 and 2007. Over the same period that of foreign entities has however risen faster, by 25.7%, so that the gap between domestic and foreign export sophistication has doubled from 1720$ to 3266$.15
A similar message would be delivered when relying on the share of high tech products in exports to measure export sophistication.
2.3
Export sophistication at the provincial level in China
We move on to look at the pattern of export sophistication across provinces in China. Chinese provinces exhibit important disparities in industrial structure and in overall development, which translate into differences in export structures and export sophistication levels. One important question for our analysis is to know how much of the variance in sophistication is accounted for by differences in development levels across provinces.
Figure 2 shows the relationship between real income per capita (in constant 2000 dollars) and export sophistication across provinces in 1997. The correlation between these two variables in our sample of 30 provinces is positive. It is 0.60 in 199716
, slightly weaker than for the cross-country sample (Figure 1).
Without surprise, the five provinces ranking highest in export sophistication (Tianjin, Guangdong, Jiangsu, Ningxia and Shanghai) are found among the richest provinces in real GDP per capita terms, with the exception of Ningxia, an interior province (refer to Figure 5 in
15
Note that these increases are fully due to the evolution of China’s structure of exports, as the product-level index (PRODY) is computed for 1997 and thus is time-invariant.
16
the Appendix for a map of provinces). This latter province achieves a high export sophistication thanks to its relative specialization in some sophisticated synthetic chemicals.17
Beijing Tianjin Hebei Shanxi Inner Mongolia Liaoning Jilin Heilongjiang Shanghai Jiangsu Zhejiang Anhui Fujian Jiangxi Shandong Henan Hubei Hunan Guangdong Guangxi Hainan Chongqing Sichuan Guizhou Yunnan Shaanxi Gansu Qinghai Ningxia Xinjiang −2.5 −2 −1.5 −1 −.5 0
Log real province GDP per capita 1997
9 9.1 9.2 9.3 9.4 9.5
Log export sophistication 1997
Figure 2: Export sophistication and real GDP per capita, 1997. Source: Authors’ computations
based on Chinese customs and China Statistical Yearbooks.
As can be seen in Table 1, the provinces where specific policies of international trade and foreign investment liberalization were put in place exhibit some of the highest levels of export sophistication. The top 5 provinces in terms of sophistication include the top two provinces in terms of number of special policy zones designed to attract foreign investors through tax rebates and subsidies (Guangdong and Jiangsu) as well as the two outward-oriented province-level cities of Shanghai and Tianjin.
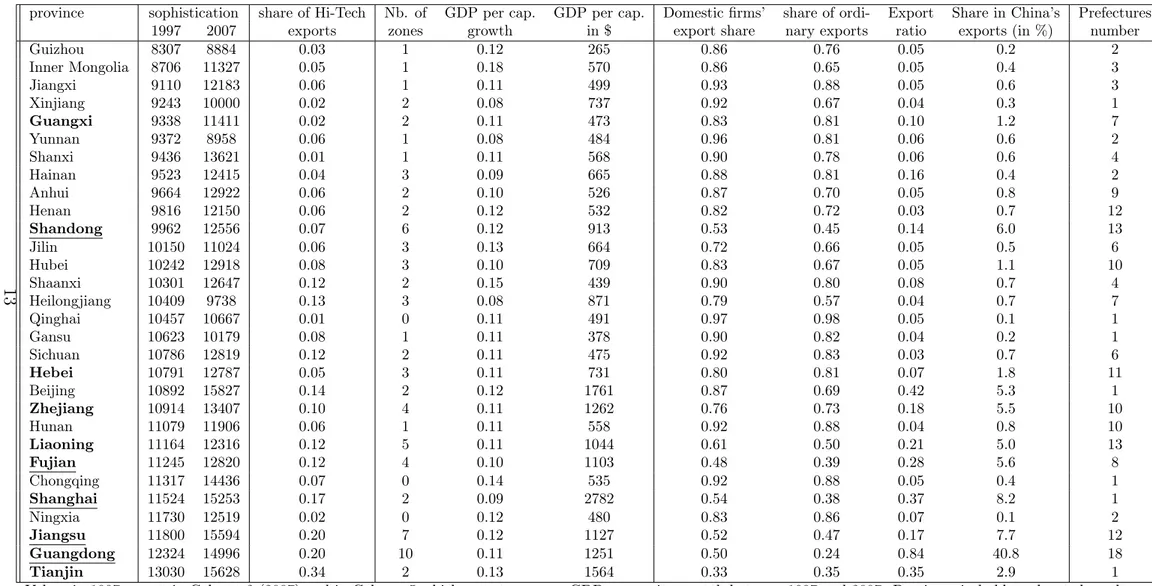
In Figure 3 we look at the relationship across Chinese provinces between export sophistica-tion in 1997 and real income per capita growth rates between 1997 and 2009, after controlling for initial GDP per capita levels. Growth residuals are recovered from the regression of real in-come per capita growth rates between 1997 and 2009 on the Log of GDP per capita in 1997. We find a strong correlation, showing that the link between initial sophistication and subsequent growth does not simply reflect differences in terms of initial levels of income.
17
In particular 4.5% of Ningxia’s total exports is made of Cyanoguanidine, a molecule serving as fertilizer, of which the most specialized exporters are Norway and Germany. The associated level of income, P RODY , for this product is the fifth highest (33,097 PPP $) contributing to raise Ningxia’s level of sophistication.
Table 1: Summary statistics (by increasing order of sophistication in 1997)
province sophistication share of Hi-Tech Nb. of GDP per cap. GDP per cap. Domestic firms’ share of ordi- Export Share in China’s Prefectures
1997 2007 exports zones growth in $ export share nary exports ratio exports (in %) number
Guizhou 8307 8884 0.03 1 0.12 265 0.86 0.76 0.05 0.2 2 Inner Mongolia 8706 11327 0.05 1 0.18 570 0.86 0.65 0.05 0.4 3 Jiangxi 9110 12183 0.06 1 0.11 499 0.93 0.88 0.05 0.6 3 Xinjiang 9243 10000 0.02 2 0.08 737 0.92 0.67 0.04 0.3 1 Guangxi 9338 11411 0.02 2 0.11 473 0.83 0.81 0.10 1.2 7 Yunnan 9372 8958 0.06 1 0.08 484 0.96 0.81 0.06 0.6 2 Shanxi 9436 13621 0.01 1 0.11 568 0.90 0.78 0.06 0.6 4 Hainan 9523 12415 0.04 3 0.09 665 0.88 0.81 0.16 0.4 2 Anhui 9664 12922 0.06 2 0.10 526 0.87 0.70 0.05 0.8 9 Henan 9816 12150 0.06 2 0.12 532 0.82 0.72 0.03 0.7 12 Shandong 9962 12556 0.07 6 0.12 913 0.53 0.45 0.14 6.0 13 Jilin 10150 11024 0.06 3 0.13 664 0.72 0.66 0.05 0.5 6 Hubei 10242 12918 0.08 3 0.10 709 0.83 0.67 0.05 1.1 10 Shaanxi 10301 12647 0.12 2 0.15 439 0.90 0.80 0.08 0.7 4 Heilongjiang 10409 9738 0.13 3 0.08 871 0.79 0.57 0.04 0.7 7 Qinghai 10457 10667 0.01 0 0.11 491 0.97 0.98 0.05 0.1 1 Gansu 10623 10179 0.08 1 0.11 378 0.90 0.82 0.04 0.2 1 Sichuan 10786 12819 0.12 2 0.11 475 0.92 0.83 0.03 0.7 6 Hebei 10791 12787 0.05 3 0.11 731 0.80 0.81 0.07 1.8 11 Beijing 10892 15827 0.14 2 0.12 1761 0.87 0.69 0.42 5.3 1 Zhejiang 10914 13407 0.10 4 0.11 1262 0.76 0.73 0.18 5.5 10 Hunan 11079 11906 0.06 1 0.11 558 0.92 0.88 0.04 0.8 10 Liaoning 11164 12316 0.12 5 0.11 1044 0.61 0.50 0.21 5.0 13 Fujian 11245 12820 0.12 4 0.10 1103 0.48 0.39 0.28 5.6 8 Chongqing 11317 14436 0.07 0 0.14 535 0.92 0.88 0.05 0.4 1 Shanghai 11524 15253 0.17 2 0.09 2782 0.54 0.38 0.37 8.2 1 Ningxia 11730 12519 0.02 0 0.12 480 0.83 0.86 0.07 0.1 2 Jiangsu 11800 15594 0.20 7 0.12 1127 0.52 0.47 0.17 7.7 12 Guangdong 12324 14996 0.20 10 0.11 1251 0.50 0.24 0.84 40.8 18 Tianjin 13030 15628 0.34 2 0.13 1564 0.33 0.35 0.35 2.9 1
Values in 1997 except in Column 2 (2007) and in Column 5 which reports average GDP per capita growth between 1997 and 2007. Provinces in bold are located on the coast. Underlined provinces are those identified as the top 5 exporting provinces that will be excluded from the sample in Table 2 to verify that the results do not only apply to provinces that export a lot. Export sophistication value is in PPP $ of 1997 per capita. GDP per capita is expressed in dollar. Number of zones: count of total special policy zones located in the province in 1997 (Wang and Wei, 2010). Last column reports the number of prefectures that are used in the prefecture-level regressions
It is worth noting the outlying feature of Inner Mongolia. This province reports an average yearly nominal GDP per capita growth rate of 18% between 1997 and 2009, almost twice faster than the national average.18
We will take it into account by using a dummy variable in the empirical estimations. Beijing Tianjin Hebei Shanxi Inner Mongolia Liaoning Jilin Heilongjiang Shanghai Jiangsu Zhejiang Anhui Fujian Jiangxi Shandong Henan Hubei Hunan Guangdong Guangxi Hainan Chongqing Sichuan Guizhou Yunnan Shaanxi Gansu Qinghai Ningxia Xinjiang −.04 −.02 0 .02 .04 .06 Growth residuals 1997−2009 9 9.1 9.2 9.3 9.4 9.5
Log export sophistication 1997
Fit − all sample Fit − no Inner Mongolia
Figure 3: Export sophistication and real GDP per capita growth (1997-2009) across China’s provinces after controlling for Ln GDP per capita in 1997. Notes: Slope on the restricted sample (without Inner Mongolia) is 0.051 with a standard error of 0.022. Source: Authors’ computations based on Chinese customs and China Statistical Yearbooks.
Figure 6 in the Appendix presents a similar graph at the prefecture level. It confirms a positive although weaker relationship between export sophistication in 1997 and subsequent real GDP per capita growth rate (1997-2007).
3
Empirics
3.1
Baseline specification
Our baseline regression tests the link between initial export sophistication (EXP Y ) and sub-sequent growth rates of real GDP per capita, controlling for initial income and for traditional
18
After taking into account the province-specific rate of inflation and the initial GDP per capita, the unex-plained growth rate of Inner Mongolia is still almost 5.5% as can be seen in Figure 3. We could not determine with certainty whether this surprising feature must be attributed to data issues or to a real, unidentified speci-ficity of this province in the period considered.
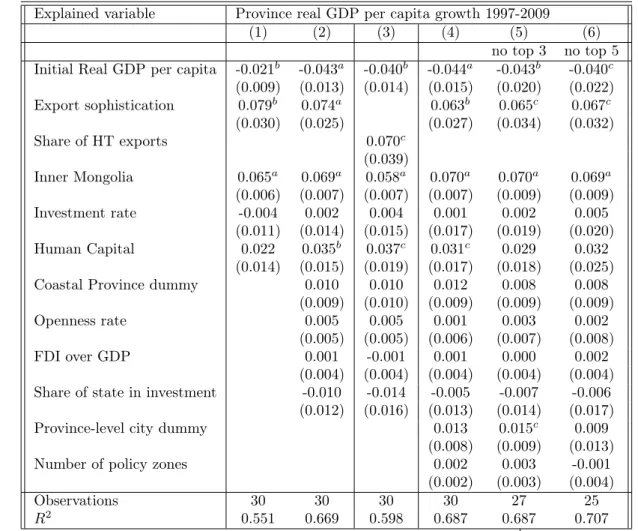
determinants of economic growth. We follow the Table 8 specification in Hausmann, Hwang and Rodrik (2007), of a long difference in GDP per capita growth on initial EXPY, initial income and other controls. Our baseline estimations cover 30 provinces over 12 years from 1997 to 2009.
Our baseline regression takes the following form: yi,2009− yi,1997
12 = α0+ α1yi,1997+ β ln(EXP Yi,1997) + γInvRatei,1997+ δHumCapi,1997+ ǫi (3) with y denoting log real GDP per capita and i indexing our 30 provinces. EXP Y is our indicator of export sophistication presented in Section 2. The logarithm of initial real GDP per capita is included to control for convergence across provinces. We also introduce the ratio of investment in fixed assets over GDP (Investment rate) to control for the rate of physical capital accumulation and the share of population with more than secondary schooling as a proxy for human capital in the provincial workforce (Human Capital). We further include a dummy variable for the province of Inner Mongolia, which we identified to be an outlier in terms of GDP per capita growth.
We will verify that our results are robust when relying on a within (fixed effects) province estimator on three 4-year sub-periods. As show in Equation4, panel regressions will include provincial fixed effects and time fixed effects denoted by ηi and µt respectively.
yi,t+4− yi,t
4 = α0+ α1yi,t + β ln(EXP Yi,t) + γInvRatei,t+ δHumCapi,t+ ηi+ µt+ ǫi,t (4) Various controls19
are included to mitigate omitted variables problems. In the Chinese context, a number of geographical, institutional and political variables are likely to influence simultaneously trade performance and growth trajectories. We use dummy variables to capture the coastal location and the province-level status of the four ‘super cities’ (Beijing, Tianjin,
19
Shanghai and Chongqing). To control for differences in the progress of market-oriented reforms and of privatization, we measure the weight of state-owned firms in the economy by their share in total investment (Démurger et al, 2002; Boyreau-Debray, 2003). We also include the number of special policy zones20
as computed by Wang and Wei (2010). We finally control for rates of trade openness (imports plus exports over GDP) and FDI inflows (FDI over GDP) as suggested by Barro (1991), Easterly et al. (1997) and Berthélemy and Démurger (2000) in the Chinese context. Summary statistics of all variables used in the regressions are displayed in Table A-1 in Appendix.
3.2
Regression results
3.2.1 The link between export sophistication and real growth
Baseline
Results on the impact of export sophistication on long-run real GDP per capita growth are displayed in Table 2. Column 1 reports our benchmark growth regression before Column 2 adds some controls. The variables in the conditioning information set have the expected signs. Lagged real GDP per capita attracts a negative and significant coefficient indicating a process of convergence across provinces. Our finding of a negative coefficient on initial real GDP per capita in Table 2 and subsequent tables could in part reflect a measurement error issue. Measurement error in initial real GDP per capita would give rise to a spurious negative relationship between the initial level and subsequent growth. Our measure of human capital generally enters with positive and significant coefficient while that of physical capital accumulation is not significant. As expected, openness rate and FDI over GDP attract positive signs while the State share of investment is negative. They however fail to be significant. Our variable of interest, initial
20
Such zones were created by the government starting in 1979 in Guangdong, to promote industrial activities, innovation and export activities. They offer low tax regimes and faster administrative procedures to favor industrial clustering. See last column of Table 1.
export sophistication, enters with a positive and significant coefficient. Provinces whose export structure is more sophisticated achieve higher growth rates over the following 12-year period, a pattern not explained by any of the control variables included. Despite a reduced significance, our results hold when province-level sophistication is proxied by the share of high technology products in exports (Column 3).
Based on the results in Column 2, we can interpret the magnitude of the estimated coeffi-cient. Holding other factors constant, a 10% increase in export sophistication (corresponding to a one-standard deviation over mean increase as reported in summary statistics Table A-1 in the Appendix) raises the average annual real income per capita growth rate over the following 12-year period by about 0.7% yearly. This value is of the same order of magnitude than the figure of 0.5% obtained by Hausmann, Hwang and Rodrik (2007) based on a cross-country panel data set over the period 1962-2000.
In Column 4, 5 and 6, we test whether our results are driven by the features of some specific provinces. As mentioned above, in China a small number of provinces are clearly distinguishable from the rest, by a number of location and policy specificities that made them the richest, fastest-growing, most open ones, and the ones exporting the most sophisticated goods.
Our results could be entirely due to the specific features of this special part of China. We thus examine this possibility carefully. First, Column 4 adds a dummy variable to account for the four province-level cities and controls for the number of policy zones. In Columns 5 and 6, we exclude the top 3 (Guangdong, Shanghai and Jiangsu) and top 5 (previous three plus Shandong and Fujian) exporting provinces, respectively, from our sample. The sample size drops from 30 to 27 and 25 respectively as a consequence. Despite the reduced number of observations, it is striking to see that the growth elasticity of export sophistication remains significant with magnitudes similar to the earlier specification, showing that the positive relationship between
Table 2: Cross-section (province): sophistication and real GDP per capita growth 1997-2009
Explained variable Province real GDP per capita growth 1997-2009
(1) (2) (3) (4) (5) (6) no top 3 no top 5 Initial Real GDP per capita -0.021b -0.043a -0.040b -0.044a -0.043b -0.040c
(0.009) (0.013) (0.014) (0.015) (0.020) (0.022) Export sophistication 0.079b 0.074a 0.063b 0.065c 0.067c (0.030) (0.025) (0.027) (0.034) (0.032) Share of HT exports 0.070c (0.039) Inner Mongolia 0.065a 0.069a 0.058a 0.070a 0.070a 0.069a (0.006) (0.007) (0.007) (0.007) (0.009) (0.009) Investment rate -0.004 0.002 0.004 0.001 0.002 0.005 (0.011) (0.014) (0.015) (0.017) (0.019) (0.020) Human Capital 0.022 0.035b 0.037c 0.031c 0.029 0.032 (0.014) (0.015) (0.019) (0.017) (0.018) (0.025) Coastal Province dummy 0.010 0.010 0.012 0.008 0.008
(0.009) (0.010) (0.009) (0.009) (0.009) Openness rate 0.005 0.005 0.001 0.003 0.002
(0.005) (0.005) (0.006) (0.007) (0.008) FDI over GDP 0.001 -0.001 0.001 0.000 0.002
(0.004) (0.004) (0.004) (0.004) (0.004) Share of state in investment -0.010 -0.014 -0.005 -0.007 -0.006
(0.012) (0.016) (0.013) (0.014) (0.017) Province-level city dummy 0.013 0.015c 0.009
(0.008) (0.009) (0.013) Number of policy zones 0.002 0.003 -0.001
(0.002) (0.003) (0.004) Observations 30 30 30 30 27 25 R2 0.551 0.669 0.598 0.687 0.687 0.707
Heteroskedasticity-robust standard errors are reported in parentheses. a, b andc indicate
significance at the 1%, 5% and 10% confidence level. Column 5 reports the results without the three main exporters (Guangdong, Shanghai and Jiangsu) and Column 6 further with-draws Shandong and Fujian. All explanatory variables are measured at the beginning of the sample period. See Appendix for precise definitions of all variables.
export sophistication and growth is not confined to the trade-oriented provinces; even though they are undoubtedly the most important contributors both to the volume and the high-range composition of China’s exports.
Robustness checks
The cross-section estimates presented above seem to indicate a pattern which resists to the introduction of a number of controls, as well as to the exclusion of the provinces most exem-plary of the export sophistication-growth link. These estimates however suffer from two major limitations: one is the small number of observations; the second, the omitted variables risk, due to our limited capacity to control, in cross-section, for structural differences among Chinese provinces.
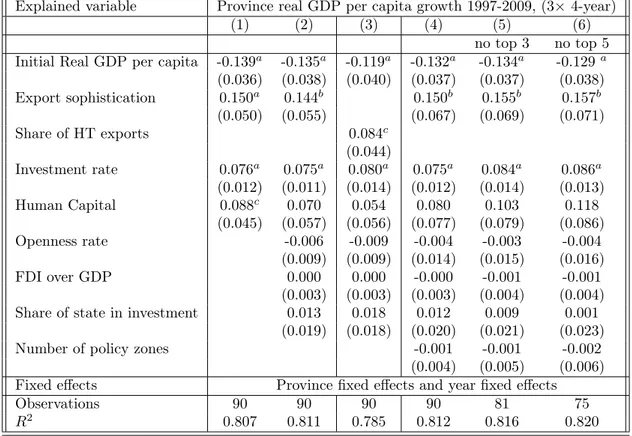
We address these issues in two steps. First, we use a fixed-effect estimator on our province-level panel dataset. Second, we rely on data at the prefecture province-level, the administrative unit below province, to obtain cross-section estimates on a larger sample. Tables 3 and 4 report results from these two estimation strategies, following the same logical order for presentation as in Table 2.
Table 3 uses a within (fixed-effects) estimator on a province-level panel covering three 4-year sub-periods (1997-2001, 2001-2005 and 2005-2009). It confirms that the positive relationship between export sophistication and growth does not simply reflect differences in time-invariant variables (geography, institutions). The inclusion of time fixed-effects controls for time-varying variables common to all provinces (nation-wide reforms, external demand). The coefficient on sophistication appears higher at 0.15 but does not seem to be significantly different from the previous estimates in cross-section.
Next, we estimate Equation 3 on a cross-section of prefectures, the administrative unit below province. We use customs trade data at the prefecture level for the year 1997 to compute
Table 3: Within regression (province): sophistication and real GDP per capita growth between 1997 and 2009 (3× 4-year)
Explained variable Province real GDP per capita growth 1997-2009, (3× 4-year) (1) (2) (3) (4) (5) (6)
no top 3 no top 5 Initial Real GDP per capita -0.139a -0.135a -0.119a -0.132a -0.134a -0.129a
(0.036) (0.038) (0.040) (0.037) (0.037) (0.038) Export sophistication 0.150a 0.144b 0.150b 0.155b 0.157b (0.050) (0.055) (0.067) (0.069) (0.071) Share of HT exports 0.084c (0.044) Investment rate 0.076a 0.075a 0.080a 0.075a 0.084a 0.086a (0.012) (0.011) (0.014) (0.012) (0.014) (0.013) Human Capital 0.088c 0.070 0.054 0.080 0.103 0.118 (0.045) (0.057) (0.056) (0.077) (0.079) (0.086) Openness rate -0.006 -0.009 -0.004 -0.003 -0.004 (0.009) (0.009) (0.014) (0.015) (0.016) FDI over GDP 0.000 0.000 -0.000 -0.001 -0.001 (0.003) (0.003) (0.003) (0.004) (0.004) Share of state in investment 0.013 0.018 0.012 0.009 0.001
(0.019) (0.018) (0.020) (0.021) (0.023) Number of policy zones -0.001 -0.001 -0.002
(0.004) (0.005) (0.006) Fixed effects Province fixed effects and year fixed effects Observations 90 90 90 90 81 75 R2 0.807 0.811 0.785 0.812 0.816 0.820
Heteroskedasticity-robust standard errors are reported in parentheses. Standard errors are clustered at the province level. a, b and c indicate significance at the 1%, 5% and 10%
confidence level. Column 5 reports the results without the three main exporters (Guang-dong, Shanghai and Jiangsu) and Column 6 further withdraws Shandong and Fujian. All explanatory variables are measured at the beginning of the 4-year period. See Appendix for precise definitions of all variables.
Table 4: Cross-section (prefecture): sophistication and real GDP per capita growth 1997-2007
Explained variable Prefectures real GDP per capita growth 1997-2007
(1) (2) (3) (4) (5) (6) no top decile no policy zone Initial Real GDP per capita -0.004 -0.013c -0.011c -0.012c -0.013c -0.015c
(0.007) (0.007) (0.007) (0.007) (0.007) (0.009) Export sophistication 0.028c 0.030b 0.030b 0.025c 0.031c (0.016) (0.015) (0.015) (0.015) (0.016) Share of HT exports 0.029c (0.016) Investment rate 0.019b 0.016b 0.015b 0.016b 0.017a 0.027a (0.008) (0.007) (0.007) (0.007) (0.006) (0.008) Human Capital 0.000 -0.004 -0.004 -0.003 -0.007 0.014 (0.005) (0.005) (0.005) (0.006) (0.007) (0.021) Province-level city dummy -0.009 -0.007 -0.009 -0.015c -0.010
(0.008) (0.008) (0.008) (0.009) (0.008) Openness rate 0.009a 0.009a 0.009a 0.010a 0.010a
(0.003) (0.003) (0.003) (0.002) (0.003) FDI over GDP -0.003 -0.003 -0.003 -0.003 -0.003
(0.002) (0.002) (0.002) (0.002) (0.002) Policy zone dummy -0.002 0.001 n.a.
(0.008) (0.007) n.a. Observations 181 181 181 181 163 125 R2 0.094 0.192 0.178 0.192 0.247 0.322
Heteroskedasticity-robust standard errors are reported in parentheses. a,bandcindicate significance
at the 1%, 5% and 10% confidence level. All explanatory variables are measured at the beginning of the sample period. Column 5 reports the results without top decile exporting prefectures. Column 6 report the results only on prefectures with no policy zones. See Appendix for precise definitions of all variables.
the sophistication indicator. Once combined with macro-level information (GDP, population, investment, education)21
for 1997 and 2007 (the most recent year available), we obtain a cross-section of 181 prefectures. They represent 90% of China’s export value in 199722
. Table 4 reports results on the impact of export sophistication in 1997 on the subsequent 10-year average real GDP per capita growth rate at the prefecture level.
Column 1 reports our benchmark growth regression before Column 2 adds some controls. The investment rate and the openness rate enter positively and significantly in these regressions while human capital is positive but not significant. Our results confirm that the initial level
21
Data are taken from China Data Online provided by the University of Michigan. Unfortunately, the coverage of this database is more limited than the Customs dataset (220 cities from 1997 through 2007), which effectively constrains the ultimate sample for the statistical analyses. See Appendix for definitions of variables and data sources.
22
of export sophistication is a positive and significant determinant (though only at the 10% confidence level in some specifications) of subsequent growth of GDP per capita. Column 3 confirms that our positive association between export sophistication and growth remains when sophistication is measured based on Lall (2000)’s classification.
Our results moreover prove robust to the control and exclusion of the most outward-oriented cities. Column 4 adds a dummy for the cities hosting a policy zone. It fails to enter significantly, leaving our previous findings unchanged. Column 5 excludes the top decile exporting prefectures while Column 6 drops prefectures hosting a policy zone based on Wang and Wei (2010). The positive impact of sophistication is unchanged, confirming that it is not limited to those locations with preferential trading and investment policies.
3.2.2 Decomposition of export sophistication in China
Our results so far suggest that specializing in innovative, high tech products is beneficial, in real growth terms, to Chinese regions, as it is among countries. This seems at first sight an ex post validation of China’s industrial and trade policy over the past 30 years, which heavily encouraged export development and supported foreign investment, hoping for positive spillovers. However, the provinces and cities which spearheaded these open-door policies; i.e. those which were chosen first by the government to host special economic zones dedicated to export development, and which as a consequence grew into huge investment and export hubs, do not seem to be those where the growth benefits of export upgrading are the most apparent. Controlling for these areas’ special features, or excluding them from our sample, does not affect our estimates in any significant way.
One possible explanation as mentioned in our introduction relates to processing trade. When looking at export sophistication one needs to account for processing export activities, for which the sophistication of exported products may not generate growth gains, simply because it
does not reflect the characteristics of local production processes, but rather those of imported inputs. We will verify this (1) by checking that it is not the sophistication of imports that is actually driving our results; then, (2) by distinguishing between trade types and firm ownership categories. Doing so will allow us to check that China’s unique processing trade regime does not systematically distort upward the ‘true’ level of export sophistication. Moreover, it will address the possibility that positive growth externalities from sophisticated exports are conditional on the trade regime. In order to check whether they are also conditional on exporting firm types, we will further decompose the total effect of export sophistication on growth into the contributions of both domestic and foreign firms, relying on the firm ownership information available in our customs data.
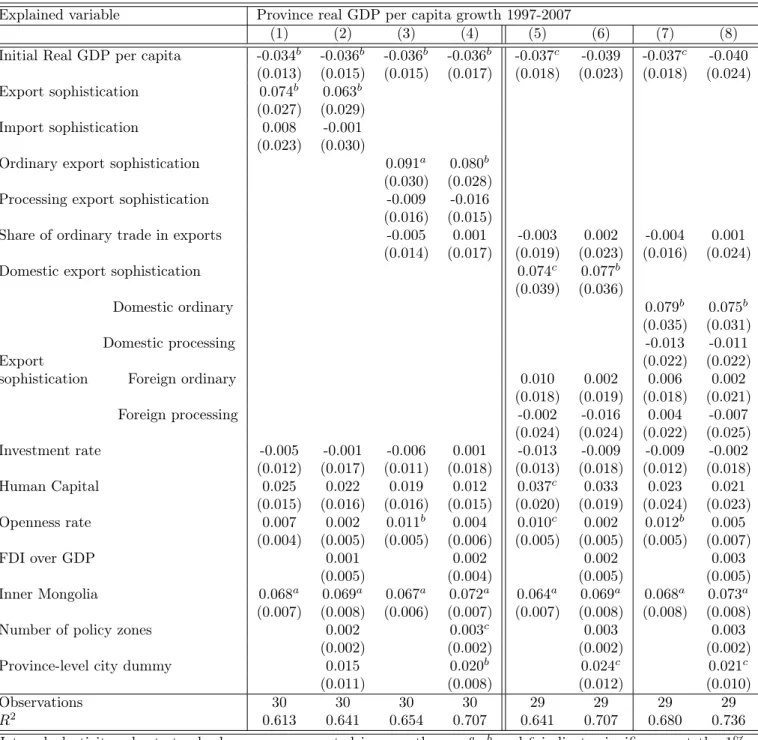
Disentangling the roles of trade regime and firm type in growth gains from sophistication is done in Tables 5, 6 and 7, for provinces in cross-section, in panel, and on a cross section of prefectures, respectively. In each table we proceed in three steps. First, we introduce the sophistication level of imports23
in parallel to the sophistication level of exports. In the first column of each table, import sophistication is not significant, while export sophistication remains significant and positive, with an estimated impact similar to that previously found. Importing sophisticated inputs (or capital goods) does not seem to provide direct growth gains. This finding is robust to the addition of control variables (Column 2 of each table).
As a second step, the next two columns (3 & 4) of each table introduce separately the export sophistication index (EXP Y ) computed separately for the processing and ordinary export baskets, in the region considered (province or prefecture). In addition we control for the share of ordinary trade in the total export value of the region. We obtain, in each case, a significant and positive coefficient on the ordinary component only, while processing exports
23
It is computed in a similar manner as for exports, by applying the formula in Equation 2 to the basket of imports of a given region. It thus computes the average value of the product-level index P RODY in imports, weighted by import shares.
sophistication has no predictive power on growth rates.
The third step further decomposes exports sophistication by trade regime and firm owner-ship. In Columns 5 and 6 of each table, foreign firms’ exports sophistication is decomposed into its processing and ordinary components. We thus test whether the lack of significance of foreign export sophistication relates to the weight of processing trade in total trade by foreign firms. In the last two columns (7 & 8), export sophistication is finally split into its four components of processing versus ordinary trade, separately for domestic and foreign entities.24
Our results show very consistently that the sophistication of foreign firms’ exports has no direct impact on real growth rates, even when distinguishing exports in the assembly/ordinary sectors. Thus, foreign producers upgrading their production capabilities do not generate the expected positive externalities, even when they do not use China as a mere assembly platform, but produce the major part of their value-added in China. Positive growth gains appear to be generated exclusively by domestic firms, operating in the ordinary trade regime.
These findings bring new light on the so-called sophistication debate about China. Several studies have found that the sophistication of exports in China is closely related to the impor-tance of the assembly trade sector, and to the presence of foreign firms (Wang and Wei, 2010; Xu and Lu, 2009). Our figures are entirely consistent with this pattern, as a casual look at province-level statistics on export sophistication and export structures reveals (see Table 1). We confirm that the main driver of China’s export sophistication between 1997 and 2007, ac-counting for 75% of the rise, is upgrading in processing trade emanating from in foreign firms. What we show, however, is that the rise and upgrading of processing exports may not have generated the expected benefits in real growth terms. Decomposing China’s export sophistica-tion by trade regimes and firm types reveals that the locus of the highest export growth and
24
When doing this we lose some observations in our samples, due to the absence of some categories of ex-porters in some regions. In the province-level sample, the province of Qinghai is dropped when foreign export sophistication is split into processing and ordinary as in 1997 no foreign firm operated in processing trade in that province. The number of observations drops in Tables 6 and 7 for similar reasons.
Table 5: Decomposing export sophistication: cross-section (provinces)
Explained variable Province real GDP per capita growth 1997-2007
(1) (2) (3) (4) (5) (6) (7) (8) Initial Real GDP per capita -0.034b -0.036b -0.036b -0.036b -0.037c -0.039 -0.037c -0.040
(0.013) (0.015) (0.015) (0.017) (0.018) (0.023) (0.018) (0.024) Export sophistication 0.074b 0.063b
(0.027) (0.029) Import sophistication 0.008 -0.001
(0.023) (0.030)
Ordinary export sophistication 0.091a 0.080b
(0.030) (0.028) Processing export sophistication -0.009 -0.016
(0.016) (0.015)
Share of ordinary trade in exports -0.005 0.001 -0.003 0.002 -0.004 0.001 (0.014) (0.017) (0.019) (0.023) (0.016) (0.024) Domestic export sophistication 0.074c 0.077b
(0.039) (0.036)
Domestic ordinary 0.079b 0.075b
(0.035) (0.031) Domestic processing -0.013 -0.011
Export (0.022) (0.022)
sophistication Foreign ordinary 0.010 0.002 0.006 0.002 (0.018) (0.019) (0.018) (0.021) Foreign processing -0.002 -0.016 0.004 -0.007 (0.024) (0.024) (0.022) (0.025) Investment rate -0.005 -0.001 -0.006 0.001 -0.013 -0.009 -0.009 -0.002 (0.012) (0.017) (0.011) (0.018) (0.013) (0.018) (0.012) (0.018) Human Capital 0.025 0.022 0.019 0.012 0.037c 0.033 0.023 0.021 (0.015) (0.016) (0.016) (0.015) (0.020) (0.019) (0.024) (0.023) Openness rate 0.007 0.002 0.011b 0.004 0.010c 0.002 0.012b 0.005 (0.004) (0.005) (0.005) (0.006) (0.005) (0.005) (0.005) (0.007) FDI over GDP 0.001 0.002 0.002 0.003 (0.005) (0.004) (0.005) (0.005) Inner Mongolia 0.068a 0.069a 0.067a 0.072a 0.064a 0.069a 0.068a 0.073a (0.007) (0.008) (0.006) (0.007) (0.007) (0.008) (0.008) (0.008) Number of policy zones 0.002 0.003c 0.003 0.003
(0.002) (0.002) (0.002) (0.002) Province-level city dummy 0.015 0.020b 0.024c 0.021c
(0.011) (0.008) (0.012) (0.010) Observations 30 30 30 30 29 29 29 29 R2 0.613 0.641 0.654 0.707 0.641 0.707 0.680 0.736
Heteroskedasticity-robust standard errors are reported in parentheses. a, b and c indicate significance at the 1%,
5% and 10% confidence level. All explanatory variables are measured at the beginning of the sample period. See Appendix for precise definitions of all variables.
upgrading rates does not coincide with that of the highest growth benefits from it. We find that the only upgrading significantly and positively associated to subsequent economic growth is that made in ordinary exports by domestic firms, despite its limited role in China’s overall export sophistication rise. This result is consistent with Koopman et al. (2008) computation that exports from domestic firms embody the highest domestic value added share. They identify wholly foreign owned firms as having the lowest share of domestic value-added (28% compared to 82% for private domestic firms in 2006). They note that the share of domestic content varies negatively with the degree of reliance on processing exports.
In this sense, we confirm the line in the literature which argues that processing trade and ordinary trade should not be considered without distinction. Our results suggest that they intrinsically differ in their characteristics and their potential benefits. Our results are coherent with ordinary export sophistication signaling genuine technology adoption and capacity building in contrast to processing export sophistication. They warn against not taking into account the various trade regimes and firm types when estimating the growth contribution of the country’s technology advancement.
However, it should be noted that we do not hold the absence of a direct effect of the sophistication of foreign firms’ export basket on economic growth, once that of domestic firms is taken into account, as a proof that foreign-owned firms, or even processing trade, has no positive impact growth at all. After all, the rationale behind China’s FDI attraction policy has been the hope for spillovers from foreign-owned to domestic firms. That the upgrading of domestic firms’ exports, which appears to have positive growth effects, is occurring thanks to such spillovers, is a possibility, which we do not examine in this study. Note however, that some recent studies have found little evidence of such spillovers in China (e.g. Bloningen and Ma (2007)). Taken together, these results and ours question the real benefits from China’s industrial and foreign investment policy.
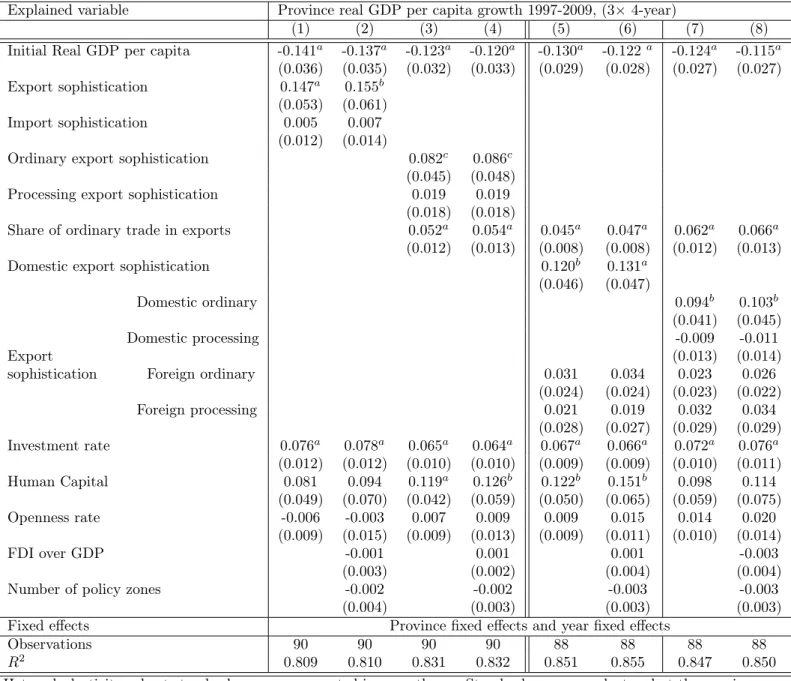
Table 6: Decomposing export sophistication: panel fixed-effect regressions on provinces (3× 4-year)
Explained variable Province real GDP per capita growth 1997-2009, (3× 4-year)
(1) (2) (3) (4) (5) (6) (7) (8) Initial Real GDP per capita -0.141a -0.137a -0.123a -0.120a -0.130a -0.122a -0.124a -0.115a
(0.036) (0.035) (0.032) (0.033) (0.029) (0.028) (0.027) (0.027) Export sophistication 0.147a 0.155b
(0.053) (0.061) Import sophistication 0.005 0.007
(0.012) (0.014)
Ordinary export sophistication 0.082c 0.086c
(0.045) (0.048) Processing export sophistication 0.019 0.019
(0.018) (0.018)
Share of ordinary trade in exports 0.052a 0.054a 0.045a 0.047a 0.062a 0.066a
(0.012) (0.013) (0.008) (0.008) (0.012) (0.013) Domestic export sophistication 0.120b 0.131a
(0.046) (0.047)
Domestic ordinary 0.094b 0.103b
(0.041) (0.045) Domestic processing -0.009 -0.011
Export (0.013) (0.014)
sophistication Foreign ordinary 0.031 0.034 0.023 0.026 (0.024) (0.024) (0.023) (0.022) Foreign processing 0.021 0.019 0.032 0.034 (0.028) (0.027) (0.029) (0.029) Investment rate 0.076a 0.078a 0.065a 0.064a 0.067a 0.066a 0.072a 0.076a (0.012) (0.012) (0.010) (0.010) (0.009) (0.009) (0.010) (0.011) Human Capital 0.081 0.094 0.119a 0.126b 0.122b 0.151b 0.098 0.114 (0.049) (0.070) (0.042) (0.059) (0.050) (0.065) (0.059) (0.075) Openness rate -0.006 -0.003 0.007 0.009 0.009 0.015 0.014 0.020 (0.009) (0.015) (0.009) (0.013) (0.009) (0.011) (0.010) (0.014) FDI over GDP -0.001 0.001 0.001 -0.003 (0.003) (0.002) (0.004) (0.004) Number of policy zones -0.002 -0.002 -0.003 -0.003
(0.004) (0.003) (0.003) (0.003) Fixed effects Province fixed effects and year fixed effects
Observations 90 90 90 90 88 88 88 88
R2 0.809 0.810 0.831 0.832 0.851 0.855 0.847 0.850
Heteroskedasticity-robust standard errors are reported in parentheses. Standard errors are clustered at the province level. a,b andcindicate significance at the 1%, 5% and 10% confidence level. All explanatory variables are measured
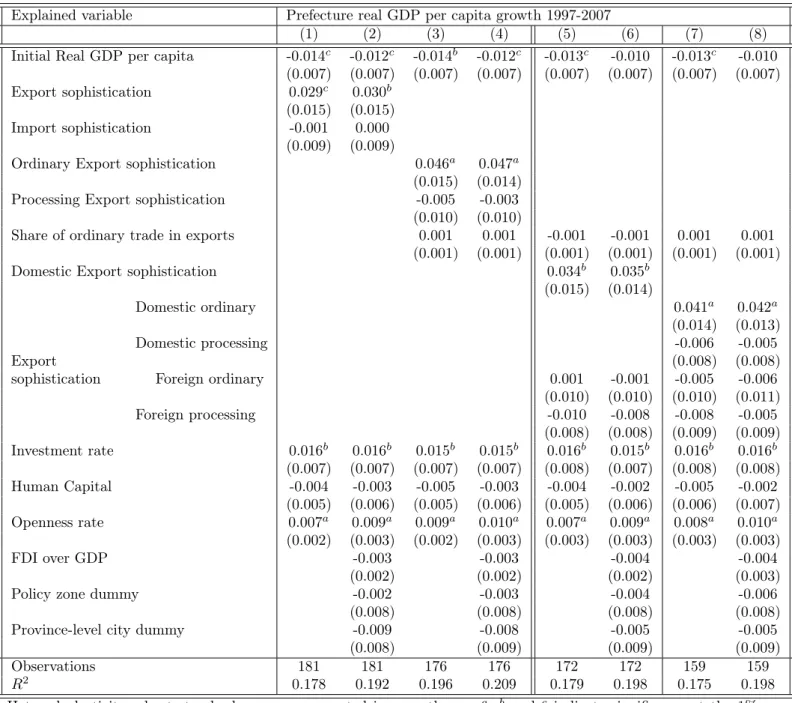
Table 7: Decomposing export sophistication: cross-section (prefectures)
Explained variable Prefecture real GDP per capita growth 1997-2007
(1) (2) (3) (4) (5) (6) (7) (8) Initial Real GDP per capita -0.014c -0.012c -0.014b -0.012c -0.013c -0.010 -0.013c -0.010
(0.007) (0.007) (0.007) (0.007) (0.007) (0.007) (0.007) (0.007) Export sophistication 0.029c 0.030b
(0.015) (0.015) Import sophistication -0.001 0.000
(0.009) (0.009)
Ordinary Export sophistication 0.046a 0.047a
(0.015) (0.014) Processing Export sophistication -0.005 -0.003
(0.010) (0.010)
Share of ordinary trade in exports 0.001 0.001 -0.001 -0.001 0.001 0.001 (0.001) (0.001) (0.001) (0.001) (0.001) (0.001) Domestic Export sophistication 0.034b 0.035b
(0.015) (0.014)
Domestic ordinary 0.041a 0.042a
(0.014) (0.013) Domestic processing -0.006 -0.005
Export (0.008) (0.008)
sophistication Foreign ordinary 0.001 -0.001 -0.005 -0.006 (0.010) (0.010) (0.010) (0.011) Foreign processing -0.010 -0.008 -0.008 -0.005 (0.008) (0.008) (0.009) (0.009) Investment rate 0.016b 0.016b 0.015b 0.015b 0.016b 0.015b 0.016b 0.016b (0.007) (0.007) (0.007) (0.007) (0.008) (0.007) (0.008) (0.008) Human Capital -0.004 -0.003 -0.005 -0.003 -0.004 -0.002 -0.005 -0.002 (0.005) (0.006) (0.005) (0.006) (0.005) (0.006) (0.006) (0.007) Openness rate 0.007a 0.009a 0.009a 0.010a 0.007a 0.009a 0.008a 0.010a (0.002) (0.003) (0.002) (0.003) (0.003) (0.003) (0.003) (0.003) FDI over GDP -0.003 -0.003 -0.004 -0.004 (0.002) (0.002) (0.002) (0.003) Policy zone dummy -0.002 -0.003 -0.004 -0.006
(0.008) (0.008) (0.008) (0.008) Province-level city dummy -0.009 -0.008 -0.005 -0.005
(0.008) (0.009) (0.009) (0.009) Observations 181 181 176 176 172 172 159 159 R2 0.178 0.192 0.196 0.209 0.179 0.198 0.175 0.198
Heteroskedasticity-robust standard errors are reported in parentheses. a, b and c indicate significance at the 1%,
5% and 10% confidence level. All explanatory variables are measured at the beginning of the sample period. See Appendix for precise definitions of all variables.
4
Conclusion
Our study provides a test of Hausmann, Hwang and Rodrik (2007)’s prediction that regions that develop more sophisticated goods grow subsequently faster, relying on regional variations within a single country (China). We find that even at the province and prefecture level, there is substantial variation in export sophistication controlling for the level of development, and that this difference in turn matters for growth. We find however that growth gains from improved technological capabilities only occur when these capabilities are developed by domestic-owned firms and embedded in ordinary trade. This finding suggests that the various sources (export regime and firm type) of the upgrading of China’s exports must be distinguished when one wants to measure the true improvement in the country’s technology level and its contribution to economic growth. It is important to note that although we find foreign sophistication to have little association with subsequent growth, there may still be room for indirect effects of foreign firms on domestic ones through emulation or export spillovers as suggested by Mayneris and Poncet (2010). In any case fruitful avenues for further research include the investigation of the exact sectors that are contributing to export sophistication improvement as well as the possible associations between specific sectors that are increasing sophistication in different provinces and provincial regulations and export promotion activities.
5
References
Aghion, Philippe, and Peter Howitt, 1998. Endogenous Growth Theory, Cambridge, MA, MIT Press.
Amiti Mary and Caroline Freund, 2010. An Anatomy of China’s Export Growth, in Robert Feenstra, & Shang-Jin Wei (Eds.), China’s Growing Role in World Trade. : University of Chicago Press.
Barro Robert, 1991. Economic growth in a cross-section of countries, Quarterly Journal of Economics, 56, 407–443.
Berthélemy Jean-Claude and Sylvie Démurger, 2000. Foreign Direct Investment and Economic Growth: Theory and Application to China, Review of Development Economics 4 (2), 140-55.
Bloningen, Bruce and Ma Alyson, 2007. Please Pass the Catch-up: The Relative Performance of Chinese and Foreign Firms in Chinese Exports, in Robert Feenstra, & Shang-Jin Wei (Eds.), China’s Growing Role in World Trade. : University of Chicago Press.
Boyreau-Debray, Geneviève, 2003. Financial intermediation and growth: Chinese style. World Bank Policy Research Working Paper No. 3027.
Chaney, Thomas, 2008. Distorted gravity: the intensive and extensive margins of international trade, American Economic Review, 98 (4), 1701-1721.
Dean, Judith, K. C. Fung and Zhi Wang, 2007. Measuring Vertical Specialization in Chinese trade, US International Trade Commission working paper.
Démurger, Sylvie, Jeffrey Sachs, Wing Thye Woo, Shuming Bao, Gene Chang and Andrew Mellinger, 2002. Geography, Economic Policy, and Regional Development in China, Asian Economic Papers 1 (1), 146-197.
Easterly William, Norman Loayza and Peter Montiel, 1997. Has Latin Americas post reform growth been disappointing? Journal of International Economics, 43, 287–311.
Fontagné, Lionel, Guillaume Gaulier and Soledad Zignago, 2007. Specialization across varieties and North-South competition Economic Policy, 23 (53), 51-91.
Gaulier Guillaume and Soledad Zignago, 2010. BACI: International Trade Database at the
Product-Level. The 1994-2007 Version CEPII Working Paper, N◦2010-23.
Görg, Holger and David Greenaway, 2004. Much Ado About Nothing? Do Domestic Firms Really Benefit from Foreign Direct Investment?’, World Bank Research Observer, 19, 2, 171–97.
Hausmann, Ricardo, Jason Hwang and Dani Rodrik, 2007. What You Export Matters, Journal of Economic Growth, 12, 1-25.
Hausmann, Ricardo and Dani Rodrik, 2003. Economic Development as Self Discovery, Journal of Development Economics, 72 (2), 603-633.
Hummels David, Jun Ishii and Kei-Mu Yi, 2001. The Nature and Growth of Vertical Special-ization in World Trade, Journal of International Economics, 54, 75-96.
Koopmans, Robert, Zhi Wang and Shang-Jin Wei, 2008. How much of Chinese exports is really made in China? Assessing domestic value-added when processing trade is pervasive. NBER Working Paper Series 14109.
Kumakura, Masanaga, 2007. What’s so special about China’s Exports? A comment , China & World Economy, 15 (5), 18-37.
Lardy, Nicholas, 2005. China: the great new economic challenge, chapter in F. Bergsten, (Ed), The United States and the World Economy: Foreign Policy for the next decade. Washington D.C. Institute for International Economics.
Lall, Sanjaya, 2000, The Technological Structure and Performance of Developing Country Manufactured Exports, 1985-1998, Oxford Development Studies, 28, 3.
Lall, Sanjaya, John Weiss and Jinkang Zhang, 2006. The Sophistication of exports: a new trade measure, World Development, 34 (2), 222-237.
Lemoine, Françoise and Deniz Ünal-Kesenci, 2004. Assembly Trade and Technology Transfer: the case of China, World Development, 32, 5, 829-850.
Mayneris, Florian and Sandra Poncet, 2010. Export performance of China’s domestic firms: the role of foreign export spillovers, CEPII Working Paper No 2010-32.
Naughton, Barry, 2007. The Chinese Economy: Transitions and Growth. Cambridge, MA: MIT Press.
Rodrik, Dani, 2006. What’s so special about Chinas Exports?, China & World Economy, 14 (5), 1-19.
Schott, Peter, 2007. The Relative Sophistication of Chinese Exports, Economic Policy, 23 (53), 5-49.
Stokey, Nancy L., 1988. Learning-by-Doing and the Introduction of New Goods, Journal of Political Economy, 96, 701-717.
Van Assche, Ari, and Byron Gangnes, 2010. Electronics production upgrading: is China exceptional?, Applied Economics Letters, 17(5), 477-482.
Wang, Zhi and Shang-Jin Wei, 2010. What accounts for the rising sophistication of China’s exports, in Robert Feenstra, & Shang-Jin Wei (Eds.), Chinas Growing Role in World Trade. : University of Chicago Press.
Xu, Bin, 2010. The sophistication of exports: Is China special?, China Economic Review, 21, 482-493.
Xu, Bin and Lu Jiangyong, 2009. Foreign direct investment, processing trade, and the sophis-tication of China’s exports„ China Economic Review, 20, 425-439.
Yao, Shunli , 2009. Why are Chinese exports not so special?, China & World Economy, 17, 47-65.
Young, Alwyn, 1991. Learning by Doing and the Dynamic Effects of International Trade, Quarterly Journal of Economics, 106, 369-405.
6
Appendix: Definition of the variables and statistical sources
Macro-level data at the provincial level and at the prefecture level (GDP, investment, human capital) are taken from China Data Online provided by the University of Michigan.Explained variables GDP per capita: logarithm of real GDP per capita (deflation based on annual CPI)
Explanatory variables
Sophistication variable: The sophistication level of exports is the logarithm of EXP Y as
defined in Equation 2. It is computed based on trade flows from the China Customs database. Measures based on domestic (foreign) firms only are referred to as domestic (foreign) export sophistication. Measures based on ordinary (processing) trade flows only are referred to as ordinary (processing) export sophistication. We also use the share of high-tech products (as defined by Lall (2000)) in exports.
Control variables:
Investment rate: logarithm of share of gross fixed investment over GDP.
Human Capital: the province level indicator is the logarithm of share of population aged 6 and over that declares a secondary or above education attainment. It is a stock measure of higher education attainment. It is computed based on data collected in the yearly national sample survey on population change, as the sum of people which attained junior secondary, senior secondary or college and higher. Since these data are not available at the prefecture level, we use the ratio of student enrollment in regular secondary schools in the total population.
Share of state in investment: logarithm of share of state entities in total investment in fixed assets
Openness rate: logarithm of ratio of exports plus imports to GDP
FDI over GDP rate: logarithm of ratio of foreign direct investment inflows to GDP.
Policy zone : we use the description of policy zones (special economic zones, economic and technological development zones, high tech industrial zones, and export processing zones) at the prefecture level (which varies across time) developed by Wang and Wei (2010) to build two measures. At the prefecture level, we construct an economic zone dummy that takes the value of one when the prefecture hosts a policy zone in 1997. At the province level, we build a time-varying measure of the number of policy zones in a province.
Coastal province dummy: dummy is one when the location lies on the coast (i.e. Fujian, Guangdong, Guangxi, Hebei, Jiangsu, Liaoning, Shandong, Shanghai, Tianjin and Zhejiang).