HAL Id: hal-02565775
https://hal.archives-ouvertes.fr/hal-02565775
Submitted on 31 Oct 2020HAL is a multi-disciplinary open access archive for the deposit and dissemination of sci-entific research documents, whether they are pub-lished or not. The documents may come from teaching and research institutions in France or abroad, or from public or private research centers.
L’archive ouverte pluridisciplinaire HAL, est destinée au dépôt et à la diffusion de documents scientifiques de niveau recherche, publiés ou non, émanant des établissements d’enseignement et de recherche français ou étrangers, des laboratoires publics ou privés.
To cite this version:
Estelle Porret, Muriel Jourdan, Béatrice Gennaro, Clothilde Comby-Zerbino, Franck Bertorelle, et al.. Influence of the Spatial Conformation of Charged Ligands on the Optical Properties of Gold Nanoclusters. Journal of Physical Chemistry C, American Chemical Society, 2019, 123 (43), pp.26705-26717. �10.1021/acs.jpcc.9b08492�. �hal-02565775�
Investigation of the Spatial Organization of Charged Ligands on the
Optical Properties of Gold Nanoclusters
Estelle Porret1, Muriel Jourdan2, Beatrice Gennaro2, Clothilde Comby-Zerbino3, Franck Bertorelle3, Vanessa Trouillet4, Xue Qiu5, Claude Zoukimian2, Didier Boturyn2, Niko Hildebrandt5, Rodolphe Antoine3, Jean-Luc Coll1*, Xavier Le Guével1*
1Cancer Targets & Experimental Therapeutics, Institute for Advanced Biosciences (IAB), University of
Grenoble Alpes (UGA)/ INSERM-U1209 / CNRS-UMR 5309- Grenoble, France
2 Univ. Grenoble Alpes, CNRS, DCM UMR 5250, F-38000 Grenoble, France
3Institut lumière matière, UMR5306, Université Claude Bernard Lyon1-CNRS, Université de Lyon 69622
Villeurbanne cedex, France
4Institute for Applied Materials (IAM) and Karlsruhe Nano Micro Facility (KNMF),
Karlsruhe Institute of Technology (KIT), Eggenstein-Leopoldshafen, Germany
5NanoBioPhotonics, Institute for Integrative Biology of the Cell (I2BC), Université Paris-Saclay,
Université Paris-Sud, CNRS, CEA, 91400 Orsay, Franc
ABSTRACT
Photoluminescent gold nanoclusters (Au NCs) were synthesized in one step in aqueous conditions using a mixture of glutathione and (mono or multivalent) glutathione modified arginine peptides. By controlling the ratio of co-ligands, we investigated how the multivalency and the amount of arginines influenced the growth of Au NCs, their surface chemistry, their colloidal stability, and their optical properties. We demonstrated using two-dimensional nuclear magnetic resonance spectroscopy that the organisation of the ligand on the Au surface was composed by an inner rigid layer and an outer flexible part via inter- and/or intra-ligand spatial proximity. This directly impacted the structure of the Au NCs, as confirmed by gel electrophoresis, high transmission electron microscopy, diffusion ordered
3 4 5 6 7 8 9 10 11 12 13 14 15 16 17 18 19 20 21 22 23 24 25 26 27 28 29 30 31 32 33 34 35 36 37 38 39 40 41 42 43 44 45 46 47 48 49 50 51 52 53 54
nanoclusters (NCs),[15] and represent a link between metal complexes and plasmonic NPs.
The common method to synthesize thiolated metal NCs in solution is based on the reduction of metal precursors in the presence of thiol ligands. Depending on the experimental conditions and the nature of the ligand, it can lead to i) NCs with atomically precise composition,[10] described by their formula MnSRm, where n and m are the respective numbers of metal atoms (M) and thiol ligands (SR), or to ii) NCs with broader size, corresponding to sub-nanometer NPs with a core size below 3 nm [16].
Due to their ultra-small size approaching to the Fermi wavelength of electrons, NCs exhibit discrete electronic states leading to tunable photoluminescence (PL) from the ultra-violet (UV) to the near infrared (NIR) wavelength regions. NCs could be produced with high colloidal stability in aqueous environment,[16] which makes them interesting candidates for bioimaging applications.[17] These species exhibit a very high surface reactivity due to the high surface to volume aspect ratio. Several research groups demonstrated that the PL signal of gold NCs (Au NCs) is originated from the simultaneous contributions of the metal core[5] and ligand coverage[18,19]. Despite extensive investigations over the past 10 years to identify the mechanisms involved in the PL of the Au NCs,[20] there are still some missing links to understand the exact role of the nature of the ligand on the optical properties of Au NCs.
In this work, we investigate how increasing the quantity of charged ligands affect the growth, ligand shell organisation, colloidal stability and PL of Au NCs.
Negatively charged Au NCs were synthesized using the tripeptide glutathione (SG) due to the presence of two carboxylic groups (acidic dissociation constant values, pKa~2). SG has been widely employed to synthesize atomically precise NCs.[10,21] To generate neutral and positive Au NCs, we used a mixture of co-ligands during the growth of the Au NCs[4,22] : SG and glutathione modified with one (SG-1Arg), two (SG-2Arg) or three (SG-3Arg) arginines. A set of 13 Au NCs with controlled charged was achieved by changing the ratio of glutathione and glutathione modified arginine peptides (SG/SG-XArg : 0/100, 65/25, 50/50, 25/75 and 100/0) during the synthesis of the Au NCs (Scheme 1).
First, we analysed the surface charge and PL of the 13 types of Au NCs. Then, we selected the five different Au NCs, namely AuSG, AuSG-1Arg, AuSG-2Arg, AuSG/SG-3Arg (ratio 25/75 %) and AuSG-3Arg which presented the most significant changes to conduct a deeper understanding of the effect of arginine multivalence (X= 1, 2 or 3) and concentration on the structure, colloidal stability and PL properties of Au NCs, using a complete characterization by spectroscopic and physicochemical techniques.
Increasing the amount of arginines during the synthesis of Au NCs led to PL enhancement and higher colloidal stability until to reach a threshold, at which growth of monodisperse Au NCs was not controlled anymore. 10 11 12 13 14 15 16 17 18 19 20 21 22 23 24 25 26 27 28 29 30 31 32 33 34 35 36 37 38 39 40 41 42 43 44 45 46 47 48 49 50 51 52 53 54 55 56 57 58 59 60
Scheme 1. Synthesis route of Au NCs with SG and SG-XArg peptides.
1. MATERIALS AND METHODS
1.1. Materials
Arginine modified-glutathione peptides (SG-1Arg=C16H29N7O7S(CF3COO-), SG-2Arg=C22H40N11O8S (CF3COO-)2, SG-3Arg=C28H53N15O9S(CF3COO-)3 with 10 % of H2O and purity ≥ 95%) were purchased from GenScript (USA). Gold(III)chloride trihydrate (HAuCl4·3H2O, reagent grade), reduced L-glutathione (C10H17N3O6S, ≥98%), sodium borohydride (NaBH4), tetramethylammonium borohydride ((CH3)4NBH4), isopropyl alcohol (IPA, 99%) and 4-(Dicyanomethylene)-2-methyl-6-(4dimethylaminostyryl)-4H-pyran (DCM dye) were purchased from Sigma-Aldrich (France). Sodium hydroxide (NaOH, 98%) and hydrochloric acid (HCl, 35−37%), were purchased from Laurylab and VWR Chemicals BAH. Tris(hydroxymethyl)aminoethane (tris base, ≥99%), glycine (≥99%), acrylamide:bis-acrylamide (29:1) and agarose were purchased from Euromedex. Phosphate buffer (PBS, 10mM) were purchased from Gibco (Thermofisher, France) and formvar carbon grid from Agar scientific. All the chemicals were used as received without further purification. Water was purified using a Millipore Milli-Q system (Millipore, France).
1.2. Synthesis
1.2.1 Synthesis of Au NCs with co-ligands
The synthesis was achieved by adapting the protocol of Kyunglim Pyo et al.[23] on Au22SG18 with our ligands. A set of 13 types of Au NCs was prepared by mixing glutathione (SG) and glutathione modified
3 4 5 6 7 8 9 10 11 12 13 14 15 16 17 18 19 20 21 22 23 24 25 26 27 28 29 30 31 32 33 34 35 36 37 38 39 40 41 42 43 44 45 46 47 48 49 50 51 52 53 54
become turbid and then centrifugated (1 000 rpm, 2 min). Supernatant was centrifuged twice (2 000 rpm, 2 min on a HERAEUS Muktifuge X3R, Thermo Scientific) to recover more Au NCs. The precipitate was re-solubilised in water and adjust to pH 7 before to be lyophilized.
The same procedure was applied to synthesize the others Au NCs by changing the ratio of ligands during the growth of the Au NCs.
1.2.2 Synthesis of Au25SG18
Au25SG18 were synthesized following the protocol in the Soleilhac et al.[24] study. Briefly, HAuCl4 and SG (Au:SG= 1:3) were reduced in a methanolic solution with tetramethylammonium borohydride ((CH3)4NBH4) in two steps. The product was collected after precipitation by adding methanol and centrifugate (3 times) before to be lyophilized. The physico-chemical and optical characterizations confirmed the production of Au25SG18 (Figure S1).[10,20,25]
1.3. Instrumentation
1.3.1 Chemical measurements
For the polyacrylamide gel electrophoresis (PAGE) experiments, separative and staking gels were prepared with total contents of acrylamide:bis-acrylamide of 25 and 2.5 % respectively. The eluting buffer consisted of 14.4 g of glycine and 3 g of tris(hydroxymethyl)aminoethane diluted in 100 mL of water and adjusted at pH 7. Samples were prepared by adding 2 L of glycerol to 20 L of Au NCs (4 mgAu/mL) before to deposit them in a well (15 L per well). The gel was run with a Mini PROTEAN Bio-Rad (Hercules, CA, USA) equipment at 150 V for 1 or 4 hours for positive and negative migrations respectively.
The same eluting buffer and samples preparation were used for the Agarose gel at 4%. The gel was run with GelXC Enduro (TM Labret International.Inc) equipment at 100 V for 30 min.
Zeta potential measurements of Au NCs solution were performed on a Zetasizer (Malvern). Measurements were performed in triplicate at 25°C. For water, 1.33 and 0.89 mPa.s were taken as refractive index and viscosity values.
Mass spectrometry measurements were collected with an electrospray ionization (ESI-MS) on a commercial quadrupole time-of-flight (micro-qTOF, BrukerDaltonics, Bremen, Germany). Isotope-resolved mass spectrum were recorded using the ultra-zoom scan mode of the instrument. The collision-induced dissociation (CID) was performed using helium gas at a normalized collision energy of 12% for 30 ms. External calibration was carried out with a set of synthetic peptides. Sample were diluted at a concentration around 0.5 mgAu/mL in H2O/MeOH (50/50%), electrospray at a flow rate of 10 L/min with a spray voltage of -3kV and a capillary temperature of 100°C. Other instrument settings were adjusted for each species to optimize the distribution of charges states observed in the mass spectrum. Each measurement was registered in negative and positive mode and was the summation of spectra over 5 min. If the distribution of charge states is too dense on the ESI-MS spectra, to estimate the mass of the Au NCs the signal could be deconvoluted using a multiplicative correlation algorithm :
10 11 12 13 14 15 16 17 18 19 20 21 22 23 24 25 26 27 28 29 30 31 32 33 34 35 36 37 38 39 40 41 42 43 44 45 46 47 48 49 50 51 52 53 54 55 56 57 58 59 60
f(m)=∏𝑍1 /grms
𝑍 = 𝑍0𝑔( 𝑚
𝑧)
where f(m) is the intensity calculated in the spectrum for mass m, g(m/z) is the intensity in the mass-to charge spectrum, and grms is the root-mean-square (rms) value of the signal measured.
High resolution transmission electron microscopy (HRTEM) images were measured on a JEOL 2010 LaB6 microscope operating at 200 kV with a 0.19 nm point-to-point resolution, after the deposition of the Au NCs (10 L, 4 mgAu/mL) on a formvar carbon grid. The images collected were analysed with ImageJ software.
Nuclear magnetic resonance spectroscopy (NMR) experiments were carried out at 298 K with a Bruker AVANCE III 500 MHz spectrometer equipped with a cryo-probe Prodigy. For each sample the concentration was ~2 mM in D2O and pH 7. Diffusion ordered NMR spectrocopy (DOSY) experiments were run using the standard “ledbpg2s” Bruker sequence with linear gradient stepped between 2% and 98%. 32 scans were recorded for each gradient step. Data processing were performed using the maximum entropy algorithm from Dynamics Center, a Bruker’s NMR software to obtain the diffusion coefficient D. An average value of D was used for the hydrodynamic diameter (HD) calculation according to the Stokes-Einstein equation which assumes that molecules are spherical :
HD = kBT/ 3Dπη
where kB is the Boltzmann constant, T is the temperature, η is the viscosity of the solvent (ηD2O = 1.232
10-3 Pa.s at 298K). Standard 1D and 2D (NOESY, COSY, TOCSY and HSQC) spectra were recorded using standard presaturation on the water signal.
X-ray photoelectron spectroscopy (XPS) analysis was performed in a K-Alpha+ spectrometer (ThermoFisher Scientific) using a micro-focused, monochromated Al Kα X-Ray source (400 m spot size). Data acquisition and processing using the Thermo Avantage software is described elsewhere.[26] The K-Alpha+ charge compensation system was employed during analysis, using electrons of 8 eV energy, and low-energy argon ions to prevent any localized charge build-up. The spectra were fitted with one or more Voigt profiles (binding energy uncertainty +/- 0.2 eV) and Scofield sensitivity factors were applied for quantification[27]. All spectra were referenced to the C 1s peak at 285.0 eV binding energy (C-C, C-H) and controlled by means of the well-known photoelectron peaks of Cu, Ag and Au, respectively. Measurements were performed at different locations of the solid and with different series of samples.
The powder product was characterized by elemental analysis (C, H, N) on an automatic analyser created by the SCA (Service Central d’Analyse) with detection limits in the range of 20-100%, 0.3-17% and 0.3-40% for the carbon, hydrogen and nitrogen respectively. Each experiment was repeated independently three times for each sample.
To remove the presence of salt that could perturbate the characterizations by elemental analysis and ESI-MS, Au NCs were further purified by diluted Au NCs in an ammonium acetate solution (1M) and filter several times to reach a final concentration of 10 nM by using Vivaspin column (Satorius, 10 kDa cutoff filters). 3 4 5 6 7 8 9 10 11 12 13 14 15 16 17 18 19 20 21 22 23 24 25 26 27 28 29 30 31 32 33 34 35 36 37 38 39 40 41 42 43 44 45 46 47 48 49 50 51 52 53 54
QY = QYref 2 2 𝑟𝑒𝑓 𝐼 𝐼𝑟𝑒𝑓 𝐴𝑟𝑒𝑓 𝐴 where
QYref = quantum yield of the reference DCM dye (QY = 44%, em. = 615 nm, in methanol), η = refractive index of H2O (1.333)
η ref = refractive index of MeOH (1.326)
I = integration of the emission spectra for the sample I ref = integration of the emission spectra for the DCM dye
A = optical density (0.05 OD at λexc. = 410 nm for the sample and the reference).
Fluorescence lifetime measurements were recorded with a fluorescence plate reader (Edinburgh Instruments) in the time correlated single photon counting (TCSPC) mode with 4096 detection bins. Samples were excited at 405 nm (EPL-405 laser from Edinburgh Instruments) operating at 50 kHz and a dichroic long pass beam splitter of 552 nm and 660/14 nm optical bandpass filter (Semrock) were used to select the emission of Au NCs.
Decay curves were fit using Fast (version 3.1.1) software from Edinburgh Instruments to triexponential decays, using the following equation:
I(t) = a ∑3 i exp(- - )
𝑖 = 1𝐴
𝑡
𝑖
where
τi = decay times
a = preexponential amplitude factor
Ai = amplitude fractions of the individual components (∑Ai = 1)
Intensity-averaged decay times were calculated using the following equation: = ii
〈
𝑎𝑚𝑝〉
∑3𝑖 = 1𝐴2. RESULTS
2.1. Surface charge effects
The average charge of each 13 types of Au NCs can be predicted theoretically by using the pKa values of the carboxylic and amine groups of the different amino acids. We assumed the generation of Au NCs stabilized by 18 ligands because we used a similar protocol for the production of Au22SG18 described by Pyo et al.[23], (see Figure S2 for the calculation details at pH 7-8). In agreement with the increased amount of arginine moieties containing amine groups (pKa~12), the Au NCs shifted from negatively to positively charged as shown in Figure 1A.
The evolution of the charge was experimentally estimated with agarose gel and eluting buffer at pH 7 under white and UV lights (Figure 1B). While Au NCs with solely SG ligand moved to the cathode indicating their negative charge, increasing the quantity of SG-XArg as co-ligand on Au NC surface led to a shift to the anode confirming the presence of positively charged NCs. This effect was more pronounced with co-ligand in the order SG-1Arg< SG-2Arg<SG-3Arg.
10 11 12 13 14 15 16 17 18 19 20 21 22 23 24 25 26 27 28 29 30 31 32 33 34 35 36 37 38 39 40 41 42 43 44 45 46 47 48 49 50 51 52 53 54 55 56 57 58 59 60
Surface charges of the Au NCs in water at different pH were measured by zeta potential (). As expected, the zeta potential values decreased when the pH increased from 2 to 12 (Figure 1C) due to the de-protonation of the carboxylic groups. At pH 7, the zeta potential values agreed with the agarose gel (Table 1). Indeed, Au NCs with a full coverage of SG or SG-1Arg were negatively charged while Au NCs with at least 75% of SG-2Arg or 75% of SG-3Arg were positively charged.
Figure 1. (A) Theoretical charge values of the Au NCs at pH 7-8. (B) Agarose gel at pH 7 of concentrated Au NCs solution (4 mgAu/mL) under UV (exc.= 366 nm; above) and white (below) lights. (C) Zeta potential measurements of diluted Au NCs solution (0.04 mgAu/mL) in PBS buffer at pH from 2 to 12. We observed also different charge states in ESI-MS spectra, as displayed in Table 1. Clearly the average charge state <z> in positive mode of ionization increased with the number of arginines in the peptide, while in negative mode of ionization <z> slightly decreased until it was not possible to obtain any MS signal for AuSG-2Arg and AuSG-3Arg. We were not be able to deconvolute the signal coming from Au NCs with a mix of ligands (SG/SG-3Arg) in both ionization modes, due to the complexity of the multiplicative correlation algorithm. ESI-MS analysis again demonstrated that the zeta potential of Au NCs in solution were correlated with the average values of charge of Au NCs ionized by electrospray in gas phase.[28,29] 3 4 5 6 7 8 9 10 11 12 13 14 15 16 17 18 19 20 21 22 23 24 25 26 27 28 29 30 31 32 33 34 35 36 37 38 39 40 41 42 43 44 45 46 47 48 49 50 51 52 53 54
Table 1 : The average charge state (<z>) extracted in positive and negative modes of ionization by ESI-MS and zeta potential values associated (H2O, pH 7). <z> is calculated from the observed charge state distribution in ESI-MS spectra (plotted in m/z).
2.2 Optical properties
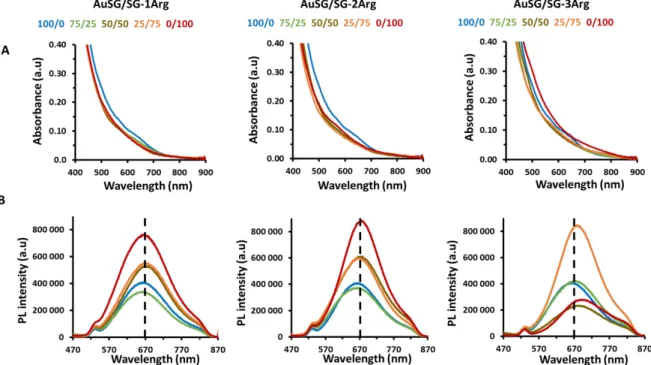
The absorption spectra of the Au NCs in water (pH 7.0; 0.4 mgAu/mL) illustrated in Figure 2A showed the typical profile of Au NCs with an exponential decay from the UV to the NIR region, with weak bands at 530 nm and 710 nm. The surface plasmon band at 520 nm of spherical gold nanoparticles (>10 nm) was absent of all the spectra. A slight overall increase in absorbance was observed for the sample AuSG-3Arg NCs.
PL measurements of diluted Au NCs in water (pH 7.0) at the same optical density (abs. = 450 nm, 0.04 OD) are illustrated in Figure 2B. The PL spectra showed broad emission between 570 and 860 nm with a maximum at em.~ 670 nm, similar to the PL spectrum of the Au22SG18 described in literature [23,30]. The nature of the ligands clearly influenced the PL intensity and emission wavelengths of the Au NCs (Table 2). A global red shift (~30 nm) of the PL emission maxima was observed between AuSG (em. = 662 nm) and AuSG-3Arg NCs (em. = 693 nm). For Au NCs stabilized by a mix of 1Arg or SG/SG-2Arg, the PL intensity progressively increased with the quantity of SG-XArg used during the synthesis. A respectively 2- and 2.3-fold enhancement was observed between AuSG-1Arg and AuSG-2Arg NCs compared to AuSG. However, it was not the case for Au NCs stabilized by a mix of SG/SG-3Arg. The PL signal dropped (3-fold) between the ratio SG/SG-3Arg : 25/75 and 0/100 (%).
Figure 2. (A) Absorbance spectra of Au NCs in water (0.4 mgAu/mL, pH 7.0) between 400 and 900 nm. (B) PL spectra of diluted Au NCs in water (0.04 mgAu/mL, pH 7.0) at the same optical density (0.04 OD) between 470 and 870 nm (exc. = 450 nm).
10 11 12 13 14 15 16 17 18 19 20 21 22 23 24 25 26 27 28 29 30 31 32 33 34 35 36 37 38 39 40 41 42 43 44 45 46 47 48 49 50 51 52 53 54 55 56 57 58 59 60
Quantum yield (QY) measurements confirmed the modification of the PL intensity with the nature of the ligand (Table 2). This led to an increase of QY with the number of arginine up to 10.2% for AuSG-2Arg and then a fall to 2.5% for AuSG-3Arg. We obtained a QY of 3.4% for the AuSG NCs, which is lower than the values found for the Au22SG18 in the literature between 7%[23] and 8%[30]. This could be explained by the use of a different dye reference, DCM dye [31] instead of Rhodamine B[23] or Rhodamine 6G [30].
The excitation spectra of the Au NCs were similar to the absorption spectra with two additional excitation peaks at 400 and 470 nm (Figure S3), which have been attributed to intra- and inter-electronic transitions in the Au-core or between the ligands and the Au-core in the case of Au25SG18.[20].
PL decay time measurements were recorded in water at exc. = 405 nm (Table2, Figure S4). The decays curves were fit with three-exponential decays composed of two short decays with 1 ~63-78 ns (60%) and 2~469-640 ns (30%) and a smaller fraction of long decay with 3~2.09-2.53 s (10%). Increasing the number of arginine in the ligand led to an increase in the amplitude-averaged lifetime from 438 ns to 604 ns between AuSG and AuSG-2Arg, before to decrease at 410 ns for AuSG-3Arg NCs (Table 2).
Table 2. Optical properties of Au NCs stabilized by a full coverage of SG, SG-1Arg, SG-2Arg, SG-3Arg and the mix SG/SG-3Arg (25/75 %).
2.3 Colloidal Stability
As illustrated in Figure 3A, Au NCs dispersed in PBS at pH 7.0 under UV light confirmed the weak PL of the AuSG-3Arg and showed that Au NCs remained without any precipitation for at least 1 month at 4°C. The stability of these Au NCs in PBS in a wide pH range from 3 to 10 was also evaluated (Figure S5). For freshly prepared solutions, the main emission PL increased (Figure 3B) and blue shifted (~10 nm, Figure 3C) at higher pH, independent of the arginine content on Au NCs. After one month of storage time (Figure S6) Au NCs did not show significant PL changes at pH 7.0 (decrease of less than 30% for AuSG, AuSG-1Arg, AuSG-2Arg and AuSG/SG-3Arg and around 40% for AuSG-3Arg). Over time, the Au NCs stabilized by SG-XArg had similar behaviour and reached the same value independently of the pH conditions. The AuSG seemed less stable due to the higher difference of PL intensity in function of the pH after one month of storage.
3 4 5 6 7 8 9 10 11 12 13 14 15 16 17 18 19 20 21 22 23 24 25 26 27 28 29 30 31 32 33 34 35 36 37 38 39 40 41 42 43 44 45 46 47 48 49 50 51 52 53 54
Figure 3. Evaluation of the optical stability of Au NCs in PBS (0.4 mgAu/mL) at different pH (3-10) stabilized by a full coverage of SG, SG-1Arg, SG-2Arg, SG-3Arg and the mix SG/SG-3Arg (25/75 %). (A) Photos of Au NCs freshly prepared or after one month of storage at pH 7.0 and 4°C under white (left) or UV (exc.= 366 nm; right) lights. (B) Evolution of the PL intensity (max.) and (C) shift of the PL emission peak of Au NCs freshly prepared as a function of the pH from 3 to 10.
2.4. Au NC size
The metal core sizes determined by HRTEM (Figure 4) showed diameters below 3 nm with an apparent semi crystalline structure. The metal core size was more monodisperse when stabilized by SG or SG-1Arg rather than SG-2Arg or SG/SG-3Arg. Interestingly the HRTEM images of AuSG-3Arg showed the presence of bigger species (>10 nm, NPs), that were probably at a concentration too low to be detected by absorption spectrometry.
Figure 4. HRTEM of Au NCs stabilized by a full coverage of (A) SG, (B) SG-1Arg and (C) SG-2Arg (scale bars: 20 nm) or (D) SG/SG-3Arg (25/75 %) and (E) SG-3Arg (scale bars: 50 nm).
10 11 12 13 14 15 16 17 18 19 20 21 22 23 24 25 26 27 28 29 30 31 32 33 34 35 36 37 38 39 40 41 42 43 44 45 46 47 48 49 50 51 52 53 54 55 56 57 58 59 60
Acrylamide gels performed at pH 7 (Figure S7) enabled the discrimination of Au NCs present in each sample using Au25SG18 as reference. For AuSG, a bright orange luminescence band was observed under UV light similar to Au22SG18 in literature.[23,30,32] The wider band for AuSG compared to Au25SG18 suggested a broader size of AuSG NCs. AuSG-1Arg showed similar luminescence bands towards the anode indicating that these species present either higher molecular weight and/or stronger positive charge due to the addition of the arginines (Figure S7A). For positively charged Au NCs (SG-2Arg, SG/SG-3Arg and SG-3Arg) the bright orange luminescence band was still present with an additional weakly fluorescent brown band which migrates less into the gel. For the AuSG-3Arg NCs a sharp band stayed in the deposit well and was not detected under UV illumination probably related to the presence of few Au NPs in the sample (Figure S7B). This is furthermore in agreement with results obtained by HRTEM.
The average molecular weight of the Au NCs could be theoretically predicted assuming the synthesis of single species Au22SGxSG-XArg18-x. Mass measurements of the Au NCs in water were obtained by ESI-MS in both positive and negative mode of ionization. Due to the zwitterionic ligands, a multiplicity of charge states was observed in the mass-to-charge spectrum, given rise to an “envelope” of peaks in the 800-3 000 or 1 000-4 000 m/z range after electrospray in positive or negative mode, respectively (see Figure S8 for all the spectra). For AuSG atomically precise NCs size could be identified, such as Au15-20SG13-16 (6 937 - 9 541 Da). A transition between atomically precise NCs size (Au15-21SG-1Arg13-18 ; 8 967 - 12 461 Da) and NCs with broader size dispersion occurred for AuSG-1Arg (see ESI-MS in positive in Figure S8). The set of peaks was too broad in the case of AuSG-2Arg and AuSG-3Arg. The use of a multiplicative correlation algorithm was required to deconvolute the signal with the aim to give an estimation of the Au NCs mass. For AuSG-2Arg and AuSG-3Arg the distribution was centred at 13 000 Da and 19 000 Da respectively. Since SG-XArg ligands present both acidic and basic components, it is possible that by increasing the number of Arg residue, few additional ligands could bond electrostatically on the surface of NCs. These additional ligands led to a broader range of cluster composition and thus a large mass (and thus size) dispersion. However, the average molecular weight of Au NCs obtained by mass spectrometry agreed with the predicted values (Table 3) and increased with the size of the ligand. Of note the calibration was optimized for the NCs and did not allow to detect the presence of NPs.
The size distribution of the five types of Au NCs measured by DOSY (diffusion ordered spectroscopy) in D2O showed an increase of the hydrodynamic diameter (HD) with the size of the ligands from 1.66±0.01 nm to 2.02±0.02 nm between AuSG and AuSG-2Arg (Table 3). An additional arginine in the peptide (SG-3Arg) did not further influence the HD. We also observed the existence of a second smaller species (~0.6 nm) that we attributed to the presence of free ligands. Regarding AuSG-3Arg, the concentration of bigger particles with size over 10 nm measured by HRTEM was probably too low to be detected by NMR. 3 4 5 6 7 8 9 10 11 12 13 14 15 16 17 18 19 20 21 22 23 24 25 26 27 28 29 30 31 32 33 34 35 36 37 38 39 40 41 42 43 44 45 46 47 48 49 50 51 52 53 54
Table 3. Size of the Au NCs stabilized by a full coverage of SG, SG-1Arg, SG-2Arg, SG-3Arg and SG/SG-3Arg (25/75 %) determined theoretically (* considering Au22SGxSG-XArg18-x as main Au NCs population), by mass spectrometry ( unassigned peak in ESI-MS spectra, Figure S8) and by DOSY-NMR.
2.5. Ligand coverage
Figure 5. Representation of observed NOE (red arrows) between protons of the SG part (H3 and H4) and protons of arginine (H and H) when the ligands are covalently bound to the Au-core. The light red arrow represents NOE that could not be excluded but that are highly unlikely.
NMR spectroscopy was performed on Au NCs in order to get qualitative structural information about the position of the ligands on Au NC surface. The 1H assignment of the ligands SG, SG-1Arg, SG-2Arg, SG-3Arg and of AuSG-1Arg, AuSG-2Arg, AuSG-3Arg and AuSG/SG-3Arg was performed using a set of 1D and standard 2D NOESY, COSY and HSQC experiments. When covalently bound to the Au-core, the SG-1Arg, SG-2Arg and SG-3Arg fold like tweezers as weak to medium NOE (nuclear Overhauser effect) cross-peak were detected between protons of the SG part (H3 and H4) and the H and H protons of
10 11 12 13 14 15 16 17 18 19 20 21 22 23 24 25 26 27 28 29 30 31 32 33 34 35 36 37 38 39 40 41 42 43 44 45 46 47 48 49 50 51 52 53 54 55 56 57 58 59 60
some arginine (see Figure 5 and S9-S12). These NOE peaks were totally absent in the spectra of the free ligands, which rather adopted a linear conformation (Figure S13, only data for AuSG-3Arg are presented as other spectra are similar). For AuSG-1Arg, weak NOE peaks were detected between H3 (less intense for H4) and the H and H protons of the Arg-c. For AuSG-2Arg the chemical shifts of the two H of the arginine Arg-c and Arg-t were clearly distinct and the NOE peaks were detected only between H3 (less intense for H4) and the H and H protons of the Arg-c. No NOE peaks were detected between H3 and H4 and Arg-t. For AuSG-3Arg and AuSG/SG-3Arg the Arg-t had an H chemical shift (and H and H distinct from the two others and again NOE peaks were detected between H3 (to a less extent H4) and H H and H protons of Arg-c but we could not exclude that some NOE occurs with Arg-m as H H and H overlapped with those of Arg-c. However, because no NOE peaks were detected between H3 and Arg-t in AuSG-2Arg, we could reasonably hypothesize that no NOE occurs between H3 and Arg-m for AuSG-3Arg and AuSG/SG-3Arg.
Thus, the terminal arginine chain Arg-t in the case of AuSG-2Arg (the two arginines chains Arg-m and Arg-t in the case of AuSG-3Arg and AuSG/SG-3Arg) are rather packed at the outer surface of the Au cluster. In contrary, the Arg-c is close to the glutathione part in all the clusters and forms the inner layer. It is noteworthy that we were not able to distinguish and specify if the NOE are observed between inter- or intra-ligands. Moreover, as the size of the Au-NCs increased (from AuSG-1Arg to AuSG-3Arg) the NOE peaks between the glutathione part (H3 and H4) and the arginine became more intense while levelling off and broadening for AuSG-3Arg and AuSG/SG-3Arg (Figure S9-S12). This indicates a tighter position between the ligands.
Therefore, from the ESI-MS and NOESY measurements, we could hypothesize the geometrical organization of the ligand shell stabilizing Au NCs in the following Scheme 2.
Scheme 2. Scheme of the hypothetical geometrical organisation of the ligands (SG and SG-XArg peptides) at the surface of the Au-core. Arg-t (in AuSG-2Arg), Arg-m and Arg-t (in AuSG-3Arg and AuSG/SG-3Arg) are flexible (illustrated by curved lines and arrows) and are excluded from the inner shell. 3 4 5 6 7 8 9 10 11 12 13 14 15 16 17 18 19 20 21 22 23 24 25 26 27 28 29 30 31 32 33 34 35 36 37 38 39 40 41 42 43 44 45 46 47 48 49 50 51 52 53 54
the presence of glutathione and arginine is proven by the peak at 400.1 eV stemming from the amide and amine groups as well as by the component at 401.8 eV attributed to the protonated nitrogen mainly due to the presence of protons in the solution (pH= 2). The nitrogen-to-thiolate ratio increased with the number of arginine introduced in agreement with the theoretical values (Figure 6B). We confirmed this trend by elemental analysis measurement, as well as the increase of concentration in carbon and hydrogen with the quantity of arginines used to synthesize the Au NCs (Figure 6C, D, E). Theoretical values were calculated assuming the production of Au22SGxSG-XArg18-x (Figure S14).
Figure 6. Theoretical value (red) and data extracted from XPS spectra (black) of the Au NCs stabilized by a full coverage of SG, SG-1Arg, SG-2Arg, SG/SG-3Arg and SG-3Arg for thiolate-to-gold ratios (A) and nitrogen-to-thiolate ratios (B). 5% of the measurement was taken as error bar. Theoretical values (red) and data extracted from elemental analysis (black) of concentration (%) in carbon (C), hydrogen (D) and nitrogen (E) in Au NCs samples stabilized by a full coverage of SG, SG-1Arg, SG-2Arg, SG-3Arg and SG/SG-3Arg (25/75 %). Standard deviation was taken as error bar.
10 11 12 13 14 15 16 17 18 19 20 21 22 23 24 25 26 27 28 29 30 31 32 33 34 35 36 37 38 39 40 41 42 43 44 45 46 47 48 49 50 51 52 53 54 55 56 57 58 59 60
3. DISCUSSION
Despite evidences of the pivotal role of the surface ligands on the optical properties of Au NCs, the organization of the ligand shells has not been fully understood. In this study, we investigated the impact of ligand charges and organisation to their growth, colloidal stability, and optical properties by using the tripeptide glutathione (SG) and glutathione modified with 1, 2 or 3 arginines (1Arg, SG-2Arg, SG-3Arg) as stabilizing agents. We synthesized 13 types of NCs with different charges by varying the ratio of co-ligands (SG/SG-XArg = 0/100, 65/25, 50/50, 25/75 and 100/0) during the growth of the Au NCs.We first characterized the 13 Au NCs using spectroscopic and physicochemical measurements before focusing on five representative types of Au NCs for an in-depth analysis to provide new insights on the ligand organization on the surface of Au NC.
3.1. Surface charge
Electrophoresis gels (agarose and acrylamide, respectively Figure 1B and S7), zeta potential (Figure 1C) and the average charge state <z> (Table 1) measurements confirmed the increase of positive charges on Au NCs with the amount of arginine in agreement with the theoretical values (Figure 1A and S2). The evaluation of the impact of the Au NCs stability revealed an enhancement of the emission and a blue shift of the main emission with increasing pH (Figure 3B and C). Theoretical (Figure S2) and experimental values of the pKa of Au NCs as a function of the amount of arginine clearly indicated that we could tailor precisely the overall surface charge of Au NCs.
3.2. Ligand effect on NC’s size
The use of different amounts and multivalency of arginine during Au NC synthesis had a significant impact on the growth of the Au NCs. Clearly AuSG NCs (expected to be Au22SG18) displayed mass spectra that were typical of NCs obtained at atomic precision, such as our reference (Au25SG18). On the other hand, AuSG-2Arg and AuSG-3Arg displayed mass spectra with a quite broad molecular weight distribution. And AuSG-1Arg NCs displayed mass spectra that combines both behaviours (Figure S8). Such broad molecular weights distribution in mass spectra were already reported for zwitterion-liganded NCs,[28,33,34] and generally attributed to the extra additions of ligands (bond electrostatically) on the surface of NCs. In our case, this few additional ligands that occurred between AuSG-1Arg and AuSG-2Arg led to a broad range of cluster size. HRTEM (Figure 4) and acrylamide gel (Figure S7) confirmed the presence of more monodisperse Au NCs stabilised by SG and SG-1Arg rather than SG-2Arg, SG/SG-3ARg and SG-3Arg. It should be noted that using a peptide with high number of arginines (SG-3Arg) led to bigger species, most probably related to the difficulty of controlling Au NCs involved in multiple electrostatic interactions. All these results suggested the presence of more than one species for each Au NCs synthesized in our study, which is in agreement with the absence of specific absorption bands of atomically precise NCs (Au15SG13, Au18SG15, Au22SG18)[10] in the absorption spectra (Figure 2A).
For AuSG, AuSG-1Arg, AuSG-2Arg and AuSG/SG-3Arg, a metal core size (<3 nm) evidenced by HRTEM and the thiol-to-gold ratio determined by XPS (Figure 6A) indicated both that Au NCs are probably stabilized by almost the same number of ligands. However, the overall size of the ligand increased with the number of arginine as followed SG<SG-1Arg<SG-2Arg. This suggests an enhancement of the density within the organic shell.
In order to get a deeper insight into the effect of the amount and multivalency of arginine on the
3 4 5 6 7 8 9 10 11 12 13 14 15 16 17 18 19 20 21 22 23 24 25 26 27 28 29 30 31 32 33 34 35 36 37 38 39 40 41 42 43 44 45 46 47 48 49 50 51 52 53 54
All Au NCs displayed PL in the orange-red wavelength range with a maximum between 662 and 693 nm and a large Stokes shift (> 300 nm). Thiolate-to-gold ratio and electrophoresis mobility properties showed similar patterns to the ones obtained with Au22SG18,[23,30,32] despite the presence of more than one species for each Au NC.
We observed a significant enhancement of the intensity and a red-shift of the PL emission at pH 7.0 with the amount of arginine on Au NCs with QYs increasing from 3.8 % for AuSG to 10.2 % for AuSG-2Arg (Figure 2B and Table 2). Based on the relatively good colloidal stability of the AuSG-XArg over a month of storage in PBS at pH 7 (Figure S5, S6), we could exclude that this enhancement of PL originated from Au NC aggregation. A PL enhancement related to the metal core size, so-called quantum confinement phenomenon (Au-Au transitions), is also unlikely to happen in our case due to the obtention of similar Au NCs core size determined by HRTEM.[16] The HD of the Au NCs increased with the number of arginine per ligands before reaching a maximum with AuSG-2Arg (Table 3). Thus, PL enhancement was most likely not induced by the formation of supramolecular assembly.[35] Indeed, the SG-to-Au molar ratio (1.5:1) used to synthesize the Au NCs is too low to enable the formation of a second ligand shell.
In our case, the densification of the ligand shell with an increasing amount of arginine might induce a rigidification that could limit the intramolecular vibrations and rotations of the ligands and enhance the steric hindrance for the foreign species (H2O and O2 molecules). By this way, the stability of the Au NCs should increase and the probability of nonradiative relaxation should decrease, which would result in PL enhancement. This hypothesis is confirmed by the fact that AuSG-XArg NCs were more stable than AuSG, after one month of storage in PBS buffer at pH increasing from 3 to 10 (Figure S5, S6). This result was in agreement with a study from X. Yuan et al.[36] which showed that using a mix of ligands with similar length but opposite charge could efficiently improve the stability of Au NCs. The storage time in aqueous condition of Au25MPA11Cyst7 NCs (~120h) was 40 times longer than that of Au25MPA18 (~3h). Indeed, the use of protecting ligands with a mix of charges amplifies the rigidification of the ligand shell by eventually inducing coordination among the surface ligands via inter-ligand electrostatic interaction (i.e., –COO–···–NH3+ bond). Similar effects were observed for the Au NCs stabilized by SG-XArg ligands. The NMR results clearly identified the presence of inter- and/or intra-ligands spatial proximity and the broad molecular weight distribution in ESI-MS spectra suggested the addition of few ligands that bond electrostatically on the surface of the Au NCs (Scheme 2). Therefore, the main explanation for the PL and stability enhancement of the Au NCs is the formation of a compact SG-XArg shell that decreases the probability of nonradiative relaxation and protects the Au core from solvent molecules.
In addition, several studies [18,19,37] have reported that the nature of the ligands strongly influences the PL of the Au NCs by charge transfer from the ligand to the metallic core via the Au-S bonds, so called ligand-to-metal-charge transfer (LMCT). Another transfer, the LMMCT go further by implied aurophilic interactions (Au(I)---Au(I)) when the distance between gold atoms are less than 3.6A°.[38] The effects of the electron donation capability of electron rich atoms (N, O) in the ligand were also studied. For a given core size of Au38(SPhX)24 initially stabilized by (HSPhC2), a 5-fold emission enhancement was observed when some ligands were replaced by HSPhNO2 rather than HSPhOCH3.[19] Shortening the distance between the electron rich group and the gold core seemed also important to improve the PL. Indeed, the PL of Au140[S(CH2)5CH3]53 was greatly improved after ligand exchange of just 3 MPA (3-mercaptopropionic acid, HS(CH2)2CO2H but no effect was observed for 7 MUA (mercaptoundecanoic acid, HS(CH2)10CO2H). We also observed a PL enhancement with increasing amounts of arginine, which contains electron rich atoms (O, N). Based on the previous examples, the
10 11 12 13 14 15 16 17 18 19 20 21 22 23 24 25 26 27 28 29 30 31 32 33 34 35 36 37 38 39 40 41 42 43 44 45 46 47 48 49 50 51 52 53 54 55 56 57 58 59 60
electron delocalisation of rich atoms, thanks to LMCT and LMMCT, might also be responsible of this PL increase at a lower degree, due to the presence of the first rigid layer.
In the case of PL decrease for AuSG-3Arg NCs, it could be related to the quenching effect due to the presence of Au NPs observed by TEM and PAGE.
CONCLUSION
In this study, we prepared a library of charged Au NCs and investigated the influence of the ligand shell charge and organisation to the growth, colloidal stability, and PL properties of Au NCs. Using co-ligands glutathione and glutathione modified arginine peptides at different ratios we were able to generate, in one step, a series of Au NCs with controllable number of reactive groups (carboxylic or amine) leading to overall negative, neutral or positive charge at physiological pH. We observed an improvement of the colloidal stability over time of the Au NCs by selecting ligands with opposite charges. Mass spectrometry measurements revealed a transition between the formation of atomically precise NCs to broad molecular weight distribution NCs with the increasing numbers of arginine on the ligand used to stabilize the Au-core. An enhancement of the PL intensity and bathochromic shift of the maximum emission peak was correlated to the formation of a compact ligand shell via inter and/or intra ligand spatial proximity, as demonstrated by NOESY experiments. This compact shell limited the intramolecular vibrations and rotations of the ligands and protected the Au NC from the environment, which decreased the probability of nonradiative relaxation and could be the main explanation for the stability and PL enhancement of the Au NCs. The electron delocalisation from the ligand to the gold core (LMCT and LMMCT) could also contribute to the improvement of PL, at a lower degree. This work highlights the importance of precisely controlling the particle surface to synthesize Au NCs for dedicated applications. Due to their fluorescence in the NIR region (~ 670 nm), QY (up to 10%), relatively long excitation lifetimes (> 400 ns), good stability in PBS at pH 7.0, and various charges these Au NCs appear as promising tool for (bio)imaging or sensing.
ACKNOWLEDGEMENTS
XLG would like to thank Cancéropôle Lyon Auvergne Rhône-Alpes (CLARA), Plan Cancer (C18038CS) and ARC (R17157CC) for their financial support. EP would like to thank GDR or-Nano for their financial support, Martine Fayolle for elemental analysis and Laetitia Rapenne for the HRTEM measurements, the CERMAV laboratory and the DCM laboratory CIRE for sharing the equipments. The authors also acknowledge support from the ICMGFR 2607 NMR platform, and Labex ARCANE and CBH-EUR-GS (ANR-17-EURE-0003).
REFERENCE
[1] L. Zhang, E. Wang, Metal nanoclusters: New fluorescent probes for sensors and bioimaging, Nano Today. 9 (2014) 132–157. doi:10.1016/j.nantod.2014.02.010.
[2] X. Yuan, Z. Luo, Q. Zhang, X. Zhang, Y. Zheng, J.Y. Lee, J. Xie, Synthesis of Highly Fluorescent Metal (Ag, Au, Pt, and Cu) Nanoclusters by Electrostatically Induced Reversible Phase Transfer, ACS Nano. 5 (2011) 8800–8808. doi:10.1021/nn202860s.
3 4 5 6 7 8 9 10 11 12 13 14 15 16 17 18 19 20 21 22 23 24 25 26 27 28 29 30 31 32 33 34 35 36 37 38 39 40 41 42 43 44 45 46 47 48 49 50 51 52 53 54
Colorimetric Platform for Sensitive and Selective Sensing Halide Ions and High Disturbance-Tolerant Recognitions of Iodide and Bromide in Coexistence with Chloride under Condition of High Ionic Strength, Anal. Chem. 84 (2012) 10373–10379. doi:10.1021/ac3024526.
[8] J.T. Petty, J. Zheng, N.V. Hud, R.M. Dickson, DNA-Templated Ag Nanocluster Formation, J. Am. Chem. Soc. 126 (2004) 5207–5212. doi:10.1021/ja031931o.
[9] G. Liu, Y. Shao, K. Ma, Q. Cui, F. Wu, S. Xu, Synthesis of DNA-templated fluorescent gold nanoclusters, Gold Bull. 45 (2012) 69–74. doi:10.1007/s13404-012-0049-6.
[10] Y. Negishi, K. Nobusada, T. Tsukuda, Glutathione-Protected Gold Clusters Revisited: Bridging the Gap between Gold(I)−Thiolate Complexes and Thiolate-Protected Gold Nanocrystals, J. Am. Chem. Soc. 127 (2005) 5261–5270. doi:10.1021/ja042218h.
[11] Q. Wen, Y. Gu, L.-J. Tang, R.-Q. Yu, J.-H. Jiang, Peptide-Templated Gold Nanocluster Beacon as a Sensitive, Label-Free Sensor for Protein Post-translational Modification Enzymes, Anal. Chem. 85 (2013) 11681–11685. doi:10.1021/ac403308b.
[12] J. Xie, Y. Zheng, J.Y. Ying, Protein-Directed Synthesis of Highly Fluorescent Gold Nanoclusters, J. Am. Chem. Soc. 131 (2009) 888–889. doi:10.1021/ja806804u.
[13] A. Baksi, P.L. Xavier, K. Chaudhari, N. Goswami, S.K. Pal, T. Pradeep, Protein-encapsulated gold cluster aggregates: the case of lysozyme, Nanoscale. 5 (2013) 2009. doi:10.1039/c2nr33180b. [14] L.-L. Wang, J. Qiao, L. Qi, X.-Z. Xu, D. Li, Construction of OVA-stabilized fluorescent gold
nanoclusters for sensing glucose, Sci. China Chem. 58 (2015) 1508–1514. doi:10.1007/s11426-015-5354-5.
[15] R. Jin, C. Zeng, M. Zhou, Y. Chen, Atomically Precise Colloidal Metal Nanoclusters and Nanoparticles: Fundamentals and Opportunities, Chem. Rev. 116 (2016) 10346–10413. doi:10.1021/acs.chemrev.5b00703.
[16] J. Zheng, C. Zhou, M. Yu, J. Liu, Different sized luminescent gold nanoparticles, Nanoscale. 4 (2012) 4073. doi:10.1039/c2nr31192e.
[17] S. Choi, R.M. Dickson, J.-K. Lee, J. Yu, Generation of luminescent noble metal nanodots in cell matrices, Photochem Photobiol Sci. 11 (2012) 274–278. doi:10.1039/C1PP05276D.
[18] Z. Wu, R. Jin, On the Ligand’s Role in the Fluorescence of Gold Nanoclusters, Nano Lett. 10 (2010) 2568–2573. doi:10.1021/nl101225f.
[19] G. Wang, R. Guo, G. Kalyuzhny, J.-P. Choi, R.W. Murray, NIR Luminescence Intensities Increase Linearly with Proportion of Polar Thiolate Ligands in Protecting Monolayers of Au 38 and Au 140 Quantum Dots, J. Phys. Chem. B. 110 (2006) 20282–20289. doi:10.1021/jp0640528.
[20] M. Zhu, C.M. Aikens, F.J. Hollander, G.C. Schatz, R. Jin, Correlating the Crystal Structure of A Thiol-Protected Au 25 Cluster and Optical Properties, J. Am. Chem. Soc. 130 (2008) 5883–5885. doi:10.1021/ja801173r.
[21] Y. Negishi, Y. Takasugi, S. Sato, H. Yao, K. Kimura, T. Tsukuda, Magic-Numbered Au n Clusters
Protected by Glutathione Monolayers ( n = 18, 21, 25, 28, 32, 39): Isolation and Spectroscopic Characterization, J. Am. Chem. Soc. 126 (2004) 6518–6519. doi:10.1021/ja0483589.
[22] X. Yuan, B. Zhang, Z. Luo, Q. Yao, D.T. Leong, N. Yan, J. Xie, Balancing the Rate of Cluster Growth and Etching for Gram-Scale Synthesis of Thiolate-Protected Au 25 Nanoclusters with Atomic Precision, Angew. Chem. Int. Ed. 53 (2014) 4623–4627. doi:10.1002/anie.201311177. [23] K. Pyo, V.D. Thanthirige, K. Kwak, P. Pandurangan, G. Ramakrishna, D. Lee, Ultrabright
Luminescence from Gold Nanoclusters: Rigidifying the Au(I)–Thiolate Shell, J. Am. Chem. Soc. 137 (2015) 8244–8250. doi:10.1021/jacs.5b04210. 10 11 12 13 14 15 16 17 18 19 20 21 22 23 24 25 26 27 28 29 30 31 32 33 34 35 36 37 38 39 40 41 42 43 44 45 46 47 48 49 50 51 52 53 54 55 56 57 58 59 60
[24] A. Soleilhac, F. Bertorelle, C. Comby-Zerbino, F. Chirot, N. Calin, P. Dugourd, R. Antoine, Size Characterization of Glutathione-Protected Gold Nanoclusters in the Solid, Liquid and Gas Phases, J. Phys. Chem. C. 121 (2017) 27733–27740. doi:10.1021/acs.jpcc.7b09500. [25] Z. Wu, C. Gayathri, R.R. Gil, R. Jin, Probing the Structure and Charge State of
Glutathione-Capped Au 25 (SG) 18 Clusters by NMR and Mass Spectrometry, J. Am. Chem. Soc. 131 (2009) 6535–6542. doi:10.1021/ja900386s.
[26] K.L. Parry, A.G. Shard, R.D. Short, R.G. White, J.D. Whittle, A. Wright, ARXPS characterisation of plasma polymerised surface chemical gradients, Surf. Interface Anal. 38 (2006) 1497–1504. doi:10.1002/sia.2400.
[27] J.H. Scofield, Hartree-Slater subshell photoionization cross-sections at 1254 and 1487 eV, J. Electron Spectrosc. Relat. Phenom. 8 (1976) 129–137. doi:10.1016/0368-2048(76)80015-1. [28] C. Colombé, X. Le Guével, A. Martin-Serrano, M. Henry, E. Porret, C. Comby-Zerbino, R. Antoine,
I. Atallah, B. Busser, J.-L. Coll, C.A. Righini, L. Sancey, Gold nanoclusters as a contrast agent for image-guided surgery of head and neck tumors, Nanomedicine Nanotechnol. Biol. Med. 20 (2019) 102011. doi:10.1016/j.nano.2019.04.014.
[29] N. Ouadah, T. Doussineau, T. Hamada, P. Dugourd, C. Bordes, R. Antoine, Correlation between the Charge of Polymer Particles in Solution and in the Gas Phase Investigated by Zeta-Potential Measurements and Electrospray Ionization Mass Spectrometry., Langmuir. 29 (2013) 14074– 14081. doi:10.1021/la403516y.
[30] Y. Yu, Z. Luo, D.M. Chevrier, D.T. Leong, P. Zhang, D. Jiang, J. Xie, Identification of a Highly Luminescent Au 22 (SG) 18 Nanocluster, J. Am. Chem. Soc. 136 (2014) 1246–1249.
doi:10.1021/ja411643u.
[31] C.-L. Liu, H.-T. Wu, Y.-H. Hsiao, C.-W. Lai, C.-W. Shih, Y.-K. Peng, K.-C. Tang, H.-W. Chang, Y.-C. Chien, J.-K. Hsiao, J.-T. Cheng, P.-T. Chou, Insulin-Directed Synthesis of Fluorescent Gold Nanoclusters: Preservation of Insulin Bioactivity and Versatility in Cell Imaging, Angew. Chem. Int. Ed. 50 (2011) 7056–7060. doi:10.1002/anie.201100299.
[32] Z. Luo, X. Yuan, Y. Yu, Q. Zhang, D.T. Leong, J.Y. Lee, J. Xie, From Aggregation-Induced Emission of Au(I)–Thiolate Complexes to Ultrabright Au(0)@Au(I)–Thiolate Core–Shell Nanoclusters, J. Am. Chem. Soc. 134 (2012) 16662–16670. doi:10.1021/ja306199p.
[33] B. Musnier, K.D. Wegner, C. Comby-Zerbino, V. Trouillet, M. Jourdan, I. Häusler, R. Antoine, J.-L. Coll, U. Resch-Genger, X. Le Guével, High photoluminescence of shortwave infrared-emitting anisotropic surface charged gold nanoclusters, Nanoscale. 11 (2019) 12092–12096.
doi:10.1039/C9NR04120F.
[34] D. Shen, M. Henry, V. Trouillet, C. Comby-Zerbino, F. Bertorelle, L. Sancey, R. Antoine, J.-L. Coll, V. Josserand, X. Le Guével, Zwitterion functionalized gold nanoclusters for multimodal near infrared fluorescence and photoacoustic imaging, APL Mater. 5 (2017) 053404.
doi:10.1063/1.4977203.
[35] X.L. Guevel, O. Tagit, C.E. Rodríguez, V. Trouillet, M. Pernia Leal, N. Hildebrandt, Ligand effect on the size, valence state and red/near infrared photoluminescence of bidentate thiol gold nanoclusters, Nanoscale. 6 (2014) 8091–8099. doi:10.1039/C4NR01130A.
[36] X. Yuan, N. Goswami, I. Mathews, Y. Yu, J. Xie, Enhancing stability through ligand-shell engineering: A case study with Au25(SR)18 nanoclusters, Nano Res. 8 (2015) 3488–3495. doi:10.1007/s12274-015-0847-2.
[37] N. Goswami, Q. Yao, Z. Luo, J. Li, T. Chen, J. Xie, Luminescent Metal Nanoclusters with Aggregation-Induced Emission, J. Phys. Chem. Lett. 7 (2016) 962–975.
doi:10.1021/acs.jpclett.5b02765. 3 4 5 6 7 8 9 10 11 12 13 14 15 16 17 18 19 20 21 22 23 24 25 26 27 28 29 30 31 32 33 34 35 36 37 38 39 40 41 42 43 44 45 46 47 48 49 50 51 52 53 54
SG-1Arg
SG
SG-2Arg
SG-3Arg
Au NCs
(13 types)
Ratio SG/SG-XArg (%)
100/0
75/25
50/50
25/75
0/100
O H O NH2 N H O O N H N H O SH OH NH O O H O NH2 N H O O N H OH O SH O H O NH2 N H O O N H N H O SH N H NH OH O NH NH2 N H O O H O NH2 N H O O N H N H O SH N H NH N H O NH NH2 N H O OH O NHACS Paragon Plus Environment 10 11 12 13 14 15 16 17 18 19 20 21 22 23 24 25 26 27 28 29 30 31 32 33 34 35 36 37 38 39 40 41 42 43 44 45 46 47 48 49 50 51 52 53 54 55 56
ACS Paragon Plus Environment 3 4 5 6 7 8 9 10 11 12 13 14 15 16 17 18 19 20 21 22 23 24 25 26 27 28 29 30 31 32 33 34 35 36 37 38 39 40 41 42 43 44 45 46 47 48 49 50
9 10 11 12 13 14 15 16 17 18 19 20 21 22 23 24 25 26 27 28 29 30 31 32 33 34 35 36 37 38 39 40 41 42 43 44 45 46 47 48 49 50 51 52 53 54 55 56
! "!!#!!! $!!#!!! %!!#!!! &!!#!!! $'! ('! %'! ''! &'!
)*+,-,./0123.45
! "!!#!!! $!!#!!! %!!#!!! &!!#!!! $'! ('! %'! ''! &'!)*+,-,./01 3.452
! "!!#!!! $!!#!!! %!!#!!! &!!#!!! $'! ('! %'! ''! &'!)*+,-,./01 3.45
)*+,-,./01 3.45
)*+,-,./01 3.45
!"#
$%"&
'(
)
*+
&
,-.
)*+,-,./01 3.45
!"#
$%"&
'(
)
*+
&
,-.
!"#
$%"&
'(
)
*+
&
,-.
!-/01/023!%4
35515*
67187
75175**
87167*
51355
35515*
67187
75175**
87167*
51355
35515*
67187
75175**
87167*
51355
!-/01/028!%4
!-/01/029!%4
!
:
;<*='>
)'#=>
?
+&
,-.
;<*='>
)'#=>
?
+&
,-.
;<*='>
)'#=>
?
+&
,-.
!6! !67! !6"! !68! !6$! $!! (!! %!! '!! &!! 9!! !6!! !67! !6"! !68! !6$! $!! (!! %!! '!! &!! 9!! !6!! !67! !6"! !68! !6$! $!! (!! %!! '!! &!! 9!!ACS Paragon Plus Environment 3 4 5 6 7 8 9 10 11 12 13 14 15 16 17 18 19 20 21 22 23 24 25 26 27 28 29 30 31 32 33 34 35 36 37 38 39 40 41 42 43 44 45 46 47 48 49 50
Fluorescence lifetime
(t
av.amp
, ns)
438
483
604
596
410
ACS Paragon Plus Environment 9 10 11 12 13 14 15 16 17 18 19 20 21 22 23 24 25 26 27 28 29 30 31 32 33 34 35 36 37 38 39 40 41 42 43 44 45 46 47 48 49 50 51 52 53 54 55 56
0h
1 month
AuSG
AuSG-1Arg
AuSG-2Arg
AuSG/SG-3Arg
AuSG-3Arg
B
C
0
200000
400000
600000
800000
1000000
1200000
1400000
1600000
3
4
5
6
7
8
9
10
675
680
685
690
695
700
705
3
4
5
6
7
8
9
10
PL
int
ensit
y
(a.u
)
pH
Wa
ve
le
ng
th
(n
m
)
pH
ACS Paragon Plus Environment 2 3 4 5 6 7 8 9 10 11 12 13 14 15 16 17 18 19 20 21 22 23 24 25 26 27 28 29 30 31 32 33 34 35 36 37 38 39 40 41 42 43 44 45 46 47 48 49 50
AuSG-3Arg
AuSG/SG-3Arg
D
E
ACS Paragon Plus Environment 9 10 11 12 13 14 15 16 17 18 19 20 21 22 23 24 25 26 27 28 29 30 31 32 33 34 35 36 37 38 39 40 41 42 43 44 45 46 47 48 49 50 51 52 53 54 55 56
Theoretical
molecular-weight
(*, Da)
9 848
12 659
15 470
14 064
18 281
Molecular-weight
by ESI-MS (Da)
Au
15
SG
13
(6936.71)
Au
18
SG
14
(7833.94)
Au
22
SG
17
(8840.52)
Au
20
SG
16
(9540.78)
Au
15
SG-1Arg
13
(8967.05)
Au
16
SG-1Arg
14
(9626.52)
Au
18
SG-1Arg
14
(10 020.46)
Au
20
SG-1Arg
17
(11 801.9)
Au
21
SG-1Arg
17
(11 998.87)
Au
21
SG-1Arg
18
(12 461.37)
9194, 9855, 10378, 10514 (¨)
13 000
-
19 000
Hydrodynamic
diameter by DOSY
(nm)
1.66±0.01
1.72±0.02
2.02±0.02
2.04±0.04
2.12±0.03
ACS Paragon Plus Environment 3 4 5 6 7 8 9 10 11 12 13 14 15 16 17 18 19 20 21 22 23 24 25 26 27 28 29 30 31 32 33 34 35 36 37 38 39 40 41 42 43 44 45 46 47 48 49 50
!"#)%&'(
!"#*%&'(
%&'
+%&'
, ) * - . / 0 1 2 3 4 ! " ! #"$ # " ! ! # " # " ! %" !" #" ! $%&'
+%&'
, ! " ! #" $ # " ! ! # " # " ! %" # " #" !" ! #" #" $ # " ! #" # " $%&'
5 ! " ! #" $ # " ! ! # " # " ! %" # " #" # " ! #" #" $ # " ! #" # " $ !" ! #" #" # " $58??;:(
%&'
,(6(7&'8989:(,:&5897;
) * - . / 0 ! " ! #" $ # " ! ! # " !" ! %"ACS Paragon Plus Environment 10 11 12 13 14 15 16 17 18 19 20 21 22 23 24 25 26 27 28 29 30 31 32 33 34 35 36 37 38 39 40 41 42 43 44 45 46 47 48 49 50 51 52 53 54 55 56
!
"
#
#
$
"##
$
!
"
#
#
$
"
#
#
$
!
"#
#$
"
#
#
$
%&!'
%&!'(
)%*+
%&!'(
,%*+
%&!'(
-%*+
%&!'.!'(
-%*+
!
%*+
/"##$
%*+
0%*+
1!
%*+
/"
#
#
$
%*+
0%*+
1!
%*+
/"
#
#
$
%*+
0%*+
1!
%*+
/"##
$
!
%*+
/"
#
#
$
!
"#
#$
%*+
/!""#$ $%&%'#()*#++
,+#-%.+#(/0)%1%0"
!"1#$2+%&3"'(456(
78()/31%3+( /$0-%9%1:;!"1$32+%&3"'(456
6+#<1$0)131%< %"1#$3<1%0")
%*+
1"#
#$
"
#
#
$
%*+
1!
%*+
/"##$
!
%*+
/!
%*+
/%*+
1!$
%*+
1%*+
/!
"#
#$
!
%*+
/"
#
#
$
%*+
0%*+
1%*+
/%*+
0%*+
1!
"
#
#
$
"#
#
$
"
#
#
$
!$
%*+
0%*+
/ 1%*+
"
#
#
$
!$
%*+
0%*+
/ 1%*+
"
#
#
$
ACS Paragon Plus Environment 3 4 5 6 7 8 9 10 11 12 13 14 15 16 17 18 19 20 21 22 23 24 25 26 27 28 29 30 31 32 33 34 35 36 37 38 39 40 41 42 43 44 45 46 47 48 49 50
ACS Paragon Plus Environment 10 11 12 13 14 15 16 17 18 19 20 21 22 23 24 25 26 27 28 29 30 31 32 33 34 35 36 37 38 39 40 41 42 43 44 45 46 47 48 49 50 51 52 53 54 55 56
!
"
#
#
$
"##
$
!
"
#
#
$
"
#
#
$
!
"#
#$
"
#
#
$
%&!'
%&!'(
)%*+
%&!'(
,%*+
%&!'(
-%*+
%&!'.!'(
-%*+
!
%*+
/"##
$
!
%*+
/"
#
#
$
!
"#
#$
%*+
/!""#$ $%&%'#()*#++
,+#-%.+#(/0)%1%0"
!"1#$2+%&3"'(456(
78()/31%3+( /$0-%9%1:;!"1$32+%&3"'(456
6+#<1$0)131%< %"1#$3<1%0")
%*+
0"#
#$
"
#
#
$
%*+
0!
%*+
/"##$
!
%*+
/!
%*+
/%*+
0!$
%*+
0%*+
/!
"#
#$
!
%*+
/"
#
#
$
%*+
1%*+
0%*+
/%*+
1%*+
0!
"
#
#
$
"#
#
$
"
#
#
$
!$
%*+
1%*+
/ 0%*+
"
#
#
$
!$
%*+
1%*+
/ 0%*+
"
#
#
$
ACS Paragon Plus Environment 3 4 5 6 7 8 9 10 11 12 13 14 15 16 17 18 19 20 21 22 23 24 25 26 27 28 29 30 31 32 33 34 35 36 37 38 39 40 41 42 43 44 45 46 47 48 49 50