HAL Id: hal-03119689
https://hal.archives-ouvertes.fr/hal-03119689
Submitted on 25 Jan 2021
HAL is a multi-disciplinary open access
archive for the deposit and dissemination of
sci-entific research documents, whether they are
pub-lished or not. The documents may come from
teaching and research institutions in France or
abroad, or from public or private research centers.
L’archive ouverte pluridisciplinaire HAL, est
destinée au dépôt et à la diffusion de documents
scientifiques de niveau recherche, publiés ou non,
émanant des établissements d’enseignement et de
recherche français ou étrangers, des laboratoires
publics ou privés.
Physical, chemical, and optical properties of regional
hazes dominated by smoke in Brazil
Jeffrey Reid, Peter Hobbs, Ronald Ferek, Donald Blake, J. Vanderlei Martins,
Michael Dunlap, Catherine Liousse
To cite this version:
Jeffrey Reid, Peter Hobbs, Ronald Ferek, Donald Blake, J. Vanderlei Martins, et al.. Physical,
chemical, and optical properties of regional hazes dominated by smoke in Brazil. Journal of
Geo-physical Research: Atmospheres, American GeoGeo-physical Union, 1998, 103 (D24), pp.32059-32080.
�10.1029/98JD00458�. �hal-03119689�
UC Irvine
UC Irvine Previously Published Works
Title
Physical, chemical, and optical properties of regional hazes dominated by smoke in
Brazil
Permalink
https://escholarship.org/uc/item/4hz6q116
Journal
Journal of Geophysical Research Atmospheres, 103(D24)
ISSN
0148-0227
Authors
Reid, JS
Hobbs, PV
Ferek, RJ
et al.
Publication Date
1998
DOI
10.1029/98JD00458
License
https://creativecommons.org/licenses/by/4.0/ 4.0
Peer reviewed
eScholarship.org
Powered by the California Digital Library
Physical, chemical, and optical properties of regional
hazes dominated by smoke in Brazil
Jeffrey
S. Reid,
•,2 Peter
V. Hobbs,
• Ronald
J. Ferek,
•,3 Donald
R. Blake,
4
J. Vanderlei
Martins,
5 Michael
R. Dunlap,
6 and
Catherine
Liousse
7
Abstract. Gas and particle measurements are described for optically thick regional hazes,
dominated by aged smoke from biomass buming, in the cermdo and rain forested regions of Brazil.
The hazes tended to be evenly mixed from the surface to the trade wind inversion at 34 km in
altitude. The properties of aged gases and particles in the regional hazes were significantly
different from those of young smoke (<4 min old). As the smoke aged, the total amount of
carbon in non-methane hydrocarbon species (C<I 1) was depleted by about one third due to
transformations
into CO
2, CO, and
reactive
molecules,
and
removed
by dry deposition
and/or
by
conversion
to particulate
matter. As the smoke
particles
aged,
their sizes
increased
significantly
due to coagulation and mass growth by secondary species (e.g., ammonium, organic acids and
sulfate). During aging, condensation and gas-to-particle conversion of inorganic and organic
vapors increased the aerosol mass by -20-40%. One third to one half of this mass growth likely
occurred in the first few hours of aging due to the condensation of large organic molecules. The
remaining mass growth was probably associated with photochemical and cloud-processing
mechanisms operating over several days. Changes in particle sizes and compositions during aging
had a large impact on the optical properties of the aerosol. Over a 2 to 4 day period, the fine
particle
mass-scattering
efficiency
and
single-scattering
albedo
increased
by 1 m 2 g-I, and
4).06,
respectively. Conversely, the Angstrom coefficient, backscatter ratio, and mass absorption
efficiency decreased significantly with age.
1. Introduction
Biomass burning, which produces an estimated 104 Tg yr -1
of particles worldwide [Andreae, 1991], is the second largest source of anthropogenic aerosol particles [Intergovernmental Panel on Climate Change (IPCC), 1995]. Particles from biomass burning not only have significant local and regional effects but also may affect global atmospheric chemistry and
the Earth's climate.
South America accounts for 30% of all tropical biomass burning. Artaxo et al. [1994] showed that during the dry season, biomass burning produces major perturbations in atmospheric fine particle concentration at ground level in the Amazon Basin and cerrado regions of Brazil. Optical depths due to smoke in this region are frequently in excess of 1 and have been measured as high as 3 [Ross et al., this issue]. For such high optical depths, instantaneous net radiative forcing
1Department of Atmospheric Sciences, University of Washington,
Seattle.
2Now at SPAWARSYSCEN SAN DIEGO 0883, 49170 Propagation
Path, San Diego, Califomia 92152-7385.
3Also at Office of Naval Research, Arlington, Virginia.
'*Department of Chemistry, University of Califomia, Irvine.
5Insfituto de Fisica, Universidade de Sao Paulo, Sao Paulo, Brazil.
6Facility for Advanced Instrumentation, University of California, Davis.
7Centre des Faibles Radioactivit6s, Laboratoire Mixte CNRS-CEA,
Gif-Sur-Yvette, France.
Copyright 1998 by the American Geophysical Union. Paper number 98JD00458.
0148-0227/98/98ID-00458509.00
due to aerosol from biomass burning can be as high as -36
W m -2 [Christopher et al., 1996].
To model the direct radiative forcing of aerosols, measurements of three basic optical properties are required: mass-scattering efficiency, backscatter ratio, and single-scattering albedo. In a companion paper, we have provided these measurements for young (<4 min old) smoke from biomass burning in Brazil [Reid and Hobbs, this issue]. However, since aerosols from biomass burning undergo rapid evolution [Westphal and Toon, 1991; Hobbs et al., 1997], measurements on young smoke should not be assumed to be applicable to smoke that dominates regional hazes or affects even larger areas. Therefore parameters applicable to aged smoke should be used in regional and global climate models. In this paper we describe and discuss such measurements, obtained aboard the University of Washington (UW) Convair
C-131A research aircraft in the Smoke, Clouds, and
Radiation-Brazil (SCAR-B) field project [Hobbs, 1996' Kaufman et al., this issue]. The measurements comprise the physical, chemical, and optical properties of the regional palls of smoke that cover millions of square kilometers of the cerrado and (Amazon) forested regions of Brazil during the dry
season.
Many physical and chemical processes can influence gases and particles in smoke as they evolve from their sources in Brazil (Figure 1). After being emitted, the smoke particles disperse rapidly into the atmosphere, but they are usually capped by the strong trade wind inversion at a height of about 3 to 4 km. Smoke from hundreds of fires mix with biogenic emissions from forests, suspended soil particles, and anthropogenic pollutants. The most vigorous fires often have a capping cumulus cloud above them, which can process the 32,059
32,060 REID ET AL.: SMOKE HAZES IN BRAZIt.
Cappi
Ejection of Cloud-Processed Smoke .•.:. ... :•::•.:.•ii.•:•:i:...:i•..:...:::...:.:::.:•:!i:i:•:' •".'-'":'•::•....-::. "':':•:•'"'"'"'"'"':':'"'"•:•.•..'-:'.:!jiii![i: '""..":... ..•. ".':.... ß....'i...'::iii'"'""'""'":•-" ß '".:•:.'.•:: ':'... ß ... >4 kmTrade Wind Inversion
'3ns
Mixed
Layer
Figure 1. Schematic depicting some of the processes involved in the evolution of smoke particles from biomass burning as they spread from their sources to r•gional and continental scales in l:'•'azil.smoke before ejecting it aloft. In some cases, clouds break
through the trade wind inversion and eject the smoke as layers
into the more stable free troposphere, where it can be transported over large distances [Pickering et al., 1996]. As the smoke disperses, it undergoes photochemical transformations, gas-to-particle conversion, and particle coagulation. Furthermore, smoke can be entrained into clouds in the boundary layer, thereby increasing the rates of some chemical reactions. These various processes result in a thick photochemical "soup" up to the height of the trade wind inversion that can have physical and chemical properties quite different from those of young smoke.
Smoke emissions in Brazil have a strong diurnal cycle. Fires are gen. erally ignited in the late morning through late
afternoon [Prins et al., 1997]. Thus hazes sampled in the early
to midmorning are likely to contain aged smoke from the previous day.
2. Experimental Design and Instrumentation
2.1. Design and Methods
In SCAR-B the UW C-131A aircraft was used to study a wide
variety of regional hazes dominated by smoke. Flight operations were conducted from four bases: Brasflia (the capitol of Brazil, 14øS, 48øW), Cuiab• (in the state of Mato Grosso, 16øS, 56øW ), Porto Velho (Rondonia, 9øS, 64øW), and Marab•i(Par•, 5 •S, 49øW). A map showing the locations of these sites is presented by Kaufman et al. [this issue]. Brasffia and Cuiab•i are in the cerrado region, while Porto Velho and Marab,'i are in the western and eastern portions of the Amazon
Basin, respectively. Since the aerosols around Brasflia had a strong local urban component, they are not discussed here.
The data collected can be divided into three broad
categories. Roughly half of the data were collected during nine vertical profiles in which measurements were made from near the surface up through the trade wind inversion. Results of column closure tests for these flights are described by Ross et al. [this issue]. Comprehensive measurements on regional hazes were also obtained immediately prior to obtaining emission factor measurements [Ferek et al., this issue]. Finally, data were collected on the transit flights between the four bases of operation.
A description of the instrumentation aboard the UW C-131A aircraft, the flight plans, and mission summaries are given by Hobbs [1996]. However, a brief description of the methods and measurements relevant to this paper are given here.
The UW C-131A carries aboard instrumentation for both
continuous and parcel sampling. Measurements of basic state parameters, particle size distributions, light scattering, and absorption coefficients were made continuously. "Grab"
samples
for particle analysis
were collected
in a 2.5 m 3
Velostat bag, which is filled by ram air in 10-14 s. To minimize wall losses in the bag, air samples did not exceed
0.75 m 3 per bag. The particle
cut point of the inlet and bag
system is ~4 gm (PM4). Samples from the grab bag were
passed through filters (for subsequent total mass concentration measurements and chemical composition analysis). Particle
size distribution and aerosol humidification factor
measurements [Kotchenruther and Hobbs, this issue] were also made on grab bag samples.
Correlation coefficients between measurements made with
the continuously recording instruments (e.g., nephelometers) and measurements made via the grab bag were :lerived by averaging the continuous measurements over the period during which the grab bag was filled. Since the regional hazes were generally very uniform, the timing of the grab samples and the
continuous measurements was not critical.
2.2. Gas Measurements
Ozone concentrations were measured continuously using a Monitor Labs 8410 ethylene chemiluminescence analyzer. Twenty-seven gas samples were collected in 2-L stainless steel canisters. The canisters were filled with air samples to approximately 28 psi by a metal bellows pump. 'l-he canisters were sent to the University of California, Irvine, where they were analyzed by gas chromatography using a flame ionization detector (FID). The sample size for each analysis
was 303 cm
3. Concentrations
of CO
2, CO, CH
4, and
21
hydrocarbons (C<11) were measured for each sample. Measurement precision for the alkanes, alkenes, and alkynes was 2% or 8 parts per trillion volume (pptv), whichever was larger. The total carbon concentration in nonmethane hydrocarbons rxT•ur,•x ... .• ... :...• [1•11¾111•.•} W• U•31.[3111illi[3U by ,it•xaun• the m•a : ... : ... of all peaks between the C-2 and the C-11 region and dividing this area by the methane response factor.The concentrations of five halocarbons were determined
from the canister samples using an electron caplure detector.
These were CH3C1, CHC13, CH•I, CH•Br, and CHBr•, which
were measured with precisions of 1.2, 12, 12, 8, and 12%, respectively.
2.3. Aerosol Composition
In SCAR-B, sixty-two 37 mm Teflon filters were exposed in regional hazes in Brazil from the C-131A aircraft. Twenty-five additional field blanks (for quality control) were used. Filters were gravimetrically analyzed in a humidity controlled chamber (RH=35%) to determine the ambient
aerosol
dry mass
concentration
(Cm,
in gg m-3). From
the
control and field blanks we estimated that the uncertainty in the measured filter masses were less than +6 g g. For comparison, the mean filter loading for the regional smoke samples was 45 gg. Most filters exposed to regional haze were filled with more than one bag; the average filmred volumewas 0.85 m 3. Following
gravimetric
measurements
of the
filters for determining total aerosol mass, the Teflon filters were subjected to water extraction and then ion exchange chromatography (IC). This analysis yielded the
concentrations
of the following
ions: Ca
2+, CI-, K +, Mg 2+,
Na
+, NH,•,
N(• 2, NO•3,
SO•, and
C20•4
(oxalate).
Na
+, K +, NH,•,
SO•, and C20 • were measured to have a +3% uncertainty or
better and were always more than two standard deviations (2(5) above the detectable limits. All other species were measured to have a +15% uncertainty or better.
Forty-one polycarbonate filter samples were collected simultaneously with the Teflon filters. The polycarbonate filters were gravimetrically analyzed and then subjected to proton induced X ray emission (PIXE) spectroscopy to determine the concentration of up to 20 elements. In this
paper we discuss PIXE data for K, S, and Fe. Filter mass, Ca 2+,
K, and S were used to check the consistency of the data between the IC and the PIXE analysis. Iron was used as the primary indicator of the fraction of soil in the aerosol.
Regressions between aerosol concentrations derived from the Teflon and the polycarbonate filters yielded a 1:1 slope and a correlation greater than 80%. Comparisons of elements from
the IC and PIXE showed that 80% of the sulfur in the aerosol
was soluble and/or easily oxidized to sulfate, and 80% and 50%
of the K and Ca were soluble.
Particulate carbon concentrations in the aerosol were
determined by thermal analysis [Cachier et al., 1989] of 38 quartz filters. The filters were subjected HC1 vapors for 24 hours to remove any carbonates. The black carbon (BC) content of the aerosol was determined through coulometric titration after the sample was thermally pretreated for 2 hours at 340øC in pure oxygen. A discussion of the quality of the BC data is given by Reid et al. [this issue]. As recommended by Reid et al., all of the BC concentrations were increased by 25% to account for measurement bias in the BC thermal analysis.
Twenty additional polycarbonate filters were taken and subjected to scanning electron microscopy (SEM) and energy dispersive X ray analysis (EDX). The purpose of this analysis was to determine the properties of coarse particles in the regional hazes dominated by smoke. The SEM used was an ISI DS 130 operating at 20 keV with a current of approximately 100 nA; EDX was performed with an Oxford Instruments EDS detector with a Be window. Over 300 coarse particles were micrographed; of these, 50 were subjected to EDX to determine qualitative elemental composition (the derived elements were similar to those of PIXE).
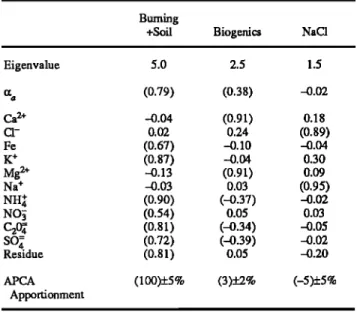
Species concentrations from IC and PIXE, as well as the aerosol specific absorption, were subjected to principal component analysis (PCA) and absolute principal component analysis (APCA) [Thurston and Spengler, 1985; Hopke, 1985; Artaxo et al., 1994]. Results from these analyses were used to separate out orthogonal factors (or components) and their apportionments in the atmosphere. The PCA analysis was used to determine qualitative relationships between the orthogonal factors of the aerosol and the input parameters.
2.4. Particle Size Distributions
Aboard the UW C-131A aircraft were two instruments for
measuring particle size spectra that were used in this study: a differential mobility particle sizer (DMPS) and the PMS passive cavity aerosol spectrometer probe (PCASP). The DMPS measures aerosol size spectrums from 0.01 to 0.6 gm diameter based on particle electromobility [Winklmayr et al., 1991]. Since this instrument requires a 4 min analysis time, samples were drawn from the grab bag. The PCASP-100X is a wing-mounted, optical particle counter that measures dried aerosol from 0.1 to 3 I.tm in diameter. Particle sizes are derived from measurements of the light that scatters from angles between 35 ø and 135 ø. The instrument was calibrated using polystyrene latex spheres of known sizes. Sizing errors can develop for particles that have indices of refraction which differ from those of latex (1.59-00. To compensate for this, the PCASP response curve was adjusted [Pueschel et al., 1990] for particles with indices of refraction of 1.5-0.02i (from closure calculations by Reid and Hobbs [this issue]).
Both the DMPS and the PCASP number distributions were
parameterized by a lognormal curve fit:
32,062 REID ET AL.: SMOKE HAZES IN BRAZIL
where
d
e is the
particle
diameter,
CMD is the
count
median
diameter,
and
c•g
c is the geometric
standard
deviation.
A
similar expression was used to parameterize the particle
volume distributions.
Overall, these various methods produced o a values within
_+20% of each other. Errors in the derived single-scattering albedos of individual samples were within _+0.05. Results from the IP method are used principally in this paper.
2.5. Light Scattering
Light-scattering measurements were made with a
three-wavelength ()•=450, 550, 700 nm) nephelometer custom
built for the UW by MS Electron Incorporated [Hegg et al.,
1996; Anderson et al., 1996]. Aerosols were sampled
continuously through a pressure-regulated, isokinetic inlet and
dried to a relative humidity <35%. The nephelometer had a backscatter shutter to determine total hemispheric
backscattering (between 90* and 170'). For particles less than
0.6 I.tm diameter, such as those encountered in this study, the
truncation errors were small and accounted for in part. We estimate that this produced a 3% uncertainty in our scattering measurements. To mitigate the errors produced by a non-Lambertian light source, which most nephelometers suffer from, the lamp in our nephelometer was fitted with a special ground glass window.
3. Meteorological and Haze Characteristics
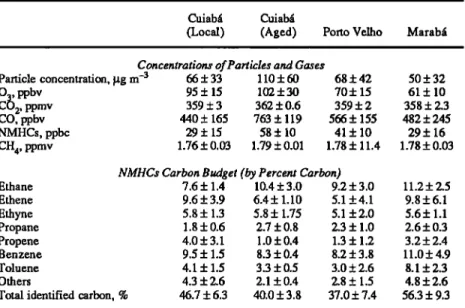
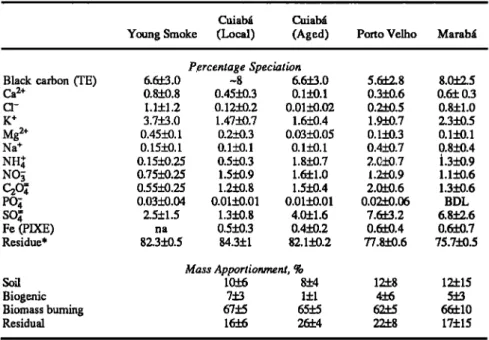
Airborne measurements were obtained in the vicinity of Cuiab•, Porto Velho, and Marab• from August 23 to September 18, 1995. A summary of the aerosol and major gas species concentrations by region is given in Table 1. Also included in Table 1 is the carbon apportionment of the NMHC. All of the measurements were made in fairly uniform regional hazes. To illustrate some typical atmospheric structures and smoke distributions encountered during SCAR-B, meteorological and aerosol data from seven vertical profiles are listed in Table 2.
In the remainder of this section we describe the general meteorological conditions and haze characteristics during the period that we obtained measurements at each of the three base sites. GOES 8 satellite images for the time periods discussed may be found in the work of Kaufman et al. [this issue].
2.6. Light Absorption
For a complete description and error analysis of the measurements of aerosol absorption and single-scattering
albedo aboard the C-131A in SCAR-B the reader is referred to
Reid et al. [this issue]. The shortwave light absorption
coefficient (!JR) of the aerosol
was measured
using the
integrating plate (IP) and optical reflectance (OR) techniques
on the Teflon and polycarbonate filter samples, respectively. These measurements were made at a wavelength of 550 nm and broadband visible for the IP and OR methods, respectively. Continuous absorption measurements were made using a
particle soot/absorption photometer (PSAP), manufactured by
Radiance Research. The PSAP operated at a wavelength of 550 nm and used a quartz filter substrate. The integration time for each data point was 1 min.
3.1. Cuiab•i
Flight operations with the UW C-131A were conducted around Cuiab• from August 24 to September 1. From August
24 to 28 there was a weak (<5 m s -1) easterly flow. What
appeared to be mainly locally generated smoke was uniformly distributed in a layer that extended from the surface to a strong trade wind (subsidence) inversion at ~2500 m (740 hPa). The midday atmospheric lapse rate was dry adiabatic, and the equivalent potential temperature was nearly constant with height, which indicate strong vertical mixing. The skies were mostly cloud free, with the exception of some thin cirrus and scattered cumulus humilis (<300 rn thick) at the tops of the strongest thermals. Capping cumulus clouds on large fires were observed to emit thin smoke layers at an altitude of about
1 km above the trade wind inversion.
Table 1. Concentrations of Particles (PM4) and Gases (Mean _+ Standard
Deviation) and Nonmethane Hydrocarbon (NMHC) Budget Observed in Regional Hazes Dominated by Smoke From Biomass Burning Over CuiabJ, Porto Velho, and Marab• During SCAR-B
Cuiab• Cuiab•
(Local) (Aged) Porto Velho Marab•
Concentrations of Particles and Gases
Particle concentration, gg m -3 66 + 33 110 + 60 68 + 42 O3, ppbv 95+15 102+30 70+15 CO2, ppmv 359 + 3 362 _+ 0.6 359 _+ 2 CO, ppbv 440+165 763+119 566+155 NMHCs, ppbc 29 + 15 58 + 10 41 + 10 CH4, ppmv 1.76 + 0.03 1.79 + 0.01 1.78 + 11.4
NMHCs Carbon Budget (by Percent Carbon)
50 + 32 61+10 358 + 2.3 482 + 245 29+ 16 1.78 + 0.03 Ethane 7.6 + 1.4 10.4 + 3.0 9.2 + 3.0 11.2 + 2.5 Ethene 9.6 + 3.9 6.4 + 1.10 5.1 + 4.1 9.8 + 6.1 Ethyne 5.8 + 1.3 5.8 + 1.75 5.1 + 2.0 5.6 + 1.1 Propane 1.8 + 0.6 2.7 + 0.8 2.3 + 1.0 2.6 + 0.3 Propene 4.0 + 3.1 1.0 + 0.4 1.3 + 1.2 3.2 + 2.4 Benzene 9.5 + 1.5 8.3 + 0.4 8.2 + 3.8 11.0 + 4.9 Toluene 4.1 + 1.5 3.3 + 0.5 3.0 + 2.6 8.1 + 2.3 Others 4.3 + 2.6 2.1 + 0.4 2.8 + 1.5 4.8 + 2.6
Table 2. Meteorological and Other General Characteristics for Seven Vertical Profiles Made by the UW C-131A Aircraft in Regional Hazes in Brazil
Parameter
Cuiab•i Cuiab•
Cuiab• Cuiabl (Aged) (Aged) Porto Velho Porto Velho Marab•i
UW flight number 1692 1694 1696 1697 1700 1703 1995 Aug. 23 Aug. 24 Aug. 30 Sept. 1 Sept. 5 Sept. 5
UTC 1630 1945 1500 1300 1945 1700
NASA photometer site Cuiab• INPE Pantanal Pantanal Jamari Jamari
Cloud type clear Ci Ac Ac Cu Cu
Cloud coverage, % clear thin 30-50 70-100 25 30 Optical depth --0.1 0.8 1.7 1.5 2.3 1.4 at •=550 nm 1712 Sept. 17 1500 none -0.3 Mtxed Layer Inversion height, km at PBL at PBL 0.57 0.43 0.9 2.5 at PBL Inversion pressure, hPa at PBL at PBL 944 960 911 740 at PBL Inversion temp., *C at PBL at PBL 28 29 26 11 at PBL Inversion dew point, *C at PBL at PBL 10 9 18 6 at PBL
Aerosol concentration, at PBL at PBL 110 200 180 75 at PBL
gg m -3 at STP
PBL/CBL
Inversion height, km 2.3 2.7 3.5 3.9 3.8 4.1 2.1 Inversion pressure, hPa) 757 718 650 622 629 --600 770
Inversion temp., øC 10 8 0 -2 3.5 1 12
Inversion dew point, øC -1 -I -3 -4 -10 -3 11
Aerosol concentration, 30 75 100 85 140 80 40
gg m -3 at STP
"At PBL" means the mixed layer extended to the top of the planetary boundary layer (or trade wind
inversion). CBL, convective boundary layer.
The hazes over Cuiab• during this time period were most strongly affected by locally and perhaps regionally generated smoke. The mixed layer had the lowest smoke concentrations
(10-60 I.tg
m
-3) observed
in this study. CO concentrations
in
the planetary boundary layer (PBL) varied widely between 200 and 600 parts per billion volume (ppbv). Ozone levels in Cuiab• during this period were high, averaging 70 ppbv in the late morning to over 110 ppbv in the late afternoon.
Forty-one percent of the carbon in NMHC were speciated, with the majority of the carbon apportioned to hydrocarbons with 2 or 3 carbon atoms (30%) and aromatics (13%). This is significantly lower than the roughly 80% of the carbon speciated in NMHC reported by Ferek et al. [this issue] for young smoke (<4 min old) from individual fires in Brazil. This decrease is probably a result of intense photochemistry, as suggested by the high ozone levels. The unspeciated 53% of carbon in NMHC is likely to be a suite of hydrocarbons with complicated structures such as organic acid vapors, oxygonated aromatics, and aldyhydes [Larson and Koenig, 1994].
Using the CO
2 and CO data from the gas canisters,
the
average
modified
combustion
efficiency
(MCE•--[CO2]/[CO
]
+ [CO2] ) of the smoke in Cuiab• was 0.94. This suggests that
over 85% of the smoke was from flaming combustion [Ward, 1990]. This is reasonable, since most of the fires around Cuiab• are of cerrado and grass lands, which consist of predominantly small and dry fuel.
During UW flights 1696 and 1697 (on August 30 and September 1) over the Pantanal southeast of Cuiab•, aged smoke in high concentrations from the Amazon Basin was advected from the north. The age of this smoke is somewhat uncertain but was most likely from 2 to 4 days old. During
this period the atmosphere was decoupled into a mixed layer that extended from the surface to 500 m (952 hPa) and a convective boundary layer (CBL) or residual layer (the previous day's CBL) that extended to approximately 3700 m (625 hPa). The mixed layer was neutrally stratified and capped by a strong (2øC) inversion that was 200 m thick. Fine-mode
particle concentrations in the mixed layer were >120 gg m -3,
resulting in roughly 30% of the total aerosol optical depth being in the lowest 500 m [Ross et al., this issue]. The smoke in the mixed layer was probably primarily derived from local
fires.
The residual
layer had a stable
lapse
rate (10øC
km
-1), and
the equivalent potential temperature decreased slowly with
height
(1.8øC
km-1), making
the layer slightly
conditionally
unstable. A thin altocumulus layer (<100 m thick with coverage ranging from 30 to 100%) was present at the top of the residual layer. Liquid water contents in the clouds ranged
from 0.03 to 0.13 g m -3. Smoke in the CBL/residual layer was
well mixed, with fairly uniform particle concentrations
averaging
80 I.tg
m
-3 and CO concentrations
varying
from 700
to 900 ppbv. The average MCE of the smoke varied between 0.89 and 0.92, indicating that ~60% of the smoke was due to flaming combustion. The relatively large smoldering
contribution to this smoke confares that the source of most of the smoke was forest fires to the north. Ozone concentrations
remained high and showed the same temporal pattern as for the period dominated by locally generated smoke.
3.2. Porto Velho
Flights were made in Porto Velho from September 5 to 13 (UW flights 1700-1707). Porto Velho was selected to obtain measurements of smoke generated by burning in the Amazon
32,064 REID ET AL.: SMOKE HAZES IN BRAZIl.
Basin. Winds were easterly
at 5-10 m s
-1, and the haze
included smoke particles generated from thousands of fires
over ~3000 km of fetch. Consequently, the regional haze around Porto Velho can be a mixture of fresh (<2 hours) and
well-aged smoke (>3 days old). By analyzing the trajectories
of large smoke plumes and convective complexes seen on daily GOES 8 images, we found that during the period in which our flights occurred, the smoke over Porto Velho was at most 3 to 4 days old.
During the period of our measurements, Porto Velho was on the edge of the intertropical convergence zone 0TCZ), which produced much moister conditions than were encountered in Cuiab•. Cumulus mediocris and cumulus congestus were present, with sky coverage of 30-60%, and cloud liquid water
contents ranged from 0.4-2.5 g m -3. Cloud bases were from
700 to 1000 m, and cloud tops usually reached no more than 4000 m. However, by midday, isolated cumulonimbus clouds often developed with some cloud tops higher than 10 km.
By midday, a weakly defined mixed layer was usually visible which extended from the surface to 1-2 km. However, smoke was usually well mixed from the surface to a weak trade wind inversion at 3-4 km, with particle mass concentrations
ranging
from
30 to 190 gg m
-3. The optical
depth
of the PBL
was typically above 1 but sometimes as large as 3. CO concentrations in the convective boundary layer were typically between 300 and 1000 ppbv, although values as high as 1400 ppbv were measured. The MCE of the smoke over Porto Velho ranged from 0.65 to 0.97, with a mean of 0.89. This implies that on average, the smoke was equally partitioned between flaming and smoldering combustion.
Measured ozone concentrations in Porto Velho were
significantly lower than in Cuiab•, averaging 70 ppbv. However, the mean carbon apportionment for smoke in Porto Velho was similar to that of aged smoke in Cuiab•. Because there was much variability in the age and history of the smoke encountered, the carbon apportionment varied widely.
3.3. Marabfi
Flights with the C-131A were carried out in Marab• on September 16 and 17 (UW flights 1710-1713). Marab• was selected to measure relatively young smoke from forest and
slash
burning.
With a prevailing
easterly
flow of 10 m s
-1 at
850 hPa, air trajectories were over the continent for only 24-30 hours before reaching Marab•i. Previous observations from AVHRR satellite data of biomass burning upwind of
Marabfi showed few fires within 200-300 km of the coast
[Pereira et al., 1996]. Thus smoke in the Marab• region was probably no more than 18-24 hours old.
While the C-131A aircraft was in Marabfi, the ITCZ moved south; consequently, there was a further increase in convective activity. By midday, cumulus mediocris and cumulus congestus clouds covered more than 50% of the sky, scattered cumulonimbus were present, the mixed layer extended to 2 km,
and no trade wind inversion was detectable.
Hazes over Marab• were dominated by fairly young smoke that was significantly influenced by cloud processing. Smoke was frequently seen exiting from cumulus congestus and cumulonimbus clouds. Fine particle concentrations in Marab•
ranged
from 30 to 105 •g m -3. Small forest
and grass
fires
were prevalent, even in the morning hours. Two flights were made on both of the days in Marabg, one in the morning and one in the afternoon. A distinct diurnal cycle was apparent in
smoke concentrations and properties. At 1000 LT, CO concentrations in the PBL were under 400 ppbv. Even this early in the day, there was sufficient convective activity to keep the atmosphere relatively well mixed. Few local smoke sources were visible, so the smoke studied in the mornings was likely advected from fires on the previous day located up to 500 km away. The average value of the MCE of the smoke was 0.87. This suggests that the regional haze was enriched with smoke from smoldering combustion throughout the night. In the afternoon, many local fires were visible and smoke concentrations increased by more than a factor of 2.
The mean MCE of the haze also increased to 0.90 in the afternoon.
Because the smoke in Marab• was relatively young and was located beneath considerable cloud cover, the amount of gas oxidation through photochemistry was probably minimal. Ozone levels averaged 60 ppbv from midday to late afternoon. The reduced potential for photochemical reactions also manifested itself in an increase (to 56%) in the number of identifiable hydrocarbons in Marab•, compared to an average
of 39% in the other two locations.
4. Evolution of the Gaseous Emissions
Ferek et al. [this issue] show that CO is highly correlated with all of the major hydrocarbons emitted by biomass burning in Brazil. They also found good correlations between
CO and the methyl
halide
species:
methyl
chloride
(CH3C1),
chloroform
(CHC13),
methyl
bromide
(CH3Br),
and methyl
iodide (CH3I). These correlations hold for all fires, regardless
of fuel type or combustion efficiency. This correlation is particularly useful since CO is a relatively long-lived species and is produced by combustion. Thus by comparing the ratios of a hydrocarbon species to CO in regional hazes and young smoke, the average enrichment/depletion rates for various species during smoke evolution can be derived.
Table 3 lists these ratios for all of the hydrocarbon and halocarbon species that we measured in SCAR-B in regional hazes dominated by smoke, as well as for young smoke. The ratios were defined by the regression line of each species to CO. These regressions were performed using all of the canister samples for regional haze dominated by smoke, regardless of
location. Fifteen of the 27 canisters were collected in Porto
Velho; thus Porto Velho is heavily weighted in the regressions.
Methane is a very stable hydrocarbon in the troposphere. Therefore it should not be transformed significantly by aging over several days. As expected, there is no statistically significant difference in the ratio of methane to CO between young and aged smoke (Table 3). This is a good indicator that the regional hazes we studied were not significantly affected by urban anthropogenic sources.
Table 3 shows that as the smoke evolved from individual
fires into a regional haze, there were significant transformations and depletions of many hydrocarbon species.
Most dramatic is the removal of one third of all of the carbon
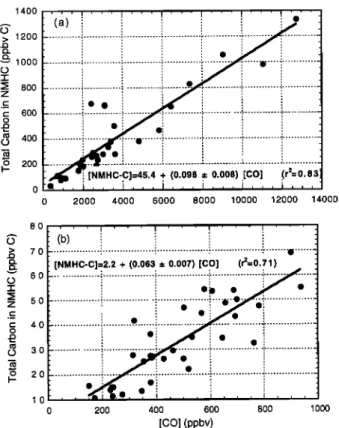
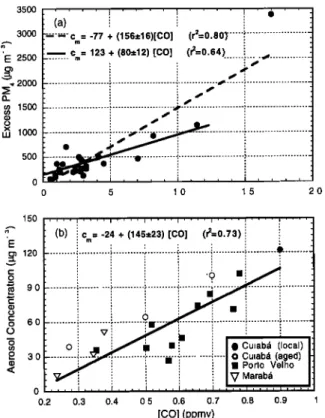
in NMHC species. This is shown by the regression relation between the total carbon in NMHC to CO for young and aged smoke (Figure 2). If these species remained in the vapor phase
in any molecule with carbon numbers less than 11, they would
probably have been detected by the gas chromatograph.
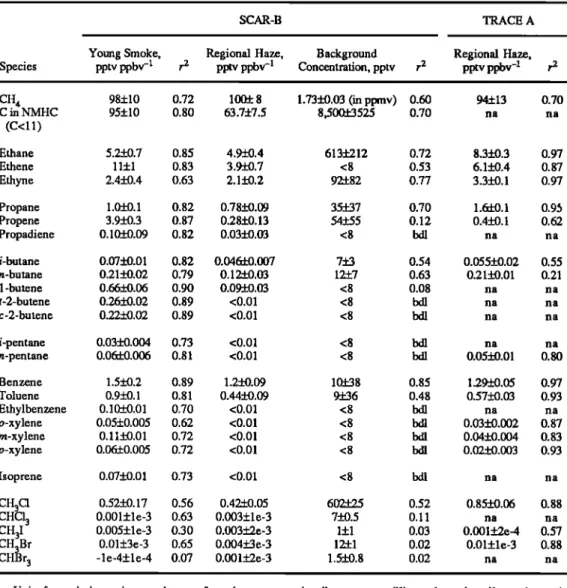
Table 3. Regression Slopes for Various Chemical Species Versus CO for Young Smoke, All of the Regional Hazes Sampled in SCAR-B, and for Brasflian Hazes in TRACE A as Reported by Blake et al. [ 1996]
SCAR-B TRACE A
Young Smoke, Regional Haze, Background Regional Haze,
Species pptv ppbv -1 r 2 pptv ppbv -• Concentration, pptv r 2 pptv ppbv -! CH 4 98+10 0.72 100•_ 8 1.73_+0.03 (in ppmv) 0.60 94+13 0.70 C in NMHC 95+10 0.80 63.7+7.5 8,500+_3525 0.70 na na (c<1•) Ethane 5.2+0.7 0.85 4.9-tO. 4 613+212 0.72 8.3_+0.3 0.97 Ethene 11+1 0.83 3.9-tO.7 <8 0.53 6.1_+0.4 0.87 Ethyne 2.4_+0.4 0.63 2.1_+0.2 92&82 0.77 3.3_+0.1 0.97 Propane 1.0-•-0.1 0.82 0.78_+0.09 35+_37 0.70 1.6•-0.1 0.95 Propene 3.9_+0.3 0.87 0.28_+0.13 54+_55 0.12 0.4_+0.1 0.62 Propadiene 0.10-•.09 0.82 0.03_+0.03 <8 Ixll na na /-butane 0.07_+0.01 0.82 0.046•-0.007 7+_3 0.54 0.055+0.02 0.55 n-butane 0.21_+0.02 0.79 0.12_+0.03 12•.7 0.63 0.21_+0.01 0.21 1-butene 0.66_+0.06 0.90 0.09-Z-0.03 <8 0.08 na na t-2-butene 0.26_+0.02 0.89 <0.01 <8 bdl na na c-2-butene 0.22_+0.02 0.89 <0.01 <8 bdl na na i-pentane 0.03+0.004 0.73 <0.01 <8 bdl na na n-pentane 0.06+0.006 0.81 <0.01 <8 ball 0.05_+0.01 0.80 Benzene 1.5_+0.2 0.89 1.2_+0.09 10+_38 0.85 1.29-Z'0.05 0.97 Toluene 0.9_+0.1 0.81 0.44•-0.09 9+_36 0.48 0.57_+0.03 0.93 Ethylbenzene 0.10-Z-0.01 0.70 <0.01 <8 bdl na na o-xylene 0.05+0.005 0.62 <0.01 <8 bdl 0.03_+0.002 0.87 m-xylene 0.11_+0.01 0.72 <0.01 <8 bdl 0.04_+0.004 0.83 p-xylene 0.06•_0.005 0.72 <0.01 <8 bdl 0.02_+0.003 0.93 Isoprene 0.07_+0.01 0.73 <0.01 <8 bdl na na CH3CI 0.52_+0.17 0.56 0.42_+0.05 602•5 0.52 0.85_+0.06 0.88 CHC13 0.001+le-3 0.63 0.003+1e-3 7_+0.5 0.11 na na CH3I 0.005+1e-3 0.30 0.003+_2e-3 1+1 0.03 0.001+2e-4 0.57 CH3Br 0.01+3e-3 0.65 0.004+_3e-3 12&l 0.02 0.01+le-3 0.88 CHBr 3 -le-4+le-4 0.07 0.001+_2e-3 1.5_+0.8 0.02 na na
Units for emission ratios are change of species concentration (in parts per trillion volume (pptv)) per change in CO (in pans per billion volume (ppbv)). Also shown for SCAR-B are estimates of the natural "background"
concentrations; bdl, below detectable limits; na, not available.
into CO 2 or CO, transformed into large or reactive molecules,
which were not detectable by the gas chromatograph, removed from the atmosphere, and/or transformed into particulate matter.
Carbon can be removed from the atmosphere by wet and dry deposition. Since cumulonimbus clouds were present in Porto Velho and Marabe, some wet deposition may have occurred. However, since precipitating clouds were isolated, it is unlikely that they played a major role in carbon deposition.
Dry deposition of the reactive hydrocarbons is a more likely removal process. Intense solar radiation in the tropics probably transforms many of the hydrocarbons emitted from fires into very reactive species. Reactive gas species have dry
deposition
velocities
of the order
of 1 cm s
-1 [Sehmel,
1980],
which could cause hydrocarbon losses of the magnitude we measured in about 2 days. Dry deposition rates would have been substantially enhanced by the considerable amount of surface area of vegetation in the forests. On the other hand, the atmosphere was frequently decoupled with an inversion
separating the mixed and convective boundary layers. Furthermore, during early morning flights, a very strong nocturnal boundary layer was observed. Such inversions would substantially reduce the flux of hydrocarbons from the
CBL to the surface. As will be discussed later, there is also
evidence that a significant fraction of the depleted carbon in the NMHC was converted to particulate matter.
On average, the ratio of allcanes to CO were reduced by 30%
during the evolution of the smoke from fires to regional haze. Because alkanes are generally nonreactive and have low solubilities, it is unlikely they were removed from the atmosphere through wet or dry deposition; more likely, they
were transformed into other species such as CO 2, CO, and
oxygenates by photochemical or free radical reactions. Emission ratios for alkenes and aromatics dramatically decreased during plume evolution: 75-100% of the measured
alkenes and 25-100% of the identified aromatics were
transformed into other species or removed during evolution. Correlation coefficients between stable species, such as
32,066 REID ET AL.: SMOKE HAZES IN BRAZIL 1400 1200 1000 8OO 6OO 4OO 2OO ... i ... ! .... ß ... '! ... :.' ... '..' ... ',' ... 0 2000 4000 6000 8000 10000 12000 14000 8O > 70 60 • 50 z ._: õ 40 0 30 o 20 10 (b) [NMHC-C]=2.2 + (0.063 -,- 0.007) [CO] (r•=0.71)
...
i ...
i ...
....
;':i
....
...
... { ... •- ... :. •- ... ! ... ! ... 0 200 400 600 800 1000 [CO] (ppbv)Figure 2. Regressions of total carbon in nonmethane
hydrocarbon (NMHC) species to CO for (a) young smoke from
Ferek et al. [this issue] and (b) regional hazes dominated by
smoke in Brazil.
ethane
and
benzene,
and CO were
good
(r2> 0.6). However,
for the more reactive species, correlation coefficients were low
(typically
r2<0.5). This was probably
due to the varying
histories of the air parcels sampled. Alkenes and aromatics
(other
than
benzene)
typically
have
very short
photochemical
lifetimes,
ranging
from under
an hour for butenes
to days
for
toluene
[Finlayson-Pitts
and Pitts, 1986]. Thus
the age of a
sampled
air parcel
should
have
a large
effect
on the ratio
of a
reactive species to CO.Included in Table 3 are estimates of the background
concentrations of the hydrocarbons. By "background" we
mean the concentration of gases that would likely exist if the
atmosphere
had
not been
perturbed
by biomass
burning.
The
background
concentrations
of hydrocarbons
were found
by
extrapolating
the hydrocarbon
versus
CO regression
line to a
CO value
of 100 ppbv
(a typical
CO value
for continental
air
masses).
As can be seen
in Table 3, the concentrations
of
many of the hydrocarbons were strongly influenced by biogenic or other regional emissions. On average, 20% of the carbon (approximately 8 ppbc) in the form of NMHC in the atmosphere was associated with sources other than combustion. The predominant background species were ethane, ethyne, butane, benzene, and toluene. These background values are in reasonable agreement with the results of Zimmerman et al. [1988] in the Amazon.
The strongest halocarbons associated with biomass burning
were
CH3C1,
CHC13,
CH3I, and
CH3Br
[Ferek
et al., this
issue].
CH3C1, CHC13,
and CH3I did not show any statistically
significant reduction during evolution to regional hazes.
However, the ratio of CH3Br to CO decreased by a factor of 2.
Furthermore, correlations of CH3Br and CH3I with CO were
extremely
low (r2<0.05), indicating
either reactions
in the
atmosphere or the existence of other significant sources. All of the halocarbon species had relatively high background concentrations in the regional hazes. For example, we estimate that the background concentration of methyl chloride was about 600 pptv. However, on the most polluted days the methyl chloride concentration was perturbed by 300-500 pptv. Thus about one third to one half of the methyl chloride and methyl iodide in the regional hazes can be attributed to biomass burning. Biomass burning contributed less than 30% to the methyl bromide in the regional hazes.
Most of the ratios of the hydrocarbons and halocarbons to CO measured in regional hazes in SCAR-B are similar (within 20%) to those measured in haze layers over Brazil during TRACE A [Blake et al., 1996]. However, there are significant
differences between our ratios of alkenes and CH3C1 to those
reported by Blake et al. For the alkenes the difference is attributed to their high dependence on plume age. As discussed above, alkenes have photochemical lifetimes of the order of hours to days. Blake et al. performed measurements on only a few plumes in a different part of the continent; it is likely that the hazes had different ages than those we studied.
The CH3C1
ratio reported
by Blake
et al. [1996] are slightly
higher than the values for young smoke given in Table 3 and by Ferek et al. [this issue]. Because similar apparatus, protocols, and standards were used in both studies, the difference is likely due to sampling emphasis. The gas ratios given in the present paper are based on many measurements in regional hazes at three locations in Brazil. Similarly, the results from Ferek et al. [this issue] are for measurements on 25
individual fires at the same three locations for which data are
presented in this paper. Therefore the results presented here and by Ferek et al. [this issue] are for the ensemble average of many fires and plume histories. The TRACE A results, on the other hand, are based on samples from a much smaller number
of haze layers. McKenzie et al. [1997] report that CH3C1/CO
for smoke from biomass fires is predominantly a function of the chlorine content of the fuel, which is particularly high in savanna grasses compared to forest material. Different individual fuel conditions might perturb the emissions of
CH3C1 and CO more than those of the hydrocarbons, making
the relatively small number of samples collected in Brazil in TRACE A more vulnerable to being unrepresentative of the region.
5. Particle Properties
5.1. Size Distributions
A summary of the particle size distribution parameters,
derived from the DMPS and PCASP, is given in Table 4. The
particle size distributions varied greatly by region. Overall,
there were trends of increasing particle size and decreasing standard deviations with increasing smoke age. For example,
the largest particles where associated with hazes over Porto
Velho and the well-aged smoke episode over Cuiab• (ACMD
and A VMD of 0.06 i.tm and 0.08 i.tm, respectively).
Conversely, regions and time periods associated with
predominately local smoke, for example in Marabe, had
particle count median diameters and volume median diameters
(CMD and VMD, respectively) of only 0.01 to 0.02 i.tm greater
Table 4. Aerosol Particle Size Distribution Parameters (Mean + Standard Deviation) for Cuiab• (Local Haze), Cuiabg (Aged Haze), Porto Velho, and
Marabg
Cuiab• Cuiab•
Parameter Young Smoke (Local) (Aged) Porto Velho Marab•
CMD (!.tm) (from DMPS) 0.12_+0.02 0.13_+0.04 0.18_+0.02 0.18_+0.03 0.11_+0.02 (from DMPS) 1.73_+0.07 1.74t-0.13 1.68_+0.16 1.63_+0.16 1.85_+0.17 (gxn) (from DMPS) 0.26_+0.02 0.28_+0.05 0.35_+0.04 0.34_+0.07 0.3(}-!0.04 •,, (from DMPS) 1.73_+0.06 1.58_-!0.08 1.48t-0.07 1.51_+0.10 1.64_-!0.30 CMD (g.m) (from PCASP) na 0.15_+0.03 0.21t-0.01 0.21_+0.03 0.13_-_+0.03 (from PCASP) na 1.6 + 0.08 1.56!-0.06 1.55_+0.09 1.83_-!0.21 (pxn) (from PCASP) na 0.25_+0.02 0.3(}-!0.01 0.29_-_+0.02 0.27_+0.01
(from
PCASP)
na
1.34_+0.07
1.24_-!0.02
1.26_-!0.04
1.35_+0.05
Also shown are the particle size parameters for young smoke from biomass burning from
Reid and Hobbs [this issue] assuming an MCE of 0.89. CMD, count median diameter; VMD,
volume
median
diameter;,
og,
geometeric
standard
deviation;
na,
not
available.
Table 4 shows some differences between the particle sizes from the DMPS and PCASP. Regression relations between DMPS and PCASP measurements are given in Table 5. As indicated by the low correlation coefficients for these regressions, there was a significant amount of scatter in the measurements. The CMD from the PCASP is 10% greater than those generated by the DMPS (albeit not statistically significantly). Conversely, the VMD and standard deviations measured by the DMPS are 10% greater than those from the PCASP. There are several possible reasons for these differences. In particular, the PCASP measurements depend on the scattering properties of the aerosol, while the DMPS measurements are based on particle electromobility. The response function of the PCASP is highly sensitive to refractive index for aerosols in the diameter range 0.3-0.8 I. tm. If the particles have a refractive index that is lower than the
assumed value of 1.5-0.02i, the PCASP will underestimate the
particle volume median diameter and standard deviation. Also, derivation of particle sizes from the DMPS requires an
inversion,
which
may artificially
increase
the VMD and
Og
v
values [Winklmayr et al., 1991]. Finally, the DMPS samples were from the grab bag, where the relative humidity was similar (perhaps slightly lower due to increased cabin temperature) to that of the ambient air. The PCASP, on the other hand, dries the aerosol to a humidity <35%, which should remove any water or high-volatility hydrocarbons.Table 5. Regression Relations Between Lognormal Particle
Fit Parameters Derived From the DMPS and PCASP Particle
S izir.g Inslxuments for All Data Obtained From the UW C-131A Aircraft in Regional Hazes in Brazil
, , Parameter Relationship r 2 CMD gc VMD DMPS = -0.005 + 0.82 x PCASP 0.57 DMPS = 0.605 + 0.69 x PCASP 0.56 DMPS = 0.016 + 1.07 x PCASP 0.40 DMPS = 0.377 + 0.89 x PCASP 0.21 r, correlation coefficient.
However, since the smoke particles encountered in SCAR-B had low-humidification factors [Kotchenruther and Hobbs, this issue], drying should have caused no more than a 0.02 I. tm decrease in the particle VMD. The actual ambient aerosol size distribution is likely to lie somewhere between the DMPS and
PCASP measurements. Because the PCASP dries the aerosol
and has a significantly higher smnpling frequency than the
DMPS, we will concentrate on the measurements from the
PCASP in the remainder of this paper.
Particle number and volume distributions typical of regional hazes dominated by smoke are shown in Figure 3.
25000 20000 15000 10000 5OOO 0 O.
(a)
.•
• Cuiabgt
- •Cui.abA(local)
(aged) ... l, ... •or[o Vel15o ,, ,, --v-- Maraba m.¾' ... •b' ... •: ... Q'" ... • ... -. • •:: t' '!...
;•
...
•. ...
! ...
1 3OOI I _ CuiabA
(Iocal)[
(b)
!"
- • - Cuiabgt
(aged)l
250
...
i'""";:i
...
- -v- - Marabam''
Pørtø
Vemhø
I
] • ID') 200 ... -,,',..p. . ... • ... .9.0 I• ' •s0 ... ;.• .... -; .... •: ... '• :1 % ' " > -•1 • ' '• ... •: ... .q...; ... • ...•oo ,,r' • ".
'i
... ¾.a,..•
...
.•
...
o •'- , , , '•_- --'•-'"_-":•-•"-= , • 0.1 1 Diameter, d. (pm)Figure 3. Typical (a) particle number and (b) particle volume distributions measured near 800 hPa in regional hazes dominated by smoke near Cuiab•, Porto Velho, and Marabii.
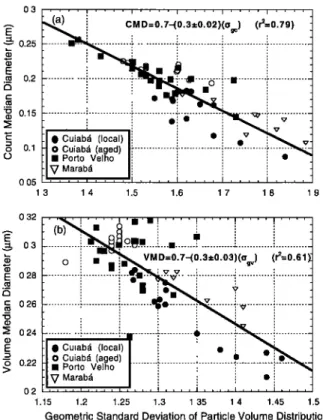
32,068 REID ET AL.: SMOKE HAZES IN BRAZII. 0.3 • 0.25 to 0.2 ._ ._• • 0.15 o 0.1 0.05 1.3
(a••= c
M
D
=
0.7_(0.3.,.0.02)(ogc)
(r2=0.79)
: ß 0oc) ! ø 'i o" ! F• ß Porto Velho ! { [ ßt Y,M,
ar,a
.... 'i .... i .... :, ....
1.4 1.5 1.6 1.7 1.8 1.90.32
,. "w.'
,: 'i' ' ' 'h'm?
....
... ....
...
.,.
...
L O 'i •'-::'•B VMD=0.7-(0.3ñ0.03)(Ogv)
(r'=0.61)•
0.28
0.26
...
:i
...
• O Cuiab•. (aged) 0.22 • [] Porto Velho ! ... 0.2 '''• .... • .... • .... •''' 1.15 1.2 1.25 1.3 1.35 1.4 1.45 1.5 Geometric Standard Deviation of Particle Volume DistributionFigure 4. (a) Count median diameter (CMD) versus
geometric standard
deviation ((5 ) for particle number
gcdistribution and (b) volume median diameter (VMD) versus
geometric standard deviation ((5 ) for particle volume gv
distribution, for regional hazes domifiated by smoke in Brazil.
distributions at three pressure levels (650, 800, and 970 hPa) are shown in Figure 5. These data were collected in a vertical profile in well-aged regional haze near Porto Velho. The measurements at 650 hPa level (~4 km) were above the haze layer in the free troposphere. Here the aerosol concentrations
are low (<10 !zg m -3) and the size distribution
broad.
However, the number distribution exhibits the same bimodal nature as the aged smoke shown in Figure 3. The 800 hPa flight level was at the top of the mixed layer. Here, the
particle
concentration
are high (>150 !zg
m-3), and
the number
distribution takes on the ramp-like shape of the aged smoke shown in Figure 3. At the base of the mixed layer (970 hPa level) the particle mass concentration and size distribution were generally similar to those at the top of the mixed layer. However, there was a significant increase in the number of particles with diameters less than 0.14 !zm diameter. An increase in the number of particles of this size was always observed when sampling near the surface in forested regions. Hence they may have a biogenic origin. The perturbations in the particle number distributions did not have an appreciable
effect on the volume distributions.
5.2. Compositions
A summary of the ionic compositions of the particles in the young smoke and in the regional hazes is given in Table 6. Also shown in this table are the percentages of black carbon in the aerosol from thermal evolution analysis and Fe from PIXE. Of the 62 samples subjected to IC analysis, 41 were analyzed by PIXE for Fe and 38 for black carbon.
The data in Table 6 show that the compositions of the particles in the regional hazes were significantly different
The number distributions show a clear distinction between
young and aged smoke. In the Cuiabfi (local) case, the particle number distribution is essentially lognormal, and the particle sizes are small. In Marabfi the particle sizes are also small, with a modal diameter <0.12 Fm. Both of these number distributions are similar to those for the young smoke [Reid and Hobbs, this issue]. For the aged smoke in Cuiabfi and Porto Velho the particle number distributions have a ramp-like structure, with two significant modes at 0.2 and 0.3 diameter. Because of this shape, the CMD determined by the lognormal curve fit was 0.04 Fm smaller than the count
distribution mode. Because these modes are almost twice as
large as the CMD reported by Reid and Hobbs [this issue] for young smoke, it is likely they were produced as the smoke evolved into the regional haze.
There were also significant differences in the particle volume distributions of the young and aged smoke. In aged smoke, the volume distribution was nearly lognormal. However, the volume distributions of the Cuiabfi (local) and Marabfi cases were somewhat ramp shaped.
As the median diameters of the particles increased, there was a tendency for the standard deviations to narrow during smoke aging (Figure 4). This tendency was particularly strong for the younger hazes, such as the Cuiab5 (local) and Marabfi cases. There are also strong anticorrelations between the particle
count median diameter and the standard deviation for the number distributions measured with the DMPS.
The particle size distributions varied slightly with altitude. As an example, plots of particle number and volume
25000 20000 15000 10000 5OO0 (a)
-..,,o ...
:,-(
...
B"800 hPa [ 650 hPa • o _ ,,1,---• -._-, o.1 300(b)
I
250 ... t----• ... • 200 '-' 15o ... t ... t ... 'o 100 ... • ... -•. ... =1• 800 hPa¾. 970 hPa •'. 5 o ... -• ... •0-'•'• ... i:'•': ...r•_'•
'" _.-
--...,
00.1
Diameter,
dp
(pm)
1
,Figure 5. (a) Particle number and (b) particle volume distributions measured at three pressure levels in a profile flight over the NASA Jamari Sun photometer site near Porto Velho in regional haze dominated by smoke.