HAL Id: cea-01947738
https://hal-cea.archives-ouvertes.fr/cea-01947738
Submitted on 7 Dec 2018
HAL is a multi-disciplinary open access
archive for the deposit and dissemination of
sci-entific research documents, whether they are
pub-lished or not. The documents may come from
teaching and research institutions in France or
abroad, or from public or private research centers.
L’archive ouverte pluridisciplinaire HAL, est
destinée au dépôt et à la diffusion de documents
scientifiques de niveau recherche, publiés ou non,
émanant des établissements d’enseignement et de
recherche français ou étrangers, des laboratoires
publics ou privés.
SABRE-hyperpolarized mixtures
Ludmilla Guduff, Patrick Berthault, Carine van Heijenoort, Jean-Nicolas
Dumez, Gaspard Huber
To cite this version:
Ludmilla Guduff, Patrick Berthault, Carine van Heijenoort, Jean-Nicolas Dumez, Gaspard
Huber.
Single-scan diffusion-ordered NMR spectroscopy of SABRE-hyperpolarized mixtures.
Single-scan diffusion-ordered
NMR spectroscopy of
SABRE-hyperpolarized mixtures
Ludmilla Guduff,
[a]Patrick Berthault,
[b]Carine van
Heijenoort,
[a]Jean-Nicolas Dumez*,
[a]and
Gaspard Huber*
[b]Abstract: The analysis of complex mixtures of dissolved molecules is a major challenge, especially for systems that gradually evolve, e.g., in the course of a chemical reaction or in the case of chemical instability. 1D NMR is a fast and non-invasive method suitable for detailed molecular analysis, though of low sensitivity. Moreover, the spectral resolution of proton, the most commonly used and most sensitive stable isotope in NMR, is also quite limited. Spatially encoded (SPEN) experiments aim at creating in one acquisition a 2D data set by simultaneously performing different 1D sub-experiments on different slices of the NMR tube, at the price of an extra loss of sensitivity. Choosing translational diffusion coefficients as the additional dimension (the so-called DOSY approach) helps to recover proton spectra of each molecule in a mixture. The sensitivity limitation of SPEN NMR can, on the other hand, be addressed with hyperpolarization methods. Within hyperpolarization methods, signal amplification by revers ble exchange (SABRE), based on parahydrogen, is the cheapest and the easiest one to set up, and allows multi-shot experiments. Here we show that the spectra of a mixture’s components at millimolar concentration are resolved in few seconds by combining the SABRE, SPEN and DOSY concepts.
Introduction
A large number of current analytical methods involve physical separation of the analytes by, e.g., phase separation and/or chromatography steps, as well as derivatization steps. In the case of systems that evolve in time, however, such separation-based methods may not be applicable or may lead to erroneous results. Instability may concern chemical composition and concentrations, e.g., in organic reactions or metabolic pools.[1,2] Also aggregation
may gradually occur for dissolved species. It is for example a phenomenon of high biological importance for proteins.[3] There is
thus a need for fast analytical methods for the direct, separation-free identification of molecules in a mixture.
Nuclear magnetic resonance (NMR) spectroscopy is a powerful tool for the direct analysis of mixtures, provided that the analysis can be fast compared to the reaction or aggregation timescale. Acquiring a time-series of one-dimensional NMR spectra is the simplest way to record data with high temporal resolution, roughly at the second time-scale. When higher spectral resolution or information content is required, 2D experiments would be appropriate, were it not for the long experiment duration required to sequentially acquire the many 1D spectra from which nD spectra are calculated. For this reason, multiple strategies have been introduced to accelerate the acquisition of multidimensional NMR experiments.[4,5] One of
these rely on spatial encoding (SPEN) of the NMR interactions to acquire 2D spectra in a single scan.[4,6] SPEN methods can be
seen as the parallelized acquisition of a 2D data set by simultaneously recording different 1D spectra on different slices, each of them experiencing its own NMR sequence.
One of the most widely used multidimensional NMR methods for mixture analysis is diffusion-ordered spectroscopy (DOSY), which discriminates molecules according to their translational diffusion along an axis defined by pulsed field gradients. In its most common implementation, the DOSY method is based on the measurement of signal amplitudes or areas as a function of the diffusion wave vector G (where is the gyromagnetic ratio, G is the gradient strength and its duration) for a pair of gradient pulses separated by a fixed delay . This method thus involves the acquisition of several spectra with varying gradient intensities, and typically requires experiment durations of several minutes. The acquisition of DOSY data in a much shorter time, typically in seconds for 0.1 M mixtures, has been demonstrated with various approaches based on multiple echoes induced by a train of gradient or RF pulses.[7–9] These methods typically sacrifice
spectral resolution and require a long transverse relaxation time. Fast DOSY experiments based on spatial encoding have also been reported.[10–12] With SPEN DOSY, 2D data sets are recorded
in less than one second. The applicability of fast nD NMR is, however, also governed by the spectral resolution and sensitivity limitations of the method.
Hyperpolarization (HP) is a method of choice to counteract the low sensitivity of NMR. It consists of transiently increasing population differences between nuclear spin energy levels. For solution-state NMR, two methods in particular have revealed their potential for the analysis of diluted mixtures,[13] namely dissolution
dynamic nuclear polarization (D-DNP)[14] and para-hydrogen
(p-H2) based signal amplification by reversible exchange
(SABRE).[15–18] Fast nD NMR methods are particular relevant in
combination with hyperpolarization, because they are compatible with the transient character of the out-of-equilibrium magnetization even when they are implemented in a single-shot manner.[18–20] While SABRE allows multi-shot experiments (with
repetition times of ~ 40 s)[15], the original and still commonly used
protocol for SABRE experiments consists of manually shaking a mixture of the substrate, p-H2 and a catalyst, before insertion in
the NMR magnet. As a result, polarization levels return to the
[a] Dr. L. Guduff, Dr. C. van Heijenoort, Dr. J.-N. Dumez Institut de Chimie des Substances Naturelles, CNRS UPR2301 Univ. Paris Sud, Université Paris-Saclay, 91190 Gif-sur-Yvette (France)
E-mail: [email protected] [b] Dr. P. Berthault, Dr. G. Huber
NIMBE, CEA, CNRS, Université Paris-Saclay CEA Saclay, 91191 Gif‐sur‐Yvette, France. Email: [email protected]
thermal equilibrium value in a time that is not compatible with the acquisition of nD spectra by conventional means.
Recently, SPEN-DOSY spectra were acquired for substrates polarized by dissolution dynamic nuclear polarization (D-DNP).[21]
These substrates were simple metabolites enriched in 13C on a
quaternary-carbon position, thus with a long (ca. 30 s) longitudinal
13C relaxation time. This enabled acquisition of several
SPEN-DOSY spectra in a single D-DNP experiment, at a concentration of 20 mM for each substrate. For SABRE, Reile et al. have shown that the method may be used in combination with conventional DOSY in multi-shot experiments in order to analyse micromolar mixtures, with experiment durations of 35 minutes.[15]
In this Article, we study the feasibility of analyzing self-diffusion of the components of a millimolar mixture of molecules in a single scan with SPEN-DOSY sequences. In this purpose, as a proof-of-concept, we use a mixture of molecules hyperpolarized through the SABRE method. The optimization of this SABRE-SPEN-DOSY concept, including experimental set-up, NMR sequences and parameters, and the biases on the extracted diffusion coefficients originating from convection and methods to fit the diffusion coefficients are examined.
Scheme 1. Structure and nomenclature of substrates used in this study. The abbreviations indicate: pyridine (p), N,N-dimethylnicotinamide (d), 3-ethylpyridine (3) and 4,4’-bipyridyl (b).
Results and Discussion
The SABRE approach can provide 1H polarization levels of up to
50%[22] and has been applied to several classes of substrates
(see for examples refs [16,23–25]). It is most efficient for molecules
that contain N-heteroaromatic rings, but has recently been extended to substrates containing exchangeable protons (SABRE-RELAY)[26]. At a magnetic field of 11.7 T, corresponding
to a 1H Larmor frequency of 500 MHz, this corresponds to signal
enhancements of 12500 at room temperature. The possibility to collect DOSY data in a single scan from SABRE-hyperpolarized molecules is evaluated here on a simple mixture of four small molecules (Scheme 1): pyridine (p), N,N-dimethylnicotinamide (d), 3-ethylpyridine (e) and 4,4’-bipyridyl (b). The 1H NMR spectrum
and their and longitudinal relaxation times, in SABRE conditions, are given in Figure S1 and Table S1. Two signals are almost superimposed, corresponding to the para proton of pyridine py-p and the meta proton of bipyridyl (bpy-m), and the consequences of this will be discussed. The mixture is analyzed either at thermal equilibrium (without catalyst and at a concentration of 150mM for each substrate), or with SABRE hyperpolarization (with a 1 mM catalyst and 5mM concentration for each substrate).
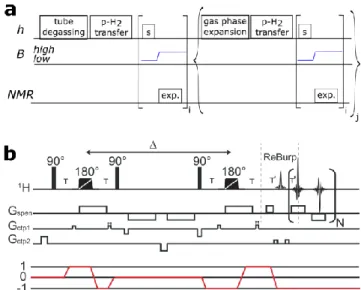
Figure 1a depicts the experimental procedure used here for SABRE experiments, which relies on manual sample shaking. The NMR tube containing the liquid solution is degassed to remove oxygen that would otherwise catalyze para-ortho isomerization of dihydrogen.[27] Then enriched pH2 is transferred
in the NMR tube that is subsequently shaken in a field of 6.5 mT and quickly introduced in the spectrometer for analysis.
Figure 1. Description of the SABRE-SPEN-DOSY experiments. a) Timing of the experiment: NMR tube shakings, noted s, NMR acquisitions, noted exp., "low" means magnetic field of 6.5 mT, "high" means 11.7 T. i and j denote the potential repetition of NMR experiments on he same sample. b) SPEN STE-DOSY pulse sequence. Gradients are shown on 3 logical channels with diffusion encoding and decoding gradients on the SPEN line, and ctp1 and ctp2 correspond to the coherence transfer pathway (CTP) selection. 180° are chirp pulses.
For SABRE applications, the dead time that elapses between the end of the shaking step and the start of acquisition should not be too long compared to the longitudinal relaxation time of the aromatic protons. At 11.7 T, their longitudinal relaxation times T1
are in the range 4-21 s in a solution containing 5 mM of each of the four substrates and 1 mM of the catalyst precursor. This T1
value is a weighted average of that of the free substrate and that of the substrate complexed to the iridium metal. A delay of 5 s is chosen here to achieve the lock of the deuterium signal and the recovery of most of the field homogeneity. The tube shaking-NMR experiment procedure may be repeated several times with the same batch of p-H2, albeit with progressively lower sensitivity due
to the lowering enrichment of dissolved dihydrogen in the para isomer. Each acquisition cycle induces a decrease of signal intensity of about 30%, as obtained from independent
experiments where a 1H 1D NMR spectrum was recorded after
each shaking (Figure S2). This cycle takes less than one minute. The NMR tube can then be filled with freshly prepared parahydrogen. This takes less than 5 minutes and restores the maximum sensitivity.
With this optimized hyperpolarization protocol, we have then investigated the STE (stimulated echo) version of the SPEN-DOSY pulse sequence which is shown on Figure 1b. In this experiment, two 90° pulses bracketed by bipolar gradient pulses separated by the diffusion delay Δ, are used for longitudinal storage of the magnetization during the diffusion delay. A pair of chirp pulses associated to gradient pulses is used to perform spatial encoding of the diffusion information. Acquisition is performed using echo planar spectroscopic imaging (EPSI), with a train of N pairs of gradients pulses. The use of a triple axis gradient probe makes it possible to separate the gradients for diffusion encoding and the gradients for selection of the coherence pathway.[12]
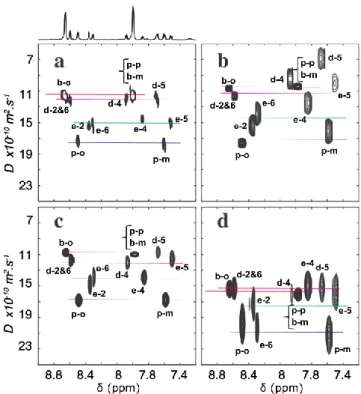
Figure 2a shows a conventional DOSY spectrum obtained on a stable, well-shimmed and locked sample of the model mixture. Fitted diffusion coefficients for well-resolved signals are easy to cluster for pyridine and ethyl-pyridine, while the separation is less pronounced between bipyridyl (b) and dimethylnicotinamide (d). For the overlapped signals of the para protons of pyridine (p-p) and the meta protons of 4,4'-bipyridyl (b-m), the estimated diffusion coefficients are close that of the meta proton of bipyridyl. The concentration of these two compounds in the mixture are very close, but there are 4 b-m protons per 4,4'-bipyridyl molecule versus 1 p-p per pyridine molecule, so that b-m has a dominant contribution to this signal, as long as thermal polarizations are considered. It is well known that the molecular mass is not the unique parameter affecting diffusion ; the solvent can have a significant effect.[28] We note that the diffusion coefficients of the
4 substrates are in reverse order of their molecular mass. This is also true for 4,4’-bipyridyl and dimethylnicotinamide whose molecular masses however differ by only 4%.[28]
Figure 2. Aromatic regions of the rebuilt DOSY 1H NMR spectra of the solution
containing the four substrates at ca. 150 mM. a) Conventional DOSY spectrum. Projection on the spectral axis is displayed. b-d) SPEN-DOSY spectra with diffusion measured according to the z axis. Spectra acquired with optimized shims and limited convection for b) and c), and recorded just after having shaken the NMR tube for d). The data are processed using magnitude mode for b), and using absorption mode, for a), c) and d). The linewidth in the diffusion dimension denotes the standard deviation obtained from the fit. Signal assignment according to nomenclature in Scheme 1. Each colored line corresponds to one molecule.
Figure 2b shows the SPEN-DOSY spectrum of the model mixture, also obtained on a stable, well-locked and shimmed sample. The diffusion information has been encoded along the longitudinal axis (z), and the data have been processed in magnitude mode. In this case, the discrimination of the four molecules is hardly possible. The processing in magnitude mode, which is widely used for spatially encoded experiments, induces a decrease of spectral resolution, detrimental for the diffusion-based separation of spectra. While the data acquired in a single scan with echo-planar spectroscopic imaging (EPSI) for UF2D NMR spectra such as UFCOSY are not compatible with pure-absorption processing, the situation is different with SPEN DOSY. Provided that the chemical-shift evolution is refocused at the center of the first acquisition gradient, pure absorption processing should be possible for the so-called odd echoes of the EPSI train that are located at k = 0 in the reciprocal space. Using a modified timing for the pulse sequence and a pure absorption processing of the data, a much better clusterization of the diffusion coefficient values is obtained, except for signals d-5 and e-5 (Figure 2c). However, the extracted diffusion coefficients are lower using the conventional DOSY spectrum (Figure 2a) than using the SPEN-DOSY spectrum (Figure 2c) for 10 out of the 11 signals. This is due in part to the uncorrected non-uniformity of the gradients,
since the conventional and SPEN experiments are performed on a different spatial region: the full coil region for the conventional experiments, the central 10 mm for SPEN. In the SPEN spectra, diffusion coefficients are also found to be slightly smaller when the data is processed in magnitude mode than when it is processed in absorption mode for most signals (Figure 2b vs 2c). Indeed, in magnitude mode, the noise is not null in average and induces a systematic overestimate of integrals. The smallest integrals being proportionally more affected, this induces a bias in the extracted diffusion coefficient, as Equation 1 in the Processing Section does not take this effect into account. This is corroborated by a simulation shown on Figure S3. This reinforces the advantage of using pure-absorption rather than magnitude processing, and the former was used in the rest of this study.
The main expected challenge for SABRE DOSY experiments that rely on a sample shaking protocol is the effect of strong liquid motions on scales much larger than the translational diffusion, which can distort the diffusion information. This is illustrated in Figure 2d with a SPEN DOSY spectrum recorded using the STE sequence of Fig. 1b, with diffusion encoding along the z axis, 5 s after having shaken the NMR tube for 15 s outside the magnet. The diffusion coefficients are largely overestimated and the accuracy of the fit decreases, preventing the discrimination of molecules according to their diffusion coefficients. This can be explained by unwanted sample motion that occurs mainly along the z axis, even after tens of seconds. Indeed, while bubbles seen by naked eye reach the liquid surface long before the end of the 5 seconds dead time, their effects may last for a longer duration. An induced vertical convection occurs, acting on the apparent diffusion coefficients (Figure S4). Moreover, micro-bubbles might be created. In that case, their lifetime may be much longer and their rising velocity smaller, acting as a long-term effect on the accuracy of the extracted diffusion coefficients.[29,30]
To avoid the convection effects on the apparent diffusion coefficients, a possible solution would be the use of a double stimulated-echo SPEN DOSY pulse sequence[21] instead of the
single stimulated echo used here. Indeed the second diffusion-encoding step should cancel the effect of convection. However in this case the results are of a lower quality than for previous studies, even in the absence of sample shaking.[31] We suspect
that scalar couplings involving the detected nuclei, which are more significant in the present study, are responsible of this failure of the DSTE approach. Solutions to deal with motions within the sample, other than using a different pulse sequence, would involve a more elaborate experimental setup, such as a membrane reactor outside the spectrometer[32], or a capillary
plunging into the NMR solution, inside the spectrometer,[33] albeit
with a lower NMR signal enhancement factor.[34,35]
Another approach to solve the convection problem, which does not require a modified set-up, is to use a transverse axis to encode diffusion. The underlying idea is that unwanted motions are probably more important on the z axis due to the anisotropy of the NMR tube.
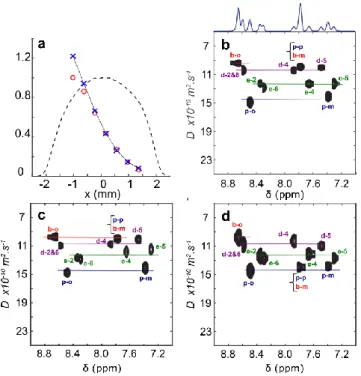
Figure 3. SPEN-DOSY recorded along the x axis. a-c) with the solution containing the four substrates depicted in Scheme 1, at ca. 150 mM each, using the absorp ion mode for processing. a) 1H NMR signal as a function of he x
coordinate. Red circles: raw data, blue crosses: data corrected by the 1H spatial
density (profile of the tube along the x axis given by the dashed line), continuous line: fitted diffusion curve for the p-o signal. b) Reconstructed spectrum acquired with optimized shims and limited convection. Projection on spectral axis is displayed. c) Reconstructed spectrum acquired 5 s after having shaken the NMR tube. d) SABRE-SPEN-UFDOSY spectrum on a 1 mM catalyst solution, each 4 substrates concentrated at 5 mM, and processed in absorption mode. Assignment of signals according to nomenclature in Scheme 1. Color lines stand for each molecules.
Processing SPEN DOSY data acquired with transverse encoding needs to consider the spin density profile of the NMR tube. As SPEN experiments can be considered as the simultaneous acquisition of 1D spectra on different slices, the relative volume of these slices should be taken into consideration. Their volume is constant when the longitudinal z axis is used for encoding, in the cylindrical portion of the NMR tube at the coil detection level. On the contrary, the volume of a slice depends on their localization when sequences are recorded along the x (or y) transverse axis. Integrals of signals on each individual 1D spectrum of a SPEN-DOSY spectrum, as illustrated for the ortho protons of pyridine in Figure 3a (red circles), are therefore normalized by the volume of the corresponding slices giving the blue crosses, prior to fit according to the modified Stejskal–Tanner equation (see Experimental Section). For this purpose, a profile along the x axis has been recorded using a gradient echo sequence, shown as a dashed line on Figure 3a.
The impact of sample shaking on diffusion coefficients fitted from data obtained with x-SPEN-DOSY is shown on Figures 3b vs. 3c (obtained with and without sample shaking). A systematic error is observed, compared to data extracted from SPEN-DOSY
spectra recorded on z axis, because of gradient non-uniformity and calibration. Within a molecule, these coefficients do not significantly differ and are obtained with comparable deviations. The procedure of recording a SPEN-DOSY spectrum after shaking has been found to be repeatable at 5% or better (Figure S5).
Having optimized both the pulse sequence and the processing steps with the concentrated solution, i.e. 150 mM, SABRE experiments have been performed on a more diluted solution, where each of the four substrates depicted in Scheme 1 is at a concentration of 5 mM, and the catalyst at a concentration of 1 mM. After addition of p-H2, the catalyst structure is modified
such that 3 molecules are linked to the metal, each being one of the four substrates. 40 different complexes may be formed,[16]
each one of probable micro-molar concentrations, and exhibiting slightly different proton chemical shifts. These signals are not observed on the spectrum and only signals of the free substrates in solution are observable and can be processed. Figure 3d shows the aromatic protons region of a SABRE-SPEN-UFDOSY rebuilt spectrum (processed in absorption mode), with the diffusion dimension along the x axis.
The diffusion coefficients of the different signals for the spectrum shown in Figure 3d are fully compatible with those obtained on a thermal equilibrium sample (Figure 3b, 3c and Table S2). This can, for example, be confirmed by calculating zeta-score[36] between pairs of signals: as shown in Table S2, the
absolute value of the zeta-score is always lower than 2, except for the case where a signal corresponds to two unresolved signals belonging to different molecules. The signal at ca. 7.85 ppm is assigned to para protons of pyridine and meta protons of 4,4'-bipyridyl. The diffusion coefficient corresponding to this signal and fitted from the thermally polarized SPEN-DOSY spectrum is not compatible with that fitted from the SABRE-SPEN-DOSY spectrum, as demonstrated by a zeta score much larger, in absolute value, than 2. On the contrary, this diffusion coefficient is fully compatible with the other signals of pyridine, and not compatible with the other signal of 4,4'-bipyridyl, see Table S2. This is explained by the fact that the enhancement coefficient is much higher, by a factor of about 10, for pyridine than for 4,4'-bipyridyl. Thus, despite their lower concentration, para protons of pyridine are responsible of most of the intensity of the signal and govern in a large extent the apparent diffusion coefficient in the SABRE-SPEN-DOSY spectrum. If a signal in a SPEN-DOSY spectrum is visible even without SABRE hyperpolarization, the fact that this diffusion coefficient varies in the presence of the metal catalyst may be used as a clue that the corresponding signal indeed results from the superimposition of signals originating from different molecules and having a different signal enhancement factor.
Finally, the zeta-score can be used to determine the compatibility of diffusion coefficients within a molecule, and the capability to differentiate molecules. Table S3 shows z-scores between all pairs of fitted diffusion coefficients of the SABRE-SPEN-DOSY spectrum depicted in Figure 3d. Within a molecule, the zeta-score, in absolute value, is always smaller than 2 (even less than 1.2), showing the intra-molecular compatibility of diffusion coefficients. Moreover, it is statistically possible to
distinguish the individual molecules, except between the b and d molecules (zeta-score of 1.6). This can be explained by the close values of their diffusion coefficients, differing by only 5%, a value close to the separation limit of the SPEN-DOSY method. This separation is not statistically sufficient but remains higher than the intra-molecular zeta-scores. Therefore, the diffusion dimension of SABRE-SPEN-UFDOSY spectra helps at assigning signals to each molecule in a mixture, as does conventional SPEN-DOSY, but on a solution 20 times less concentrated.
Conclusion
In this Article, we demonstrate the feasibility of the analysis of a mixture of dissolved molecules by one-scan spatially-encoded diffusion ordered NMR experiment, consecutive to hyperpolarization through the SABRE method. Specific challenges have been overcome: the use of a transverse axis to encode diffusion avoids the effect of convection that occurs mainly along the z-axis. The use of pure absorption processing of the data improves signal separation along the diffusion dimension. This has been validated on a SABRE-hyperpolarized mixture and systematic errors on the fitted diffusion coefficients have been investigated. A factor 20 in the solute concentrations has been gained while preserving the capacity to discriminate these solutes by their diffusion coefficients.
Low-field SABRE has undeniable qualities. It needs a simple and cheap set up, is applicable to non-isotopically enriched molecules, and may be repeated within minutes. In the near future, the SABRE-SPEN-DOSY method will certainly take advantage from recent developments, including SABRE-Relay[26] that may be
applicable to a much larger range of molecules than conventional SABRE, as only the occurrence of an exchangeable proton is required.
Experimental Section
Materials and solutions
The catalyst precursor [Ir(COD)(IMes)Cl] (1) (IMes = 1,3-bis(2,4,6-trimethylphenyl)imidazole-2-ylidene, COD = cyclooctadiene) was purchased from the Centre for Hyperpolarization in MRI of the University of York (UK). Pyridine (py), 4,4’-bipyridyl (bpy), N,N-dimethylnicotinamide (dmni) and 2-ethylpyridine (2-epy) were purchased from Sigma–Aldrich. Methanol-d4 was purchased from Cambridge Isotope Laboratories. All chemicals were used as supplied.
Two solutions were prepared in methanol-d4. Thermal-equilibrium analyses were performed on a solution of the four selected substrates, namely pyridine, 4,4’-bipyridyl, N,N-dimethylnicotinamide and 2-ethylpyridine, each at ca. 150 mM, both solutions in 3.95 mm NMR tube equipped with Teflon valves from Young Scientific Glassware Ltd. For SABRE experiments, an NMR tube of 5 mm o.d. and 3.95 mm i.d., equipped with Teflon valves from Young Scientific Glassware Ltd was used. A 450 l methanol-d4 solution was prepared, for a final concentration of 5 mM of each of the 4 substrates. A solution of the catalyst precursor was prepared under air, quickly transferred to the NMR tube for a final
concentration of 1.0 mM, and quickly degassed by three sequences of gas phase expansion-tube shaking, taking overall less than 2 minutes.
Experimental proceedings
The NMR experiments were performed on a Bruker Avance II spectrometer operating at a frequency of 500.13 MHz and equipped with an inverse triple resonance broad band probe head with xyz gradients. Experiments were performed at 298K.
The conventional DOSY spectrum of figure 2a was recorded using a double stimulated echo sequence with bipolar gradient pulses with additional longitudinal eddy current delay and spoil gradients,[37] with 8 diffusion encoding values linearly spaced along a ramp ranging from 0.019 T/m to 0.135 T/m, along x axis. The diffusion time was set to 100 ms. The duration of the bipolar gradient pulses for diffusion encoding was 1.4 ms. The conventional data were acquired with 16384 points, 4 dummy scans, 32 scans, a spectral width of 7500 Hz and a relaxation delay of 5 s, resulting in a total experiment duration of 27 min.
The SPEN DOSY spectra with x encoding were acquired using the SPEN STE pulse sequence, using a chirp pulse with a bandwidth of 70 kHz and a duration of 1 ms, sweeping over a region of 3.95 mm thanks to a gradient of 0.3627 mT/m. The post-chirp gradient had a duration of 0.9 ms and the encoding gradient strength was 0.3627 T/m. The acquisition gradient was set to 0.2325 T/m. The diffusion delay was 100 ms. Additional delay for symmetry purpose was 1.93 ms for and 5.59 ms for ’. A selective 180° pulse was used with a duration of 5.915 ms centered at 7.94 ppm. The acquisition time was 66 ms for 65536 points, 128 loops, Ta=0.256 ms leading to a spectral width of 1953 Hz.
The SPEN DOSY spectra with z encoding over a region of 3.95 mm were acquired using the SPEN STE pulse sequence with the same parameters as before, excepted for the acquisition gradient that was set to 0.3375 T/m. The reference profile was acquired with a double-spin echo imaging pulse sequence using a chirp pulse with a 70 kHz bandwidth and 1 ms duration, an encoding gradient of 0.4050 T/m along z and 0.3627 T/m along x, an acquisition gradient of 0.3375 T/m along z and 0.2325 T/m along x, a number of 1024 points for an acquisition duration of 1.024 ms.
For SABRE-polarized experiments, 51%-enriched p-H2 was produced in less than 5 minutes according to the procedure and home-built setup previously described.[18] It was then transferred without shaking into the NMR tube. The H2 final pressure was about 4 bar. As dissolution of hydrogen in methanol is slow on the minute time-scale, as checked in a separate experiment, the exact magnetic field where this transfer proceeds was considered unimportant. Then, the NMR tube was manually shaken during 15 s for catalyst activation, giving [Ir(H)2(IMes)(S1)(S2)(S3)] molecules, where S1, S2 and S3 were among the four substrates present in solution. As the total substrate concentration was well above three times that of the catalyst, binding of methanol solvent was neglig ble.[38] Shaking was performed at about 6.5 mT, a field close to the optimum for signal enhancement of pyridine when [Ir(COD)(IMes)(Py)] is the catalyst precursor.[39] The NMR tube was then introduced in the spectrometer. The total delay between the shaking and the start of the NMR acquisition was about 5 s during which the deuterium lock was established and the solution tended to stabilize. NMR acquisitions either used SPEN-DOSY sequences such as that shown in Figure 1b, or slightly modified by putting diffusion encoding and decoding gradients along the z-axis, or a series of 90° spectra acquired each 3 s. This shaking-acquisition sequence was repeated up to 6 times. For further experiments, the gas phase of the NMR tube was expanded in a degassed volume in order to decrease the
pressure by a factor of ca. 15, prior to the transfer of fresh p-H2. This procedure took less than 5 minutes.
Processing
Conventional DOSY spectra were processed with the DOSY Toolbox, in pure-absorption mode.[40] For all SPEN DOSY experiments, data were processed in Matlab (The Mathworks, Natick, U.S.A.) using home-written routines, part of which adapted from the DOSY Toolbox.[40] The procedure had been improved since the previous report,[21] and contained the following steps: data were read from Bruker files, then sorted and reshaped in order to get a 2D matrix. Cosine apodization and zero-filling were used in the spectroscopic dimension. Only the odd echoes were retained, and Fourier transformation was performed along the k and t2 dimensions. After phase correction of the spectra, the peak maxima were selected graphically and the spatial profile for each peak was obtained. Correction by a reference profile was performed. The diffusion was measured in a region of 2.8 mm depth. Calibration constant of Gmax=0.675 T/m and Gmax=0.465 T/m were used for z and x axis, respectively. The data were fitted against the following modified Stejskal–Tanner equation, with S0 and D as adjustable parameters:
S(x) = S0exp(−𝐷 ∆′ (𝐴𝑥 + 𝐵)2) (1) where A and B were calculated according to:
𝐴 = −2𝛾𝐺𝑒𝑇𝑒⁄𝐿 𝐵 = 𝛾𝐺𝑒𝑇𝑝
with Ge is the encoding gradient strength, Te is the duration of chirp pulse, L is the length of the region swept by the pulse, and Tp is the duration of the post-chirp gradient.[12]
Acknowledgements
Dr. Florent Malloggi is acknowledged for the acquisition of the video shown in Figure S4. This research was supported by the Région Ile-de-France and the Agence Nationale de la
Recherche (ANR-16- CE29-0012).
Keywords: analytical methods • NMR • diffusion • para-hydrogen • spatially encoded experiments
[1] P. Giraudeau, L. Frydman, Annu. Rev. Anal. Chem. 2014, 7, 129–161. [2] J. Pinto, M. R. M. Domingues, E. Galhano, C. Pita, M. do Céu Almeida,
I. M. Carreira, A. M. Gil, Analyst 2014, 139, 1168–1177.
[3] K. Trainor, A. Broom, E. M. Meiering, Curr. Opin. Struct. Biol. 2017, 42, 136–146.
[4] J.-N. Dumez, Prog. Nucl. Magn. Reson. Spectrosc. 2018, 109, 101-134. [5] M. Mobli, J. C. Hoch, Prog. Nucl. Magn. Reson. Spectrosc. 2014, 83,
21–41.
[6] L. Frydman, T. Scherf, A. Lupulescu, PNAS 2002, 99, 15858–15862. [7] K. F. Morris, C. S. Johnson Jr., J Am Chem Soc 1992, 114, 3139–3141. [8] H. Barjat, G. A. Morris, S. Smart, A. G. Swanson, S. C. R. Williams, J.
Magn. Reson. B 1995, 108, 170–172.
[9] G. Pages, P. W. Kuchel, Diffus. Fundam. 2007, 6, 3–1.
[10] M. J. Thrippleton, N. M. Loening, J. Keeler, Magn. Reson. Chem. 2003, 41, 441–447.
[11] Y. Shrot, L. Frydman, J. Magn. Reson. 2008, 195, 226–231. [12] L. Guduff, I. Kuprov, C. van Heijenoort, J.-N. Dumez, Chem Commun
2017, 53, 701–704.
[14] B. Plainchont, P. Berruyer, J.-N. Dumez, S. Jannin, P. Giraudeau, Anal. Chem. 2018, 90, 3639–3650.
[15] I. Reile, R. L. E. G. Aspers, J.-M. Tyburn, J. G. Kempf, M. C. Feiters, F. P. J. T. Rutjes, M. Tessari, Angew. Chem. Int. Ed. 2017, 56, 9174–9177. [16] N. Eshuis, B. J. A. van Weerdenburg, M. C. Feiters, F. P. J. T. Rutjes, S. S. Wijmenga, M. Tessari, Angew. Chem. Int. Ed. 2015, 54, 1481–1484. [17] N. Eshuis, R. L. E. G. Aspers, B. J. A. van Weerdenburg, M. C. Feiters, F. P. J. T. Rutjes, S. S. Wijmenga, M. Tessari, Angew. Chem. Int. Ed. 2015, 54, 14527–14530.
[18] V. Daniele, F.-X. Legrand, P. Berthault, J.-N. Dumez, G. Huber, ChemPhysChem 2015, 16, 3413–3417.
[19] J.-N. Dumez, J. Milani, B. Vuichoud, A. Bornet, J. Lalande-Martin, I. Tea, M. Yon, M. Maucourt, C. Deborde, A. Moing, L. Frydman, G. Bodenhausen, S. Jannin, P. Giraudeau, Analyst 2015, 140, 5860–5863. [20] B. Gouilleux, L. Rouger, P. Giraudeau, in Annu. Rep. NMR Spectrosc.,
Elsevier, 2018, 93, 75–144.
[21] L. Guduff, D. Kurzbach, C. van Heijenoort, D. Abergel, J.-N. Dumez, Chem. - Eur. J. 2017, 23, 16722–16727.
[22] P. J. Rayner, M. J. Burns, A. M. Olaru, P. Norcott, M. Fekete, G. G. R. Green, L. A. R. Highton, R. E. Mewis, S. B. Duckett, Proc. Natl. Acad. Sci. 2017, 114, E3188-E3194.
[23] R. W. Adams, J. A. Aguilar, K. D. Atkinson, M. J. Cowley, P. I. P. Elliott, S. B. Duckett, G. G. R. Green, I. G. Khazal, J. López-Serrano, D. C. Williamson, Science 2009, 323, 1708–1711.
[24] K. M. Appleby, R. E. Mewis, A. M. Olaru, G. G. R. Green, I. J. S. Fairlamb, S. B. Duckett, Chem Sci 2015, 6, 3981–3993.
[25] J. F. P. Colell, A. W. J. Logan, Z. Zhou, R. V. Shchepin, D. A. Barskiy, G. X. Or iz, Jr., Q. Wang, S. J. Malcolmson, E. Y. Chekmenev, W. S. Warren, T. Theis, J. Phys. Chem. C 2017, 121, 6626–6634. [26] W. Iali, P. J. Rayner, S. B. Duckett, Sci. Adv. 2018, 4, eaao6250. [27] S. Wagner, Magn. Reson. Mater. Phy. 2014, 27, 195–199.
[28] I. Reile, R. L. E. G. Aspers, M. C. Feiters, F. P. J. T. Rutjes, M. Tessari, Magn. Reson. Chem. 2017, 55, 759–762.
[29] M. Takahashi, K. Chiba, P. Li, J. Phys. Chem. B 2007, 111, 1343–1347. [30] V. Tesař, in Proc Colloq. Fluid Dyn., 2012.
[31] G. Hamdoun, L. Guduff, C. van Heijenoort, C. Bour, V. Gandon, J.-N. Dumez, Analyst 2018, 143, 3458–3464.
[32] S. Lehmkuhl, M. Wiese, L. Schubert, M. Held, M. Küppers, M. Wessling, B. Blümich, J. Magn. Reson. 2018, 291, 8–13.
[33] A. S. Kiryutin, G. Sauer, S. Hadjiali, A. V. Yurkovskaya, H. Breitzke, G. Buntkowsky, J. Magn. Reson. 2017, 285, 26–36.
[34] S. Knecht, A. S. Kiryutin, A. V. Yurkovskaya, K. L. Ivanov, J. Magn. Reson. 2018, 287, 74–81.
[35] A. N. Pravdivtsev, A. V. Yurkovskaya, H.-M. Vieth, K. L. Ivanov, J. Phys. Chem. B 2015, 119, 13619–13629.
[36] Analytical Methods Committee, Anal. Methods 2016, 8, 5553–5555. [37] A. Jerschow, N. Müller, J. Magn. Reson. 1997, 125, 372–375. [38] N. Eshuis, N. Hermkens, B. J. A. van Weerdenburg, M. C. Feiters, F. P.
J. T. Rutjes, S. S. Wijmenga, M. Tessari, J. Am. Chem. Soc. 2014, 136, 2695–2698.
[39] M. J. Cowley, R. W. Adams, K. D. Atkinson, M. C. R. Cockett, S. B. Duckett, G. G. R. Green, J. A. B. Lohman, R. Kerssebaum, D. Kilgour, R. E. Mewis, J. Am. Chem. Soc. 2011, 133, 6134–6137.