HAL Id: hal-00295766
https://hal.archives-ouvertes.fr/hal-00295766
Submitted on 25 Oct 2005
HAL is a multi-disciplinary open access
archive for the deposit and dissemination of
sci-entific research documents, whether they are
pub-lished or not. The documents may come from
teaching and research institutions in France or
abroad, or from public or private research centers.
L’archive ouverte pluridisciplinaire HAL, est
destinée au dépôt et à la diffusion de documents
scientifiques de niveau recherche, publiés ou non,
émanant des établissements d’enseignement et de
recherche français ou étrangers, des laboratoires
publics ou privés.
H2O, CH4, NOx, HCl and HF derived from HALOE
measurements
J.-U. Grooß, James M. Russell Iii
To cite this version:
J.-U. Grooß, James M. Russell Iii. Technical note: A stratospheric climatology for O3, H2O, CH4,
NOx, HCl and HF derived from HALOE measurements. Atmospheric Chemistry and Physics,
Euro-pean Geosciences Union, 2005, 5 (10), pp.2797-2807. �hal-00295766�
www.atmos-chem-phys.org/acp/5/2797/ SRef-ID: 1680-7324/acp/2005-5-2797 European Geosciences Union
Chemistry
and Physics
Technical note: A stratospheric climatology for O
3
, H
2
O, CH
4
, NO
x
,
HCl and HF derived from HALOE measurements
J.-U. Grooß1and James M. Russell III2
1Institut f¨ur Chemie und Dynamik der Geosph¨are I: Stratosph¨are (ICG I), Forschungszentrum J¨ulich, J¨ulich, Germany
2Center for Atmospheric Sciences, Hampton University, Hampton, VA, USA
Received: 11 April 2005 – Published in Atmos. Chem. Phys. Discuss.: 12 May 2005 Revised: 12 October 2005 – Accepted: 12 October 2005 – Published: 25 October 2005
Abstract. The Halogen Occultation Experiment (HALOE)
on board the Upper Atmosphere Research Satellite (UARS) has observed mixing ratios of important trace species in the stratosphere for more than a decade since 1991. Here we present a climatology for the stratosphere compiled from
HALOE O3, H2O, CH4, NOx, HCl, and HF data for the
pe-riod from 1991 to 2002. In this approach, the data are av-eraged over equivalent latitude instead of latitude in order to correctly reproduce the gradients at the transport barriers like the polar vortex edge. The climatology is compiled for 5 de-gree equivalent latitude bins. Seasonal dependence is taken into account by choosing intervals of one month. The clima-tology is available as an electronic supplement.
1 Introduction
Global atmospheric models such as Global Circulation Mod-els (GCMs) and Chemistry Transport ModMod-els (CTMs) need information about the spatial distribution of the chemical composition for some key tracer species, e.g. ozone or water vapor, in order to achieve realistic results especially for the simulation of radiation. Both the calculation of photodissoci-ation rates of chemical species and the calculphotodissoci-ation of diabatic heating rates are needed to achieve realistic changes in chem-ical composition and to achieve realistic vertchem-ical transport, respectively. There are two different approaches to using the distribution of chemical species for these calculations. Either the information about the key chemical species is prescribed and stems from a climatology compiled from different data sets or it is derived from other models. These simulations are often called off line simulations. The second approach is to use the model’s own simulated values of the key species in the radiation code taking into account the feedback
be-Correspondence to: J.-U.Grooß
(j.-u.grooss@fz-juelich.de)
tween chemistry and radiation. These simulations are of-ten called coupled simulations. This approach would benefit from a realistic compilation of a climatology from obsertions to assure the quality of the derived ozone and water va-por fields on which the radiation simulations are based. Both approaches, off-line and coupled, can use climatologies of
chemical tracers such as CH4 or HF to validate the
large-scale transport and other key chemical species to validate the chemistry of the simulation.
Here we present a climatology based on the satellite ob-servations made by the Halogen Occultation Experiment (HALOE) on board the Upper Atmosphere Research Satel-lite, which has taken measurements of stratospheric trace species since it was first turned on in orbit on 11 October
1991 (Russell et al., 1993). The measured trace gases are O3,
CH4, H2O, HCl, HF, NO, and NO2. Here we concentrate on
O3, CH4, and H2O observations, but we also provide
infor-mation for the other chemical species. The HALOE instru-ment uses the solar occultation technique and daily observes up to 15 sunrise and 15 sunset profiles of these measured trace species at about constant latitudes for both groups.
The period covered of about 11 years (1991–2002) corre-sponds to one period of the solar cycle. We do not include the most recent data since September 2002, since in 2002 there was a very unusual major warming in the Antarctic (New-man and Nash, 2005) and also the observations have been less frequent after 2002.
Other available climatologies are also used in GCMs and CTMs. For example, Fortuin and Kelder (1998) compiled an ozone climatology for the period 1980–1991 from ozone sonde and satellite data. The main difference is that during that period the Antarctic ozone hole was not yet fully
de-veloped. Randel et al. (1998) also combined H2O and CH4
measurements from HALOE with other UARS experiments (MLS, CLAES) to build a climatology with an equivalent lat-itude mapping from the observation of the period November 1991 to March 1997. Chiou et al. (1997) compiled a water
vapor climatology from 5.5 years version 6.1 SAGE II data. However, comparison with correlative data and an update of the retrieval (Thomason et al., 2004) indicated a significant low bias for this climatology. Previous, more abbreviated cli-matologies of stratospheric water vapor from HALOE have been published by Remsberg et al. (1990) and Russell and Swider (1991).
The UARS reference atmosphere project (http://code916. gsfc.nasa.gov/Public/Analysis/UARS/urap/home.html) also provides climatologies for key chemical species derived from UARS observations for a combination of different instru-ments on board UARS and also for HALOE measureinstru-ments only. Depending on species, they use up to the first 7 years of UARS observations. The URAP data are generated by the method after Randel et al. (1998) in which the seasonal cy-cles are fit using a harmonic regression analysis. Besides a
longer time range, we also include NOxin the climatology
as an additional chemical species.
To our knowledge no climatology of NOx(=NO+NO2) has
yet been published. Beaver and Russell (1998) provide a cli-matology of HCl and HF from HALOE for the first 4.5 years of HALOE observations for 5 latitude bins and four seasons, which is a lower resolution and time range of the HALOE data set compared to the presented climatology.
The climatology presented here is already used in simula-tions. In the 3-D version of the Chemical Lagrangian Model of the Stratosphere (CLaMS) it has been used to calculate the diabatic heating rates that introduce vertical motion across the isentropic levels (Konopka et al., 2004, 2005). It was also used as input for the radiative transfer calculation from which the chemical photolysis frequencies are determined (Grooß et al., 2002; Grooß et al., 2004). A previous version of this climatology, compiled from 6 years of HALOE data, two-month averages and latitude bins instead of equivalent lati-tude, is used in the ECHAM-5 model (C. Br¨uhl, pers. comm., 2004).
2 HALOE data uncertainties
The HALOE instrument was validated against a variety of correlative measurements. Also various remote sensors have been compared to HALOE more recently. We use HALOE data from version 19, which is the third public release. We briefly summarize these results for the stratosphere. Gen-erally, the accuracy of the HALOE data decreases near the tropopause.
O3: The combined systematic and random uncertainty of
single ozone profiles in the lower stratosphere (up to 10 hPa) is between 9 and 25% and between 9 and 20% in the upper stratosphere. The agreement with correla-tive measurements is typically better than 10% down to 200 hPa in the extra-tropics and down to 100 hPa in the tropics and subtropics (Br¨uhl et al., 1996; Bhatt et al.,
1999). HALOE O3 agrees with SAGE (v6.1) within
about 5% (Randall et al., 2003). The differences be-tween HALOE and POAM III are within 10% and often within 5% (Randall et al., 2003).
H2O: The combined systematic and random uncertainty of
single water vapor profiles in the lower stratosphere is between 14 and 24% and up to 30% in the upper strato-sphere. The agreement with correlative measurements is typically better than 10% (Park et al., 1996; Kley et al., 2000). The differences between HALOE and AT-MOS are generally better than 10% and of the order of 5% (Michelsen et al., 2002). The agreement with SAGE II water vapor measurements (version 6.2) is better than 5% (Taha et al., 2004).
CH4: The combined systematic and random uncertainty of
single CH4profiles in the lower stratosphere is between
11 and 19% and between 6 and 27% un the upper strato-sphere. The agreement with correlative measurements is typically better than 15% (Park et al., 1996).
NOx: The combined systematic and random uncertainty of
single NO profiles in the lower stratosphere is between 14 and 21% and up to 30% in the upper stratosphere.
For NO2 profiles it is between 9 and 21% throughout
the stratosphere. The mean differences from
correla-tive observations for NO2 data are about 10–15% and
for NO data about 15% (Gordley et al., 1996). The
HALOE NO2 data between 20 and 33 km agree with
POAM III within about 0.2 ppbv (Randall et al., 2002).
Above about 1 hPa level, mostly no NO2is detected. As
we are interested in the sum NO+NO2, which is
domi-nated by NO at these levels, we set NO2to zero above
the 1 hPa level in the case that no NO2is detected.
HCl: The combined systematic and random uncertainty of single HCl profiles in the lower stratosphere is between 14 and 24% and between 12 and 15% in the upper stratosphere. The mean difference between HALOE and correlative measurements ranges from 8 to 19% (Russell et al., 1996b).
HF: The combined systematic and random uncertainty of single HF profiles in the lower stratosphere is between 15 and 27% and about 15% in the upper stratosphere. The mean difference between HALOE and correla-tive balloon measurements is below 7% between 5 and 50 hPa. Above 10 hPa, HALOE HF is systematically lower than remote observations by ATMOS by 10–20% (Russell et al., 1996a).
The vertical resolution of the data is between 2 km for O3,
HALOE coverage
Jan Apr Jul Oct Jan
−50 0 50 Latitude [ o N] 1991 1992 1993 1994 1995 1996 1997 1998 1999 2000 2001 2002
Fig. 1. Coverage of the HALOE instrument. Shown is the latitude of the HALOE observation as function of time of year for all years
indicated by different colors. Sunrise observations are depicted by thick lines and sunset observation by thin lines.
HALOE coverage
Jan Apr Jul Oct Jan
−50 0 50 Equivalent Latitude [ o N] 1991 1992 1993 1994 1995 1996 1997 1998 1999 2000 2001 2002
Fig. 2. As Fig. 1, but for equivalent latitude derived from UKMO PV on the 475 K potential temperature level. Sunrise observations are
depicted by diamond symbols and sunset observation by crosses.
3 Method
In the polar winters of both hemispheres, large differences of mixing ratios of chemical tracers inside and outside the po-lar vortices are a typical feature as well as po-large gradients at the vortex edge. HALOE does not sample the polar vortex on a regular basis. However, often the polar vortices are dis-placed from a circumpolar symmetry and large fractions of the polar vortex reach latitudes at which HALOE does ob-serve. These air masses contain information from the polar vortex and typically have high potential vorticity (PV) val-ues. Therefore the PV information was used in compiling the climatology presented here. The observations were sorted
and combined with respect to equivalent latitude (Lary et al., 1995). The equivalent latitude was derived from PV using the analyses provided by the United Kingdom Meteorologi-cal Office (UKMO).
Figure 1 shows the latitude versus the time of year of the observations covered by the HALOE instrument between 1991 and 2002. Due to the solar occultation geometry, no ob-servations are made during the polar night. Figure 2 shows the HALOE coverage with respect to equivalent latitude. Clearly, the range of equivalent latitudes covered by HALOE is larger than the range of latitudes, especially during the po-lar winter in both hemispheres.
During the polar summer, there is also a larger coverage of equivalent latitude compared to latitude. However, due to the weak PV gradient in the polar summer, there may be no tight correlation between chemical mixing ratios and PV. Therefore the concept of equivalent latitude is limited for the polar summer. For completeness, we also include a similar climatology in the supplement that is binned with respect to geographical latitude instead of equivalent latitude. This cli-matology is not explicitly discussed here.
The exact determination of the potential vorticity of a HALOE observation (required to determine equivalent lati-tude) was performed in the following way. First the obser-vation location was transformed to a time for which UKMO analyses were available, i.e. to 12 h UT of the day of obser-vation. This was done by (backward or forward) trajectory calculations from the time of observation until 12 h UT of the day of observation for potential temperatures between 400 K and 2000 K using the CLaMS trajectory module (McKenna et al., 2002) and wind data from UKMO analyses. The equiv-alent latitude was then calculated from the PV at the respec-tive potential temperature level for the synoptic location de-termined in this way.
Between October 1991 and August 2002, a total of 78 600
HALOE profiles of O3, CH4, H2O, HCl, and HF mixing
ra-tio were then combined into bins of 5 degree equivalent lat-itude for 22 pressure levels between 316 and 0.1 hPa and 12 months. Each data point was assigned a weight equal to the inverse of its given accuracy. In doing so, data with low accu-racy (e.g. at the bottom of some measured profiles or due to high aerosol content) only have a low contribution to the de-termined climatological average value. Since the area of the
first and last equivalent latitude bin (±87.5◦) is rather small
and thus does not contain many data points, these bins were
combined with the next bins at ±82.5◦.
The HALOE data points that have a retrieved estimated precision of more than 2 times their mixing ratio are rejected from this compilation. Also data points that show unex-pectedly large mixing ratios, for example more than 15 ppm
ozone and more than 2.0 ppm CH4, were rejected. Further,
it was required that at least 5 HALOE observations were needed in a bin.
In the tropical tropopause region below 100 hPa, often high clouds interfere with the observations, resulting in
un-reliable results. For example, NO2data and HF data in the
tropics show a significant increase below the 100 hPa level
which is not expected. Therefore NO2data and HF data
be-low 100 hPa that increase by more than twice their mixing ratio at 100 hPa are not used for this climatology.
For NOx, a slightly different procedure was chosen. At the
observation time (sunrise or sunset) there is a fast conversion
from NO2to NO and from NO to NO2, respectively. The sum
NOxNO+NO¯ 2 is approximately constant. However, during
the night time, also N2O5is produced from NOxwhich is not
photolyzed by the time of the sunrise observation. Therefore,
the sunrise NOxobservations should be corrected by the
frac-tion that is still in the form of N2O5. To avoid this correction,
we use only sunset profiles for compiling the climatology of
NOx.
Since HALOE does not observe air masses during the po-lar night, there are gaps in the data sets, even when equiva-lent latitude mapping is used. To achieve a complete global dataset with the best estimate of the annual dependence, these gaps were filled. Typically, the air within the polar vor-tex is isolated from mid-latitudes and descends diabatically
during the polar night. This causes, for example, the CH4
mixing ratios at a given height to decrease with time. Thus, the latitudinal gradient increases through the polar nights. Therefore an extrapolation in latitude may not lead to real-istic mixing ratios. In this study, we interpolated in time be-tween the observations at the formation and at the end of the polar vortex at high equivalent latitudes, which should yield more realistic mixing ratios. In the following figures, the re-gions of these filled data gaps are hatched in white.
The advantage of this approach is that the climatology is compiled from a single data source, therefore no biases be-tween different sources have to be taken into account. This method is also possible because of the long-term stability of the HALOE observations. The experiment has been very sta-ble over the 13 plus years of operation thus far. The absolute change in signal level when viewing the sun outside the
at-mosphere has been no more than 0.5% in the H2O channel
and less than 2–3% in the CH4and O3 channels. Even so,
since the measurement is made by ratioing the signals ob-tained while viewing through the atmosphere to the signals measured outside the atmosphere, any change in the absolute signal level is removed. Also, other parameters such as spec-tral filter stability and field of view (FOV) mismatch effects have been carefully examined and no significant drifts in the instrument have been found.
The limit of this approach is that data must be interpolated through periods with no observations, e.g. the polar night. Also species with a significant diurnal variation (e.g. ozone in the mesosphere) cannot be covered as the data always cor-respond to local sunrise or sunset. HALOE does not measure trace species in the troposphere regularly. Therefore this ap-proach of compiling a climatology is best suited for the alti-tude range of the stratosphere.
4 Results
Figures 3 to 7 show examples of the compiled climatology
for O3, H2O, CH4, NOx, HCl, and HF, respectively. Shown
are the months of January, April, July, and October between 330 and 0.33 hPa. The other months are not shown here.
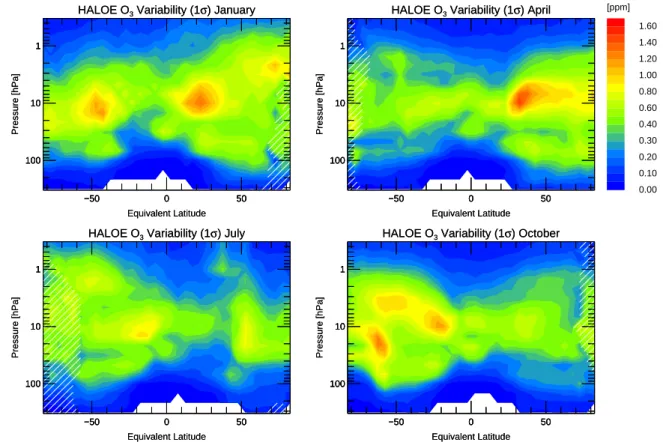
The ozone data displayed in Fig. 3 show a maximum of ozone mixing ratios of about 10 ppm in the tropics at 10 hPa. Also visible is the ozone depletion in the Antarctic vortex in October below 30 hPa, the so-called ozone hole, which was already well established during the period 1991–2002.
−50 0 50 Equivalent Latitude 100 10 1 Pressure [hPa]
HALOE O3 Climatology January HALOE O3 Climatology January
−50 0 50 Equivalent Latitude 100 10 1 Pressure [hPa] −50 0 50 100 10 1 −50 0 50 Equivalent Latitude 100 10 1 Pressure [hPa]
HALOE O3 Climatology April HALOE O3 Climatology April
−50 0 50 Equivalent Latitude 100 10 1 Pressure [hPa] 0.0 0.1 0.2 0.5 1.0 1.5 2.0 4.0 6.0 8.0 10.0 [ppm] −50 0 50 100 10 1 −50 0 50 Equivalent Latitude 100 10 1 Pressure [hPa]
HALOE O3 Climatology July HALOE O3 Climatology July
−50 0 50 Equivalent Latitude 100 10 1 Pressure [hPa] −50 0 50 100 10 1 −50 0 50 Equivalent Latitude 100 10 1 Pressure [hPa]
HALOE O3 Climatology October HALOE O3 Climatology October
−50 0 50 Equivalent Latitude 100 10 1 Pressure [hPa] −50 0 50 100 10 1
Fig. 3. Climatology for ozone for the months January, April, July, and October. Areas hatched in white indicate data interpolated in time.
−50 0 50 Equivalent Latitude 100 10 1 Pressure [hPa]
HALOE O3 Variability (1σ) January
HALOE O3 Variability (1σ) January
−50 0 50 Equivalent Latitude 100 10 1 Pressure [hPa] −50 0 50 100 10 1 −50 0 50 Equivalent Latitude 100 10 1 Pressure [hPa]
HALOE O3 Variability (1σ) April
HALOE O3 Variability (1σ) April
−50 0 50 Equivalent Latitude 100 10 1 Pressure [hPa] 0.00 0.10 0.20 0.30 0.40 0.60 0.80 1.00 1.20 1.40 1.60 [ppm] −50 0 50 100 10 1 −50 0 50 Equivalent Latitude 100 10 1 Pressure [hPa]
HALOE O3 Variability (1σ) July
HALOE O3 Variability (1σ) July
−50 0 50 Equivalent Latitude 100 10 1 Pressure [hPa] −50 0 50 100 10 1 −50 0 50 Equivalent Latitude 100 10 1 Pressure [hPa]
HALOE O3 Variability (1σ) October
HALOE O3 Variability (1σ) October
−50 0 50 Equivalent Latitude 100 10 1 Pressure [hPa] −50 0 50 100 10 1
Fig. 4. Standard deviation (1σ ) in ppm of the climatology for ozone (Fig. 3) for the months January, April, July, and October. Areas hatched
−50 0 50 Equivalent Latitude 100 10 1 Pressure [hPa]
HALOE H2O Climatology January
HALOE H2O Climatology January
−50 0 50 Equivalent Latitude 100 10 1 Pressure [hPa] −50 0 50 100 10 1 −50 0 50 Equivalent Latitude 100 10 1 Pressure [hPa]
HALOE H2O Climatology April
HALOE H2O Climatology April
−50 0 50 Equivalent Latitude 100 10 1 Pressure [hPa] 2.0 2.5 3.0 3.5 4.0 4.5 5.0 5.5 6.0 6.5 15.0 [ppm] −50 0 50 100 10 1 −50 0 50 Equivalent Latitude 100 10 1 Pressure [hPa]
HALOE H2O Climatology July
HALOE H2O Climatology July
−50 0 50 Equivalent Latitude 100 10 1 Pressure [hPa] −50 0 50 100 10 1 −50 0 50 Equivalent Latitude 100 10 1 Pressure [hPa]
HALOE H2O Climatology October
HALOE H2O Climatology October
−50 0 50 Equivalent Latitude 100 10 1 Pressure [hPa] −50 0 50 100 10 1
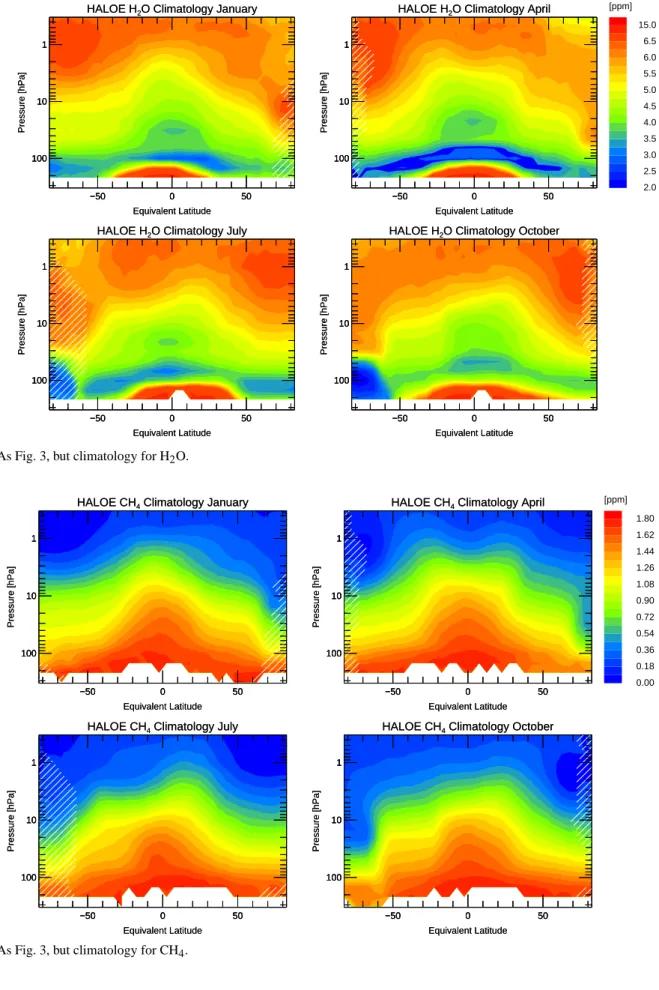
Fig. 5. As Fig. 3, but climatology for H2O.
−50 0 50 Equivalent Latitude 100 10 1 Pressure [hPa]
HALOE CH4 Climatology January
HALOE CH4 Climatology January
−50 0 50 Equivalent Latitude 100 10 1 Pressure [hPa] −50 0 50 100 10 1 −50 0 50 Equivalent Latitude 100 10 1 Pressure [hPa]
HALOE CH4 Climatology April
HALOE CH4 Climatology April
−50 0 50 Equivalent Latitude 100 10 1 Pressure [hPa] 0.00 0.18 0.36 0.54 0.72 0.90 1.08 1.26 1.44 1.62 1.80 [ppm] −50 0 50 100 10 1 −50 0 50 Equivalent Latitude 100 10 1 Pressure [hPa]
HALOE CH4 Climatology July
HALOE CH4 Climatology July
−50 0 50 Equivalent Latitude 100 10 1 Pressure [hPa] −50 0 50 100 10 1 −50 0 50 Equivalent Latitude 100 10 1 Pressure [hPa]
HALOE CH4 Climatology October
HALOE CH4 Climatology October
−50 0 50 Equivalent Latitude 100 10 1 Pressure [hPa] −50 0 50 100 10 1
−50 0 50 Equivalent Latitude 100 10 1 Pressure [hPa]
HALOE HF Climatology January HALOE HF Climatology January
−50 0 50 Equivalent Latitude 100 10 1 Pressure [hPa] −50 0 50 100 10 1 −50 0 50 Equivalent Latitude 100 10 1 Pressure [hPa]
HALOE HF Climatology April HALOE HF Climatology April
−50 0 50 Equivalent Latitude 100 10 1 Pressure [hPa] 0.0 0.2 0.4 0.6 0.8 1.0 1.2 1.4 1.6 1.8 2.0 [ppb] −50 0 50 100 10 1 −50 0 50 Equivalent Latitude 100 10 1 Pressure [hPa]
HALOE HF Climatology July HALOE HF Climatology July
−50 0 50 Equivalent Latitude 100 10 1 Pressure [hPa] −50 0 50 100 10 1 −50 0 50 Equivalent Latitude 100 10 1 Pressure [hPa]
HALOE HF Climatology October HALOE HF Climatology October
−50 0 50 Equivalent Latitude 100 10 1 Pressure [hPa] −50 0 50 100 10 1
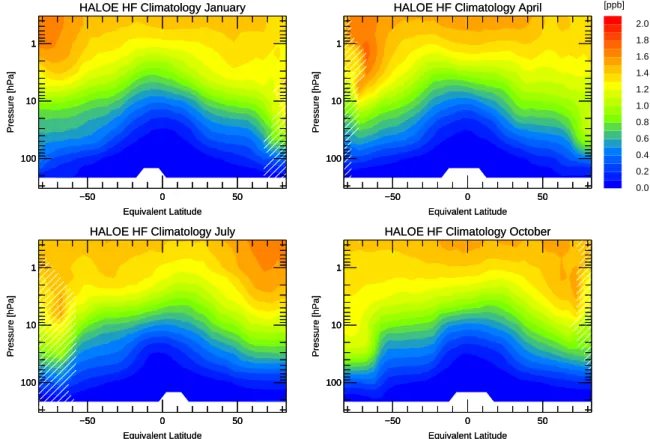
Fig. 7. As Fig. 3, but climatology for HF.
Figure 4 shows the standard deviation (1σ ) of the ozone mix-ing ratio of each bin. It is typically 5–15% in the mid to upper stratosphere and larger below about 50 hPa. Large variability of over 1 ppm is seen at the polar vortex edge in the
south-ern hemisphere in October at the equivalent latitude of 65◦S.
This is mainly caused by the variability of the size of the
polar vortex and is also seen in the variability of CH4(not
shown here).
Figure 5 clearly shows the increase of H2O mixing ratio
with increasing altitude throughout the stratosphere, which is
caused by the CH4oxidation. Also, the strong dehydration in
the Antarctic vortex in winter and spring is well pronounced
in October. The increase of H2O with decreasing altitude at
the tropical tropopause region may be underestimated, as for
large tropospheric H2O mixing ratios no precise HALOE
ob-servations are made since the lines employed for the HALOE
H2O retrieval are nearly optically saturated. Thus
observa-tions with low H2O mixing ratios contribute more data points
to the climatology.
The importance of CH4 for radiation is less than ozone
or H2O. The major CH4sources are emissions at the earth’s
surface and the major sink is its oxidation in the stratosphere. Due to its long lifetime, it is a good dynamical tracer and may be used to verify the simulations of meridional transport and
the diabatic descent in the polar vortices. In the CH4
clima-tology (Fig. 6), especially the diabatic descent over the
win-ter in the polar vortices is clearly visible for both hemispheres
yielding low CH4mixing ratios inside the vortex compared
to mid-latitudes. The corresponding tracer gradient at the vortex edge is also clearly visible. Similarly, HF can be used as a dynamical tracer. Its major source is the photodissocia-tion of CFCs in the stratosphere. The sink in the troposphere is rainout. Therefore the HF climatology (Fig. 7) does show
features similar to CH4with the opposite sign of its vertical
gradient.
The variability of the HCl climatology (Fig. 8) is caused by the increase over the investigated time period, e.g. from about 2.8 ppb to 3.35 ppb at 0.3 hPa between 1992 and 1997. Therefore, the climatology represents only the average HCl but not a value that is typical of the whole time considered. For completeness these data are left in this study.
As explained above, the NOx climatology (Fig. 9) was
compiled only from the sunset observations of HALOE to avoid the variability caused by nighttime conversion into
N2O5. These NOxmixing ratios should therefore correspond
to daytime values. For the interpretation of the NOx
clima-tology one has to consider further that especially in the upper
polar stratosphere, NOxis significantly influenced by
inter-mittent solar activity (Randall et al., 2005). Therefore the
NOxmixing ratios do show high variability in the upper
−50 0 50 Equivalent Latitude 100 10 1 Pressure [hPa]
HALOE HCl Climatology January HALOE HCl Climatology January
−50 0 50 Equivalent Latitude 100 10 1 Pressure [hPa] −50 0 50 100 10 1 −50 0 50 Equivalent Latitude 100 10 1 Pressure [hPa]
HALOE HCl Climatology April HALOE HCl Climatology April
−50 0 50 Equivalent Latitude 100 10 1 Pressure [hPa] 0.00 0.35 0.70 1.05 1.40 1.75 2.10 2.45 2.80 3.15 3.50 [ppb] −50 0 50 100 10 1 −50 0 50 Equivalent Latitude 100 10 1 Pressure [hPa]
HALOE HCl Climatology July HALOE HCl Climatology July
−50 0 50 Equivalent Latitude 100 10 1 Pressure [hPa] −50 0 50 100 10 1 −50 0 50 Equivalent Latitude 100 10 1 Pressure [hPa]
HALOE HCl Climatology October HALOE HCl Climatology October
−50 0 50 Equivalent Latitude 100 10 1 Pressure [hPa] −50 0 50 100 10 1
Fig. 8. As Fig. 3, but climatology for HCl.
The presented results for O3, CH4and H2O are
compa-rable to the 7-year HALOE URAP climatology mentioned above. However, the URAP climatology was compiled with lower latitude resolution using a harmonic regression anal-ysis to reconstruct the seasonal cycle as by Randel et al. (1998). Therefore the URAP climatology provides much smoother latitudinal gradients and lower values of 1-σ
vari-ability (O3about 20%, CH4about 30% and H2O about 40%
between 500 and 1000 K potential temperature).
If this climatology is used for model predictions, the long-term trends of the considered species may be important. As the variability in the climatology is caused by both long-term increase and year-to-year variability, we also include monthly averages of each month during the considered time period in the supplement.
For the period considered here, the ozone hole was al-ready well established. Towards the end of the period, the maximum expected mixing ratio of total inorganic chlorine
(Cly) in the stratosphere was reached, thus also the
maxi-mum of HCl in the upper stratosphere. The stratospheric Cly
mixing ratio, the precursor of ozone depletion, is expected to decrease slowly over the next few decades, therefore the ozone mixing ratio averaged over the chosen period may be representative of the next few decades in this respect. Wa-ter vapor in the stratosphere has been reported to increase. Rosenlof (2002) suggested 0.45%/year over the last 45 years.
A water vapor increase was also reported for the first 5 years of HALOE observations (Randel et al., 1999). However, it has been reported that this has not continued over the fol-lowing years (Randel et al., 2004). This behavior can partly
be explained by the increase of stratospheric CH4oxidation,
caused by various factors such as the increase of Cly until
about 1995 and the 11-year solar cycle (R¨ockmann et al., 2004). It is not clear whether this water vapor increase will continue in the future.
5 Data access
The compiled climatologies for O3, H2O, CH4, NOx, HCl,
and HF are available as a supplement (http://www.atmos-chem-phys.org/acp/5/2797/acp-5-2797-sp.tar). The
supple-ment contains a NetCDF1 file haloe climat eqlat.nc with
the described climatology with equivalent latitude binning. The supplement contains both the average data for each bin (equivalent latitude, pressure, month) and its standard devia-tion. Also, the number of observations corresponding to one bin is included. For data interpolated in time the number is set to –1. The file haloe lat climat.nc contains a similar climatology but with latitude binning instead of equivalent 1For details of this file format see http://www.unidata.ucar.edu/
−50 0 50 Equivalent Latitude 100 10 1 Pressure [hPa]
HALOE NOx Climatology January (sunset only)
HALOE NOx Climatology January (sunset only)
−50 0 50 Equivalent Latitude 100 10 1 Pressure [hPa] −50 0 50 100 10 1 −50 0 50 Equivalent Latitude 100 10 1 Pressure [hPa]
HALOE NOx Climatology April (sunset only)
HALOE NOx Climatology April (sunset only)
−50 0 50 Equivalent Latitude 100 10 1 Pressure [hPa] 0.0 0.2 0.4 1.0 2.0 3.0 4.0 8.0 12.0 16.0 20.0 [ppb] −50 0 50 100 10 1 −50 0 50 Equivalent Latitude 100 10 1 Pressure [hPa]
HALOE NOx Climatology July (sunset only)
HALOE NOx Climatology July (sunset only)
−50 0 50 Equivalent Latitude 100 10 1 Pressure [hPa] −50 0 50 100 10 1 −50 0 50 Equivalent Latitude 100 10 1 Pressure [hPa]
HALOE NOx Climatology October (sunset only)
HALOE NOx Climatology October (sunset only)
−50 0 50 Equivalent Latitude 100 10 1 Pressure [hPa] −50 0 50 100 10 1
Fig. 9. As Fig. 3, but climatology for NOx. Here only sunset observations have been used.
latitude binning. Moreover, file haloe eqlat monthly avg.nc contains monthly averages of each month during the
con-sidered time period. The chemical mixing ratios and
their standard deviation of files haloe climat eqlat.nc and haloe climat lat.nc are also added as ASCII tables (e.g. haloe climat eqlat o3.dat, haloe climat eqlat o3 stdev.dat).
6 Conclusions
The HALOE climatology presented here was compiled espe-cially as input for GCM and CTM simulations representing the current status of the atmosphere. It uses a single stable data source and therefore avoids problems with biases be-tween datasets. Despite some limitations discussed above, the climatology is well suited as input for model simulations
for the 1990s. The climatology for the tracers CH4and HF
may be used for the evaluation of meridional transport. The climatology for the other species may also be used for evalu-ation of simulated stratospheric chemistry.
Acknowledgements. The authors gratefully acknowledge the United Kingdom Meteorological Office (UKMO) for providing the meteorological analyses. We thank the HALOE team for providing a high quality dataset, and especially E. Remsberg, E. Thomson and L. Deaver for discussions about the data. We also thank R. M¨uller for fruitful discussions, and P. Bittihn for programming support.
Edited by: M. Dameris
References
Beaver, G. M. and Russell, J. M.: The climatology of stratospheric HCl and HF observed by HALOE, Adv. Space Res., 21, 1373– 1382, 1998.
Bhatt, P. P., Remsberg, E., Gordley, L. L., McInerney, J. M., Brack-ett, V. G., and Russell, J.: An evaluation of the quality of Halogen Occultation Experiment ozone profiles in the lower stratosphere, J. Geophys. Res., 104, 9261–9275, 1999.
Br¨uhl, C., Drayson, S. R., Russell III, J. M., Crutzen, P. J., McIn-erney, J. M., Purcell, P. N., Claude, H., Gernandt, H., McGee, T. J., McDermid, I. S., and Gunson, M. R.: Halogen Occulta-tion Experiment ozone channel validaOcculta-tion, J. Geophys. Res., 101, 10 217–10 240, 1996.
Chiou, E. W., McCormick, M., and Chu, W. P.: Global water vapor distributions in the stratosphere and upper troposphere derived from 5.5 years of SAGE II observations (1986–1991), J. Geo-phys. Res., 102, 19 105–19 118, 1997.
Fortuin, J. P. F. and Kelder, H.: An ozone climatology based on ozonesonde and satellite measurements, J. Geophys. Res., 103, 31 709–31 734, 1998.
Gordley, L. L., Russell, J. M. III, Mickley, L. J., Frederick, J. E., Park, J. H., Stone, K. A., Beaver, G. M., McInerney, J. M., Deaver, L. E., Toon, G. C., Murcray, F. J., D.Blatherwick, R., Gunson, M. R., D.Abbatt, J. P., Mauldin III, R. L., Mount, G. H., Sen, B., and Blavier, J.-F.: Validation of nitric oxide and nitrogen dioxide measurements made by the halogen occultation experi-ment for UARS platform, J. Geophys. Res., 101, 10 240–10 266, 1996.
Grooß, J.-U., G¨unther, G., Konopka, P., M¨uller, R., McKenna, D. S., Stroh, F., Vogel, B., Engel, A., M¨uller, M., Hoppel, K., Bevilacqua, R., Richard, E., Webster, C. R., Elkins, J. W., Hurst, D. F., Romashkin, P. A., and Baumgardner, D. G.: Simula-tion of ozone depleSimula-tion in spring 2000 with the Chemical La-grangian Model of the Stratosphere (CLaMS), J. Geophys. Res., 107, 8295, doi:10.1029/2001JD000456, 2002.
Grooß, J.-U., G¨unther, G., M¨uller, R., Konopka, P., Bausch, S., Schlager, H., Voigt, C., Volk, C. M., and Toon, G. C.: Simulation of denitrification and ozone loss for the Arctic winter 2002/2003, Atmos. Chem. Phys., 5, 1437–1448, 2005,
SRef-ID: 1680-7324/acp/2005-5-1437.
Kley, D., Russell, J. M., and Phillips, C. (Eds.): SPARC Assessment of upper Tropospheric and Stratospheric Water vapor, WCRP-No. 113,WMO/TD-WCRP-No. 1043, SPARC Report WCRP-No. 2, WMO, Geneva, 2000.
Konopka, P., Steinhorst, H.-M., Grooß, J.-U., G¨unther, G., M¨uller, R., Elkins, J. W., Jost, H.-J., Richard, E., Schmidt, U., Toon, G., and McKenna, D. S.: Mixing and ozone loss in the 1999–2000 Arctic vortex: Simulations with the 3-dimensional Chemical La-grangian Model of the Stratosphere (CLaMS), J. Geophys. Res., 109, D02 315, doi:10.1029/2003JD003792, 2004.
Konopka, P., Grooß, J.-U., Hoppel, K., Steinhorst, H.-M., and M¨uller, R.: Mixing and chemical ozone loss during and after the Antarctic polar vortex major warming in September 2002, J. Atmos. Sci., 62, 848–859, 2005.
Lary, D. J., Chipperfield, M. P., Pyle, J. A., Norton, W. A., and Riishøjgaard, L. P.: Three-dimensional tracer initialization and general diagnostics using equivalent PV latitude-potential-temperature coordinates, Q. J. R. Meteorol. Soc., 121, 187–210, 1995.
McKenna, D. S., Konopka, P., Grooß, J.-U., G¨unther, G., M¨uller, R., Spang, R., Offermann, D., and Orsolini, Y.: A new Chemi-cal Lagrangian Model of the Stratosphere (CLaMS): Part I For-mulation of advection and mixing, J. Geophys. Res., 107, 4309, doi:10.1029/2000JD000114, 2002.
Michelsen, H. A., Manney, G. L., Irion, F. W., Toon, G. C., Gunson, M. R., Rinsland, C. P., Zander, R., Mahieu, E., Newchurch, M. J., Purcell, P. N., Remsberg, E. E., Russell, J. M., Pumphrey, H. C., Waters, J. W., Bevilacqua, R. M., Kelly, K. K., Hintsa, E. J., We-instock, E. M., Chiou, E. W., Chu, W. P., McCormick, M. P., and Webster, C. R.: ATMOS version 3 water vapor measure-ments: Comparisons with observations from two ER-2 Lyman-alpha hygrometers, MkIV, HALOE, SAGE II, MAS, and MLS,
J. Geophys. Res., 107, 4027, doi:10.1029/2001JD000587, 2002. Newman, P. and Nash, E.: The unusual southern hemisphere
strato-sphere winter of 2002, J. Atmos. Sci., 62, 614–628, 2005. Park, J. H., Russell, J. M., III, Gordley, L. L., Drayson, S. R.,
Benner, D. C., McInerney, J. M., Gunson, M. R., Toon, G. C., Sen, B., Blavier, J.-F., Webster, C. R., Zipf, E. C., Erdman, P., Schmidt, U., and Schiller, C.: Validation of Halogen Occulta-tion Experiment CH4 measurements from the UARS, J.
Geo-phys. Res., 101, 10 183–10 204, 1996.
Randall, C. E., Lumpe, J. D., Bevilacqua, R., Hoppel, K. W., Fromm, M. D., Salawitch, R. J., Swartz, W. H., Loyd, S. A., Kyr¨o, E., von der Gathen, P., Claude, H., Davies, J., DeBaker, H., Dier, H., Molyneux, M. J., and Sancho, J.: Reconstruction of 3D ozone fields using POAM III during SOLVE, J. Geophys. Res., 120, 8299, doi:10.1029/2001JD000471, 2002.
Randall, C. E., Rusch, D. W., Bevilacqua, R. M., Hoppel, K. W., Lumpe, J. D., Shettle, E., Thompson, E., Deaver, L., Zawodny, J., Kyr¨o, E., Johnson, B., Kelder, H., Dorokhov, V. M., K¨onig-Langlo, G., and Gil, M.: Validation of POAM III ozone: Com-parisons with ozonesonde and satellite data, J. Geophys. Res., 108, 4367, doi:10.1029/2002JD002944, 2003.
Randall, C. E., Harvey, V. L., Manney, G. L., Orsolini, Y., Co-drescu, M., Sioris, C., Brohede, S., Haley, C. S., Gordley, L. L., Zawodny, J. M., and Russell, J. M.: Stratospheric effects of en-ergetic particle precipitation in 2003–2004, Geophys. Res. Lett., 32, L05 802, doi:10.1029/2004GL022003, 2005.
Randel, W. J., Wu, F., Russell, J. M., Roche, A., and Waters, J. W.: Seasonal cycles and QBO variations in stratospheric CH4 and H2O observed in UARS HALOE data, J. Atmos. Sci., 55, 163–
185, 1998.
Randel, W. J., Wu, F., Russell, J. M., and Waters, J.: Space-time pat-terns of trends in stratospheric constituents derived from UARS measurements, J. Geophys. Res., 104, 3711–3727, 1999. Randel, W. J., Wu, F., Oltmans, S. J., Rosenlof, K., and Nodoluha,
G. E.: Interannual changes of stratospheric water vapor and cor-relations with tropical tropopause temperatures, J. Atmos. Sci., 61, 2133–2148, 2004.
Remsberg, E. E., Russell III,, J. M., and Wu, C.-Y.: An interim ref-erence model for the variability of the middle atmosphere water vapor distribution, Adv. Space Res., 10, 51–64, 1990.
R¨ockmann, T., Grooß, J.-U., and M¨uller, R.: The impact of an-thropogenic chlorine emissions, stratospheric ozone change and chemical feedbacks on stratospheric water, Atmos. Chem. Phys., 4, 693–699, 2004,
SRef-ID: 1680-7324/acp/2004-4-693.
Rosenlof, K. H.: Transport changes inferred from HALOE water and methane measurements, J. Meteorol. Soc. Japan, 80, 831– 848, 2002.
Russell III, J. M. and Swider, W.: MAP Summary–Structure and Composition, edited by: Vincent, R. A., MAP Handbook, 32, 1–20, 1991.
Russell, J. M., Gordley, L. L., Park, J. H., Drayson, S. R., Tuck, A. F., Harries, J. E., Cicerone, R. J., Crutzen, P. J., and Frederick, J. E.: The Halogen Occultation Experiment, J. Geophys. Res., 98, 10 777–10 797, 1993.
Russell, J. M., Deaver, L. E., Luo, M. Z., Cicerone, R. J., Park, J. H., Gordley, L. L., Toon, G. C., Gunson, M. R., Traub, W. A., Johnson, D. G., Jucks, K. W., Zander, R., and Nolt, I. G.: Vali-dation of hydrogen fluoride measurements made by the Halogen
Occultation Experiment from the UARS platform, J. Geophys. Res., 101, 10 163–10 174, 1996a.
Russell, J. M., Deaver, L. E., Luo, M. Z., Park, J. H., Gordley, L. L., Tuck, A. F., Toon, G. C., Gunson, M. R., Traub, W. A., Johnson, D. G., Jucks, K. W., Murray, D. G., Zander, R., Nolt, I. G., and Webster, C. R.: Validation of hydrogen chloride measurements made by the Halogen Occultation Experiment from the UARS platform, J. Geophys. Res., 101, 10 151–10 162, 1996b.
Taha, G., Thomason, L. W., and Burton, S. P.: Comparison of Stratospheric Aerosol and Gas Experiment (SAGE) II version 6.2 water vapor with balloon-borne and space-based instruments, J. Geophys. Res., 109, D18 313, doi:10.1029/2004JD004859, 2004.
Thomason, L., Burton, S. P., Iyer, N., Zawodny, J. M., and An-derson, J.: A revised water vapor product for the Stratospheric Aerosol and Gas Experiment (SAGE) II version 6.2 data set, J. Geophys. Res., 109, D06 312, doi:10.1029/2003JD004465, 2004.