HAL Id: hal-01696050
https://hal.archives-ouvertes.fr/hal-01696050v2
Submitted on 30 Jan 2018
HAL is a multi-disciplinary open access
archive for the deposit and dissemination of
sci-entific research documents, whether they are
pub-lished or not. The documents may come from
teaching and research institutions in France or
abroad, or from public or private research centers.
L’archive ouverte pluridisciplinaire HAL, est
destinée au dépôt et à la diffusion de documents
scientifiques de niveau recherche, publiés ou non,
émanant des établissements d’enseignement et de
recherche français ou étrangers, des laboratoires
publics ou privés.
hemodynamics during cirrhogenesis in rats
Chloe Audebert, Geert Peeters, Patrick Segers, Wim Laleman, Diethard
Monbaliu, Hannelie Korf, Jonel Trebicka, Irene Vignon-Clementel, Charlotte
Debbaut
To cite this version:
Chloe Audebert, Geert Peeters, Patrick Segers, Wim Laleman, Diethard Monbaliu, et al..
Closed-loop lumped parameter modelling of hemodynamics during cirrhogenesis in rats.
IEEE
Trans-actions on Biomedical Engineering, Institute of Electrical and Electronics Engineers, In press,
�10.1109/TBME.2018.2793948�. �hal-01696050v2�
Abstract—Objective: Cirrhosis is the common end-stage of any
given chronic liver disease, developing after persistent destruction and regeneration of parenchymal liver cells. The associated architectural distortion increases the intrahepatic vascular resistance, leading to portal hypertension and systemic circulatory disorders. This study investigates the impact of the changing vascular resistances on the hepatic and global circulation hemodynamics during cirrhogenesis. Methods: Cirrhogenesis was revisited using the thioacetamide rat model (N = 20). Rats were sacrificed at weeks 0, 6, 12, and 18. For each time-point 3D vascular geometries were created by combining hepatic vascular corrosion casting with µCT imaging. Morphological quantification of the trees branching topology provided the input for a lobe-specific lumped parameter model of the liver that was coupled to a closed-loop model of the entire circulation of the rat. Hemodynamics were simulated in physiological and pathological circumstances. Results: The simulations showed the effect of the liver vascular resistances (driven by the hepatic venous resistance increase) on liver hemodynamics with portal hypertension observed after 12 weeks. The closed-loop model was further adapted to account for systemic circulatory compensation mechanisms and disorders frequently observed in cirrhosis and simulated their impact on the hepatic, systemic and pulmonary hemodynamics. Conclusion: The simulations explain how vascular changes due to cirrhosis severely disrupt both hepatic and global hemodynamics.
Significance: This study is a priori the first to model the rat
entire blood circulation during cirrhogenesis. Since it is able to simulate cirrhosis main characteristics, the model may be translated to humans for the assessment of liver interventions.
Index Terms— closed-loop lumped parameter modelling;
hemodynamics; liver cirrhogenesis; systemic disorders; vascular corrosion casting.
* Shared first co-authorship
‡ Shared senior co-authorship
** Corresponding author: [email protected] 1 Inria, Paris, France.
2 Laboratoire Jacques-Louis Lions, Sorbonne Universités UPMC Univ. Paris
VI, Paris, France.
3 IBiTech – bioMMeda, Dept. Electronics and Information Systems, Ghent
University, Belgium.
4 Department of Clinical and Experimental Medicine, KU Leuven, Belgium. 5 Department of Gastroenterology and Hepatology, University Hospitals
Leuven, Belgium.
6 Department of Microbiology and Immunology, KU Leuven, Belgium. 7 Department of Abdominal Transplant Surgery, University Hospitals Leuven,
Belgium.
8 Department of Internal Medicine I, University Hospital of Bonn, Germany. 9 European Foundation for Study of Chronic Liver Failure, Barcelona, Spain.
I. INTRODUCTION
IRRHOSIS is the common end-stage of any chronically active liver disease. It develops after persistent destruction and regeneration of parenchymal liver cells, initiating necro-inflammation and fibrogenesis [1]. Eventually, normal liver tissue is replaced by diffuse fibrosis, vascularized ƒfibrotic septa, and regenerative nodules [2]. Previous studies have shown that the associated morphological reorganization of the hepatic architecture contributes to the increasing intrahepatic vascular resistance (IHVR), dysregulating liver perfusion [3, 4].
Cirrhosis is clinically divided into two stages –
compensated cirrhosis and decompensated cirrhosis. The
compensated stage represents the non-symptomatic phase, which may deteriorate towards decompensation characterized by clinical signs usually leading to hospitalization. Portal hypertension (PHT) is the earliest and most common clinical complication of liver cirrhosis. Aggravation of PHT leads to
variceal hemorrhage, hepatic encephalopathy,
hepatopulmonary syndrome and hepatorenal syndrome, major causes of morbidity and mortality in cirrhotic patients [5].
The pathogenesis of PHT originates from an increased IHVR (70%) and is further aggravated by dynamic vascular changes (30%) [6]. The dynamic (and reversible) component is primarily established by local imbalances between vasoconstrictor and vasodilator compounds [3]. Production of the vasodilatory NO molecule is reduced in the portal venous (PV) system, thereby increasing its resistance to flow. Paradoxically, extrahepatic vascular beds (including the mesenteric and peripheral beds) are subjected to an upregulation of vasodilators, leading to a hyperdynamic
circulation characterized by a low systemic vascular
resistance, and an increased cardiac output (CO), heart rate (HR), and plasma volume [7, 8].
The progressive IHVR promotes the formation of an extensive network of hepatic collateral vessels (shunts) that can divert up to 80% of the portal blood flow, partially but insufficiently alleviating the raised portal pressure [9].
To date, little research has focused on modelling liver hemodynamics in pathological conditions (e.g. cirrhosis). Li et al. [10] developed 3D computational fluid dynamic (CFD) models of healthy and cirrhotic human livers to study blood flow through the PV and mesenteric vein. Geometries were
Closed-loop lumped parameter modelling of
hemodynamics during cirrhogenesis in rats
*
Chloe Audebert
1,2*, Geert Peeters
3*, Patrick Segers
3, Wim Laleman
4,5, Diethard Monbaliu
6,7, Hannelie
Korf
4,5, Jonel Trebicka
8,9, Irene E. Vignon-Clementel
1,2‡**and Charlotte Debbaut
3‡based on CT-scans and results indicated that – in the case of cirrhosis – right-lobe atrophy was significantly influenced by the distribution of splenic venous blood. Van Steenkiste et al. [11] used vascular corrosion casting (VCC) to study vascular morphological changes and CFD simulations to compute PV wall shear stresses in portal hypertensive and cirrhotic rodents. Additional to the macrocirculatory research, only few studies have focused on modelling the hepatic microcirculation of healthy and cirrhotic livers. Debbaut et al. [12] performed image-based CFD simulations of the human sinusoidal 3D network, thereby characterizing the permeability of healthy hepatic lobules. The permeability tensor was subsequently used to develop a generic 3D liver lobule model based on porous media [13]. Similar simulations were conducted to quantify the permeability tensor of the human hepatic microcirculation in the case of cirrhosis [14]. The results suggested the presence of local compensation mechanisms (e.g. dilated sinusoids) at the microcirculatory level to alleviate PHT in cirrhotic livers. Altogether, most liver cirrhosis modelling research has thus focused on PV or microcirculatory hemodynamics of the liver.
To our knowledge, the impact of cirrhogenesis on the entire blood circulation has never been addressed from a modelling perspective. Therefore, the aim of the present study is to simulate the hemodynamics of the liver – including the hepatic artery (HA), PV, and hepatic venous (HV) flow - as well as the systemic circulation throughout the course of cirrhosis development (including systemic circulatory disorders in late stage cirrhosis). Compensated cirrhosis was chemically induced using the established thioacetamide (TAA) rat model [15]. At predefined time points during cirrhogenesis, 3D geometries of the hepatic vasculature were created by combining VCC and µCT imaging. Detailed morphological data of the 3D geometries were subsequentlyused as input for a lobe-specific resistive lumped parameter model of the liver [16], which was coupled to a closed-loop lumped parameter model of the entire blood circulation [17]. Our setup allowed both the hepatic and systemic hemodynamics to be simulated in physiological and pathological circumstances (e.g. cirrhosis).
II. MATERIAL AND METHODS
A. Animals
Cirrhogenesis was mimicked by prolonged administration of thioacetamide (TAA; Sigma-Aldrich, Bornem, Belgium) as described by Laleman et al. [15]. The study protocol was approved by the Ethical Committee of the University Hospital Leuven (Belgium). Male Wistar rats (n=20), weighing 250-300 g, were randomly divided into 4 groups (n=5). The animals were kept in cages at a constant temperature and humidity in a 12 h controlled light/dark cycle, with food and water provided ad libitum. Group 1 served as control group, providing normal hepatic characteristics. Groups 2 to 4 were intoxicated for 6, 12, and 18 weeks, respectively. Initially, a concentration of 0.03% of TAA was added to the drinking water. Hereafter, body weights were monitored weekly and
concentrations were adapted accordingly to keep individual body weights within the limits of 250 and 300 g. With increasing TAA intoxication, rat livers developed – from a histological perspective – hepatitis at 6 weeks, advanced hepatic fibrosis at 12 weeks, and eventually homogeneous macronodular cirrhosis at 18 weeks [15]. In the following sections, time points will be indicated by control (0 week), hepatitis (6 weeks), advanced fibrosis (12 weeks) and cirrhosis (18 weeks).
B. Data acquisition and processing
1) Vascular corrosion casting and µCT imaging
After their respective intoxication time (0, 6, 12 and 18 weeks), each group of rats was subjected to vascular corrosion casting (VCC) to create accurate 3D replicas of their hepatic vascular system. The procedure began by carefully exposing the liver of the anaesthetized rats. Heparin was administered intrasplenically to prevent coagulation (Heparine Leo, Leo Pharma, Lier, Belgium). The casting resin was sequentially injected, first in the abdominal aorta and then in the PV. To direct the resin flow into the liver, clamps were mounted on the thoracic aorta and renal arteries. The polyurethane-based resin contained PU4ii (VasQtec, Zurich, Switzerland), hardener (VasQtec, Zurich, Switzerland), ethyl methyl ketone (EMK; Merckx, Darmstadt, Germany) and color dyes (yellow and blue for the hepatic arterial (HA) and PV system, respectively). The contrast agent Lipiodol (Guerbet, Roissy-CdG, France) was added to the HA mixture to ensure a clear contrast enhancement of the arterial tree on µCT images. Shortly after injection, both afferent vessels and the thoracic caudal vena cava (CVC) were clamped to prevent resin leakage. The resin was allowed to polymerize intrahepatically for 72h, before being macerated for about 5 days in potassium hydroxide (25% KOH). The vascular replicas were µCT imaged at a resolution of [32-40] µm using a high-resolution µCT scanner (HECTOR, Centre for X-ray Tomography (UGCT), Ghent University, Belgium) to acquire detailed 3D datasets of the hepatic vasculature. A more elaborate description of the VCC and µCT protocol was described earlier [18].
2) Image processing
µCT datasets were processed with Mimics (Materialise, Leuven, Belgium) to segment the hepatic vascular trees. Segmentations were carried out semi-automatically. Due to the added contrast agent, different grey value ranges were assigned to the arterial and venous systems [18]. The grey value range of HVs also differed from the one of PV because of mixing of the injected HA (with contrast agent) and PV resin. For each time point (0, 6, 12, and 18 weeks), two liver casts were processed to obtain 3D reconstructions of all their vascular trees (HA, PV, and HV).
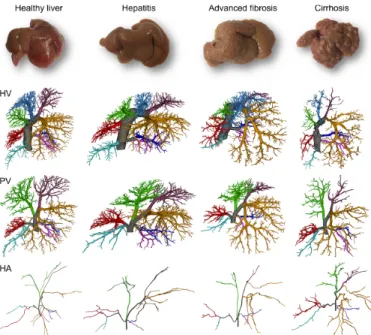
After segmentation, vascular trees were subdivided according to their liver lobes. Typically, rat livers comprise four separate major lobes (median lobe, left lateral lobe, right lobe, and caudate lobe), of which three can be further subdivided in two sublobes [16]. For PV and HA, the vascular branching scheme starts at the trunk (Fig. 1), subsequently branching towards the right medial lobe (RML), left medial lobe (LML), left lateral lobe (LLL), right superior lobe (RSL), right inferior lobe
(RIL), superior caudate lobe (SCL) and inferior caudate lobe (ICL). The small paracaval liver lobe (2% of total liver tissue), also called the caudate process and typically nourished by two different portal vein branches, remained undetected. Its impact on the perfusion, however, appears to be very limited as it only becomes important in the case of extended liver resection (90% partial hepatectomy) [19]. A similar branching scheme was observed for the HV. The only difference was that the right medial lobe is subdivided in two separate sublobes (the RML-HV and middle medial lobe (MML)-HV) by two anatomically well-defined HV trees (Fig. 1).
Fig 1. Lobar branching schemes of each vascular tree (HV, PV, and HA) at different time points during cirrhogenesis. The rat livers comprise four separate major lobes (median lobe, left lateral lobe, right lobe, and caudate lobe), of which three were further subdivided in two sublobes. For the PV and HA vascular trees, the branching scheme started at the trunk (grey), which subsequently branched towards the right medial lobe (RML), left medial lobe (LML), left lateral lobe (LLL), right superior lobe (RSL), right inferior lobe (RIL), superior caudate lobe (SCL) and inferior caudate lobe (ICL). A similar branching scheme was observed for the HV. The only difference (indicated by a star) entailed subdividing the median lobe based on three anatomically well-defined HVs, draining the right medial lobe (RML), middle medial lobe (MML), and left medial lobe (LML).
3) Data analysis
The 3D reconstructions of the lobe-specific vascular trees were individually skeletonized and converted to graphs using dedicated software [18], which was developed based on TiQuant [20, 21]. By applying a diameter-defined top-down ordering algorithm presented earlier in [18], we were able to classify the trees according to their branching topology and extract morphological features (radius, length and number of vessels). To gather data across the entire length scale, ranging from the major blood vessels down to the smallest liver-specific capillaries (sinusoids), exponential trend lines were fitted to the geometrical attributes as a function of the generation number using a lobe-specific fitting algorithm (previously described in [16]).
The total number of generations for each PV and HV lobar vascular tree was estimated by extrapolating the radius until
reaching mean values representing sinusoids (reported in [22]). For 0, 6, 12, and 18-weeks intoxications, mean sinusoidal radii were measured to be 4.35 ± 0.22 µm, 4.29 ± 0.33 µm, 3.87 ± 0.38 µm, and 3.90 ± 0.45 µm, respectively. As HA and PV trees typically run in parallel after the first generations, we assumed that the total number of generations for each HA lobar vascular tree was equal to its PV counterpart. Furthermore, sinusoids were considered terminal HV branches, hence the final (extrapolated) generation of the HA and PV trees was removed. Trend lines of the radius, length, and number of vessels for a cirrhotic liver are presented in Fig. 2. Since rat liver lobes vary widely in size, the radii, lengths and total number of vessel generations also differed between the lobe-specific trees.
C. Lumped-parameter model 1) Closed-loop model
To simulate both the hepatic and systemic hemodynamics, we developed a closed-loop lumped-parameter model of the rat blood circulation (Fig. 3) based on a previously developed closed-loop lumped-parameter model for porcine applications [17]. To adapt the model to the rat, its parameter values were tuned based on literature [15, 23-26] and previously acquired hemodynamics values via microspheres [27]. The building blocks of the model include the heart, the liver, the lungs, the digestive organs (including spleen) and other organs (Fig. 3). The heart model was based on previous work [28, 29] and is described in detail in [30]. The other blocks were represented by three-element Windkessel models. The proposed model of the entire blood circulation was inspired by previous work on closed-loop lumped parameter models [31-34].
The model was further adapted to the rat liver and included a lobe-specific liver model, counting seven lobes [35]. HA, PV and HV branches common to several lobes were modelled by separate resistances computed from VCC data (Fig. 3). Each liver lobe was modelled to include three vascular trees (HA, PV, and HV), each represented by a separate resistance (Fig. 3). Noteworthy, the HV equivalent resistance of the RML was calculated based on the two draining HV vascular trees (MML-HV and RML-HV). Furthermore, an extrahepatic shunt was implemented to model the collateral network in cirrhosis. Except when mentioned otherwise, the extrahepatic shunt resistance was set to a very high value, allowing virtually no flow through the shunt.
For each time point (0, 6, 12, and 18 weeks), we computed the equivalent vascular resistances (Req in Pa·s·m-3) of the lobar trees (HA, PV, and HV) of two casted rat livers assuming Poiseuille flow using Eq. 1. In this way, the resistance depends on the dynamic viscosity of blood µ [3.5 x 10⁻³ Pa·s] and the mean length li [m], number of vessels ni, mean radius ri [m] of
each blood vessel generation i, with 𝑥 the total number of generations. 𝑅!"= 8𝜇𝑙! 𝑛!𝜋𝑟!! ! !!! [ Pa · s · m!! ]
(1)
Fig 2. Analysis of the lobe-specific vasculature (HV, PV, and HA) in the case of cirrhosis (cirrhosis 2). Exponential trend lines were fitted to the geometrical attributes (radius, length, and number of vessels) as a function of the generation number using a lobe-specific fitting algorithm, as described earlier in [16]. The lobe-specific trend lines start at generation 2, as the first generation depicts the attributes of the main trunk.
The model equations, a nonlinear differential-algebraic system, were solved with the IDA package from SUNDIAL [36]. The differential equations were integrated with a Backward Differentiation Formula and the obtained nonlinear system was solved with a Newton method. The solver provided by IDA includes an adaptive time step method [37]. For each simulation, the maximal time step was set to 10-4 seconds. For error control (at various levels), IDA introduces a mixed relative and absolute tolerance criterion [37]. The relative and absolute tolerances for all simulations of this work were set to 10-6 for each variable. Seven pressures were imposed as initial conditions (proximal pressure in the 3 RCR Windkessels as well as the 4 heart chamber pressures). The simulated time was 2 seconds (10 cardiac cycles of 0.2 s). For this simulation time, the averaged computation time on a 4-core laptop computer was 5 seconds.
2) Model calibration
The closed-loop model was calibrated to the baseline hemodynamics (0-week intoxication) using the hepatic vascular data of the two control rats (0 week). We calculated the lobar equivalent vascular resistances (Eq. 1) to define the lobe-specific model for each rat. Hereafter, the model parameters of the rat heart were attuned to provide mean arterial pressure (MAP), cardiac outflow (CO) and heart rate (HR) values reported in literature (Table I) [15, 23-26]. More precisely, the heart parameters, representing the rat heart hemodynamics, were manually calibrated based on a simpler
model only including four heart chamber, the pulmonary circulation and the systemic circulation. First, the total resistances of the systemic and pulmonary circulation were fixed. Subsequently, the systemic circulation total resistance was estimated by MAP/CO and pulmonary circulation resistance by ΔP/CO with ΔP=10mmHg. The heart rate determined the contraction and relaxation time of the heart chamber (like in [28]). Unloaded volumes of the heart chambers were estimated assuming proportionality to the body weight as follows
V!,! = V!,!! W! W!
where V!,!! are the unloaded volumes of human heart model [28] and W!= 250𝑔 , W!= 70𝐾𝑔 are the average rat and human weights. As such, only the elastance baseline and amplitude of the heart chamber remained to be calibrated. These parameters were initially estimated based on values for humans (reported in [28]) and subsequently manually tuned to match systole, diastole and central venous pressures, reported in literature [15, 23-26]. This resulted in 𝐸!!= 𝛼!𝐸!! where 𝐸!! and 𝐸!!are the rat and human heart elastances, respectively, and 𝛼!∈ [6. 10!!, 5. 10!!] is the scaling factor. All heart parameters are listed in the supplementary table III. Then, the digestive organs total resistance Rdo was estimated based on PV pressures and flows reported in literature (Rdo = (MAP – Ppv)/Qpv, with Ppv and Qpv the PV pressure and flow, respectively). Subsequently, the resistance of the other organs Roo was estimated based on the HA (averaged over both control rats), digestive organs and systemic resistances (Roo =
1/(1/Rsyst – 1/Rha – 1/Rdo). Lastly, the resistances and capacitances were further manually calibrated to simulate hepatic and systemic rat hemodynamics, resembling physiological conditions (see Table I). The model parameters - except the liver lobe resistances - remained the same for each simulation (for each animal and each cirrhogenic time point), unless mentioned otherwise. An overview is presented in supplementary Table III.
Fig 3. Schematic representation of the closed-loop lumped model for the rat circulation. The model is based on [17] and includes a resistive liver model comprising seven lobes and common HA/PV branches, which is based on [16]. Extra-hepatic shunts were also included and are represented by a single vascular resistor. The vascular resistances of the lobes were computed based on the vascular data derived after µCT scanning of the vascular corrosion casts. The remaining model parameters, which were used to mimic the heart, digestive and other organs, are documented in Table III (supplementary material).
3) Circulatory disorders
Cirrhogenesis (and PHT in particular) is postulated to induce pathological mechanisms that dysregulate the systemic circulation, and may eventually lead to a hyperdynamic circulatory state. Therefore, the most relevant hemodynamic consequences were added to the cirrhotic model (18-week intoxicated simulations) and tested by means of three cases[7, 38, 39].
Case I: decreased MAP. Cirrhosis may induce a decrease
of the MAP, mainly due to vasodilation of the splanchnic and peripheral vascular beds. Niederberger et al. reported a halving of the systemic vascular resistance after 9-10 weeks of CCL4-intoxication in rats [24]. At that time, rats had already developed cirrhotic ascites. Similar observations were made in CCl4-induced cirrhotic rats without ascites by Fernández-Muñoz et al. [23]. From a modelling perspective, vasodilation of the mesenteric and peripheral vascular beds was achieved by reducing the total resistances of the digestive and other organs by a factor 2 (see supplementary Table III).
Case II: increased CO. In the case of cirrhosis, an
increased circulatory volume was reported [38]. This increase is characterized by an increased venous blood return, in turn leading to an increased PV flow and CO. This was implemented in the model by artificially adding extra venous blood flow to the right atrium. The venous volume was increased by 0.5 ml, which is about 10% of the returned venous volume per heartbeat. As such, the overall blood volume was increased and the CO was elevated as reported in [23, 24].
Case III: collaterals development. An extensive network
of collaterals (mainly portosystemic and splenorenal shunts) may develop in cirrhosis. In this way, blood can bypass the liver, leading to a decreased PV inflow.
An extrahepatic shunt was added to the model by means of a vascular resistance and guides part of the blood from the digestive organs directly into the systemic venous system, thereby bypassing the liver [15, 40, 41]. During the morphological analysis, two portosystemic shunts were detected in one of the cirrhotic rats (cirrhosis 2) (illustrated in [22]), shunting blood directly from the portal trunk into the caudal vena cava. In addition, previous research documented that blood flow through the splenorenal shunt was multiplied by 3.5 in the case of TAA cirrhotic rats [15]. Since the combined effect of portosystemic and splenorenal shunts was modelled by a single vascular resistance in our model (see extrahepatic shunt in Fig. 3), the extrahepatic shunt resistance was defined to divert about 30% of the PV flow (see supplementary Table III). This value was arbitrarily chosen as it is highly rat dependent, but concurred with literature [9].
III. RESULTS
The hepatic and systemic hemodynamics of the different time points were obtained by averaging the simulations over the last cardiac cycles after periodic convergence of the solution. As hemodynamics differed between rats belonging to the same group, we will report the resulting values using the following notation: m(r1, r2) with m, r1, r2 the mean value and value of first and second rat of the cirrhogenic time point, respectively.
A. Baseline hemodynamic state
The simulated total liver PV and HA flows of the control rats were 0.17 (0.17, 0.17) ml/s and 0.025 (0.036, 0.014) ml/s, respectively. The hepatic venous pressure gradient (HVPG, the difference between PV pressure (Ppv) and venous pressure (Pv)) and MAP pressures equaled 3.6 (3.0, 4.1) mmHg and 127 (126, 128) mmHg, respectively, and the CO was 1.1 (1.1, 1.1) ml/s. These hemodynamic parameters, resembling physiological conditions, are in agreement with literature values (see Table I).
B. Hepatic hemodynamics during cirrhogenesis
To assess the global impact of the adaptive morphology on the hepatic vascular resistance, the equivalent resistances (in Pa·s·m-3) of the entire hepatic vascular trees (HA, PV, and HV) were calculated for two animals for each time point (see Table II). At 6 weeks, equivalent resistances were still close to the control values. From 12 weeks onwards, HA resistances gradually decreased with development of cirrhosis, dropping from 7.94 (4.25, 11.6) x 1011 Pa·s·m-3 (control) to 1.12 (1.27, 0.98) x 1011 Pa·s·m-3 (cirrhosis). The equivalent resistance of the PV, on the other hand, did not show any unambiguous temporal pattern between the groups. For instance, one of the cirrhotic animals (cirrhosis 2, probably with more advanced cirrhosis) demonstrated an increased PV resistance (1.84 x 10⁹
Pa·s·m-3), while the other cirrhotic animal (cirrhosis 1) indicated a decreased PV resistance (0.62 x 10⁹ Pa·s·m-3) compared to control animals (1.09 (0.97, 1.22) x 109 Pa·s·m-3). Most strikingly, however, was the significant increase of the HV resistances in the cirrhotic stage (7.03 (5.97, 8.08) x 109 Pa·s·m-3), reaching resistive values which were 7 to 9 times higher than control values (0.85 (0.72, 0.97) x 109 Pa·s·m-3).
In addition, the hemodynamic impact of the cirrhosis-induced vascular changes was assessed via our closed-loop model using lobe-specific hepatic vascular resistances. Fig. 4 presents an overview of the simulated hepatic hemodynamics at the different time points for the different animals. At 6 weeks (hepatitis), HA and PV flows (0.03 (0.02, 0.03) ml/s and 0.17 (0.17, 0.17) ml/s, respectively) and PV pressure (4.6 (4.6, 4.6) mmHg) were comparable to control values. From 12 weeks (advanced fibrosis) onwards, HA flow increased from 0.05 (0.02, 0.07) ml/s to 0.13 (0.11, 0.14) ml/s (cirrhosis) and the PV flow slightly decreased from 0.17 (0.17, 0.16) ml/s to 0.15 (0.15, 0.14) ml/s (cirrhosis). Moreover, an increase of the PV pressure was observed going from 7.4 (5.4, 9.4) mmHg (advanced fibrosis) to 18.2 (14.3, 22.1) mmHg (cirrhosis). The HVPG also increased from 5.2 (3.2, 7.2) mmHg (advanced fibrosis) to 16.0 (12.1, 19.8) mmHg (cirrhosis). MAP slightly decreased for cirrhotic animals compared to control rats (121 (122, 121) mmHg, cirrhosis).
Purely looking from a hemodynamic modelling perspective, we noticed that rat livers – intoxicated for 12 weeks – appeared to be in a transitional phase: while one liver (advanced fibrosis 1) yielded normal hemodynamics, simulation of the other liver (advanced fibrosis 2) already showed impaired hepatic hemodynamics with developing PHT.
Fig 4: Overview of the simulated hepatic hemodynamics for the different time points. In the simulations, only the vascular resistances of the liver model were adapted during consecutive time points (the parameters of the systemic circulation remained the same). The results indicate that the HA flow increased from the 12-week time point, whereas the PV flow decreased. Furthermore, the PV pressure and HVPG steeply increased from 12 weeks onwards, while the MAP slightly decreased.
C. Interlobar flow distribution and sinusoidal pressure
Intrahepatically, we noticed that the flow distributions varied between lobes, i.e. different lobes received different percentages of the total HA and PV flows. The larger lobes
LLL and RML receive relatively high inflow (Fig. 5), whereas smaller lobe (RIL and SCL) receive smaller inflow [35]. Mostly, lobes received more PV than HA blood. However, the HA flow appeared to increase for nearly every lobe during cirrhosis development with the opposite being true for the lobar PV flow. Moreover, lobes receiving a smaller PV flow (e.g. RML in control; RSL and SCL in advanced fibrosis; LML, RSL, RIL, and ICL in cirrhosis) were mostly irrigated by a higher HA flow (or vice versa), probably attempting to ensure a constant inflow of the lobes. In both animals of the cirrhotic stage and animal 1 of the advanced fibrotic stage, lobes (e.g. LML, RSL, ICL and SCL) even showed a reversed PV flow accompanied by an atypically high HA flow.
At the microlevel, simulated sinusoidal pressures differed between lobes (Fig. 5) ranging from 3.1 (ICL; control 1) to 5.0 mmHg (RIL; control 2) under physiological conditions. Sinusoidal pressures remained stable during the first phases of cirrhogenesis until reaching the advanced fibrotic stage (12 weeks), at which they started to increase steadily up to values 11.4 (SCL; cirrhosis 1) and 25.0 (RSL; cirrhosis 2) mmHg after 18 weeks.
D. Systemic circulatory disorders in cirrhosis
Fig. 6 and Fig 7. portray the impact of the circulatory disorders on the systemic and hepatic hemodynamics. In the absence of any systemic disorder, the 18-week simulations showed that the CO, splanchnic flow, HA flow, and PV flow were equal to 1.2 (1.1, 1.2) ml/s, 0.15 (0.14, 0.15) ml/s, 0.13 (0.11, 0.14) ml/s, and 0.15 (0.15, 0.14) ml/s, respectively. The MAP and PV pressures were simulated to be 122 (122, 121) mmHg and 18.2 (14.3, 22.1) mmHg, respectively.
Modelling systemic vasodilation (case I) led to an increase of the CO (1.4 (1.4, 1.4) ml/s), splanchnic flow (0.17 (0.18, 0.16) ml/s) and PV flow (0.17 (0.18, 0.16) ml/s). The HA flow (0.08 (0.07, 0.08) ml/s), MAP (79 (79, 79) mmHg) and PV pressure (17.8 (14.4, 21.2) mmHg) decreased due to the reduced vascular resistance of the systemic circulation. Artificially increasing the blood volume (case II) caused flows and pressures to increase with a factor of about 1.3. The collateral network (case III) was implemented to shunt about 30% of the total PV flow directly into the vena cava. As a result, PV pressure (15.0 (12.4, 17.6) mmHg) and PV flow (0.09 (0.10, 0.08) ml/s) decreased, while other systemic hemodynamics remained more or less unaffected.
Compared with control hemodynamics, the combined effect of the three cases caused the CO (1.8 (1.8, 1.8) ml/s), splanchnic flow (0.24 (0.25, 0.23) ml/s) and PV flow (0.17 (0.19, 0.15) ml/s) to increase, while the HA flow decreased (0.1 (0.09, 0.11) ml/s). In this case, the MAP (104 (104, 104) mmHg) also decreased and PV pressure (19.7 (16.7, 22.7) mmHg) increased. Central venous pressure was increased from 2.2 (2.2, 2.2) mmHg in control to 3.6 (3.6, 3.6) mmHg in the cirrhotic case I-III.
Fig 5: Overview of simulated hemodynamics for each lobe and each animal during cirrhosis development. The lobe-specific distribution of the HA (top panel) and PV (middle panel) flow varied between rats belonging to the same group, i.e. lobes received different percentages of HA and PV inflow. Interestingly, lobes (e.g. RML in control; RSL, and SCL in advanced fibrosis; LML, RSL, RIL, and ICL in cirrhosis) receiving a smaller PV flow were mostly irrigated by a larger HA flow (or vice versa). In both animals of the cirrhotic stage and animal 1 of the advanced fibrotic stage, an abnormal flow pattern was detected as PV flow was reversed in several lobes (LML, RSL, ICL, and SCL). Those lobes received an atypically high percentage of HA flow. In addition, the sinusoidal pressure (bottom panel) also varied between lobes. The pressures remained stable during the first phases of cirrhogenesis. From the advanced fibrotic stage (12 weeks) onwards, they steadily increased until reaching values ranging from 11.4 to 25 mmHg at the cirrhotic stage.
Along with the systemic circulation, changes of the pulmonary circulation were also observed in the simulation combining the three cases. Right ventricular systolic pressure was elevated (42.5 (42.5, 42.5) mmHg), as were pulmonary artery mean (increasing from 22.2 (22.3, 22.1) mmHg in control to 35.2 (35.2, 35.2) mmHg in cirrhotic case I-III) and systolic pressure (26.7 (26.8, 26.6) mmHg in control to 42.5 (42.5, 42.5) mmHg cirrhotic case I-III).
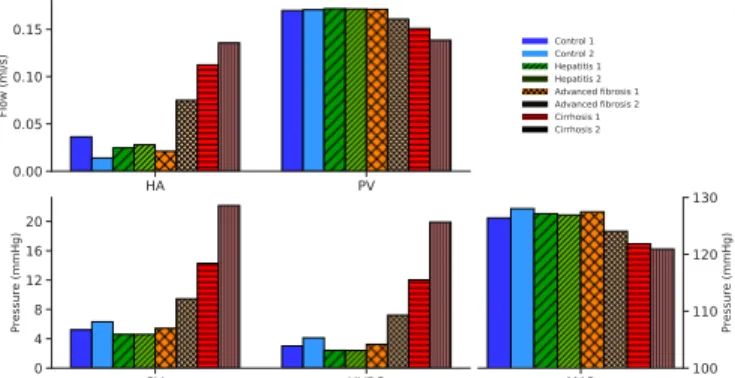
Fig 6: The most relevant circulatory disorders in the case of cirrhosis were added to the model by virtue of three cases. Their impact on systemic and hepatic flows was simulated for both cirrhotic animals and compared to values obtained in the absence of any disorder (blue bar) and to value ranges reported in literature (last bar; minimum in shaded grey and maximum in deep grey) [15, 23, 24]. Case I entailed vasodilating the mesenteric and peripheral vascular beds. Case II denoted the increase of the circulatory volume and case III was implemented to include extra-hepatic shunts, such as splenorenal and portosystemic shunts.
Fig 7: The most relevant circulatory disorders in the case of cirrhosis were added to the model by virtue of three cases. Their impact on arterial and PV pressure was simulated for both cirrhotic animals and compared to values obtained in the absence of any extra disorder (blue bar) and to values ranges reported in literature (last bar; minimum in shaded grey and maximum in deep grey) [15, 23, 24]. Case I simulated the vasodilation of the mesenteric and peripheral vascular beds. Case II denoted the increase of the circulatory volume and case III was implemented to include extra-hepatic shunts, such as splenorenal and portosystemic shunts.
E. Time variation of major variables
Fig. 8 shows the HA and PV flows, the PV, systemic artery and pulmonary artery pressures over time as well as the left-ventricle pressure-volume loop curve for control and cirrhosis simulations (with and without circulatory disorder assumptions). The PV flow waveform remained unchanged, whereas the amplitude of the HA flow increased and its amplitude was multiplied by a factor 3 for the cirrhosis cases. The PV pressure amplitude also increased due to cirrhosis
(increased by 4 mmHg in average) and even worsened in the case of circulatory disorders (increased by 7 mmHg in average). The systemic artery and pulmonary artery pressures were virtually unaffected by the changing hepatic resistances. In contrast, the circulatory disorders severely impacted these pressures. A similar behavior was observed for the
pressure-volume loop curves. Compared to the control simulations, the cirrhosis simulations with circulatory disorders showed, an increase in both pulmonary artery pressures (the amplitude increased by 66%) and arterial pulse pressures also increased (by 42%). The stroke work (the area within the PV loop) was increased by 38%.
Fig 8: Time variations for major variables in control and cirrhosis cases (with and without circulatory disorders I-III). The variables shown are PV flow and pressure (upper left quarter (a-c)), HA flow and pressure (upper right quarter (b-d)), left-ventricle pressure-volume loop (lower left quarter (e)) and pulmonary artery pressure (lower right quarter (f)).
IV. DISCUSSION
The present study is, to the best of our knowledge, the first to model the entire blood circulation of the rat during cirrhogenesis. At four discrete time points during the progression towards cirrhosis, VCC and µCT scanning were used to finely capture and reconstruct detailed geometries of the hepatic vasculature in 3D. Morphological quantification of the resulting hepatic vascular trees was performed in a lobe-specific way and according to the diameter-defined branching topology using dedicated software [18]. This approach allowed a lobe-specific resistive model of the rat liver to be developed, which was based on the principles of the open-loop model of Debbaut et al. [16]. The lobe-specific liver model was coupled with a closed-loop model of the systemic circulation as proposed by Audebert et al. [17]. We successfully adapted and calibrated the coupled model to mimic rat hemodynamics, enabling us to simulate and analyse intra- and extrahepatic hemodynamics at different time points during cirrhogenesis.
The results of the simulations clearly portray the impact of the changes in the different liver vascular resistances on the liver hemodynamics during cirrhosis development. We noted that the pathological changes of the hepatic vasculature instigated PV pressures to rise gradually, eventually leading to PHT. These results concur with hemodynamic measurements performed in the same TAA rat model, indicating that PHT was already present after 12-week intoxication [15]. After 18 weeks, our simulations without systemic circulatory disorders indicated that PV pressures increased up to about 3-fold its control value due to a combination of factors. A decreased HA resistance induced HA flow to increase, which, even without
any other resistance change, increases sinusoidal pressure. In addition, HV resistance increased, inducing a larger HVPG, which is even larger with increased HA. Both lead to an increase of PV pressure. Hence, the commonly reported ‘IHVR increase’ (thought of as ‘PV pressure - or HVPG - over PV flow’) potentially reflects in fact a combination of mechanisms.
In addition, the lobe-specificity of the liver model allowed flow distributions in the liver to be assessed, which we observed to differ between different liver lobes when analysing mean values. We encountered that a low lobar PV flow was mostly accompanied by a higher HA flow to that specific lobe (or vice versa). Similar findings have been documented in [16] and could be related to the hepatic arterial buffer response (HABR) [42], which attempts to ensure constant irrigation of liver lobes, or to the flow competition between the HA and PV flow [43].
In the cirrhotic animals, an abnormal flow pattern was detected with PV flow being reversed in some lobes (Fig. 5). Reversal of PV flow is generally considered a precursor of hepatofugal flow and indicates the presence of advanced PHT [44]. The lobes experiencing reversed PV flow were mostly accompanied by an atypically high HA flow, suggesting that HABR mechanisms may still be present in more advanced stages of cirrhosis.
Lastly, the closed-loop model was adapted by means of three cases to take into account circulatory disorders responsible for the hyperdynamic circulation in cirrhosis [15, 23, 24]. We simulated the effect of each case on the hemodynamics individually. However, individual cases were unable to reproduce all observed disorders. Vasodilation of the peripheral and splanchnic vascular beds (case I) induced most
of the expected hyperdynamic characteristics, though the increase of CO remained too small [23, 24]. The increase of CO was well-captured by artificially increasing the blood volume (case II). However, case II caused an increase of MAP, whereas in cirrhosis a decreased MAP is expected. Increasing the blood volume being shunted around the liver (case III) reduced the PV pressure, but this had no significant impact on other systemic parameters. The simulation combining the three cases was found to resemble cirrhotic conditions the most as hemodynamics were in agreement with literature values (see reference values in Fig.6 and Fig. 7) [15, 23, 24]. However, the increase of the CO appeared to be underestimated in the combined simulation.
We concluded that the main circulatory disorders - inherent to a hyperdynamic state - could be reproduced by combining the three cases. The combined simulations produced results that were in close agreement with hemodynamics measurements performed earlier in the same rat model [15]. Moreover, the simulations suggested that PHT – the main clinical manifestation of cirrhosis – was initiated by the ‘increased IHVR’ (in the sense discussed above) and that liver dysfunction was further aggravated by circulatory disorders, inducing other clinical complications. Furthermore, the pressures in the pulmonary artery and right heart chambers increased when the systemic circulatory disorders were included in the cirrhotic simulations. Similar observations were reported in [39]. The added venous return and systemic vasodilatation increased the pressure in the right atrium, which in turn caused the right ventricle and the pulmonary artery pressures to increase. The time varying PV pressure and HA flow showed an increased amplitude for the cirrhotic cases with and without circulatory disorders. Moreover, the left heart stroke-volume, the systemic arterial pressure and the pulmonary artery pressure were mainly impacted by the circulatory disorders. However, as no continuous measurements were performed in this study, these findings remain to be confirmed by future experimental studies. Such measurements still imply catheterization of the animal to measure pressure and remain very challenging to perform to date.
Some aspects of this study were very labor intensive and time consuming. This was particularly the case for the segmentation of the µCT datasets, which is why only two liver casts were fully segmented for each time point. To accurately model all vascular trees, liver casts should ideally be scanned at a sufficiently high resolution to allow the HA to be reconstructed up to the same generation as the PV. This was, however, technically impossible with the current computational capabilities as diameters of HA branches were typically smaller than PV branches. In one of the control simulations, we obtained a simulated HA flow (control 2 – 0.014 ml/s) smaller than reported in literature. We assumed that either the HA flow was lower than usual in this particular animal or that the HA equivalent resistance was overestimated due to the limited imaging resolution. Nevertheless, we concluded that including HA trees into the liver model was essential, as it provided better insight into the adaptive flow distribution between lobes and the HA-PV interaction during cirrhogenesis (a low PV flow was most likely compensated by
a high HA flow to the same lobe). To limit the impact of the segmentation on the hemodynamic simulation, we ensured that the vascular reconstruction was performed consistently for the different casts by one and the same person using the same methods.
In this work, only vascular resistances were changed during progression of the liver towards cirrhosis. Heart parameters and venous capacitances, on the other hand, remained unaltered in the model, but may also change in reality during disease development. To our knowledge, venous capacitance changes have not yet been quantified in literature, and were therefore not integrated in the model. In contrast, changes of the systemic resistance and mesenteric hemodynamics, as reported in literature, formed the basis for modifying the model resistances. With these modifications, the model reproduced the main circulatory disorders, frequently reported in cirrhosis development. Besides, cirrhotic cardiomyopathy may also occur in a subset of patients [45]. Nevertheless, other models than TAA (e.g. bile duct ligation) have been described as suitable models to study cirrhotic cardiomyopathy. The latter could be studied with our model as a further development of cirrhosis, while the current study mainly focused on vascular changes.
In this study, the vasodilation of the systemic circulation was assumed to be uniform, as the adopted model did not delineate between different organ blocks. However, vasodilation of vascular beds is not uniform across the vascular system in cirrhosis, i.e. renal flow is increased in compensated cirrhosis but decreased in the decompensated stage, whereas the cerebral flow is normal or increased in compensated cirrhosis [38, 46]. To examine these phenomena more precisely, the organ blocks of interest could be readily integrated in the closed loop model.
Vascular compliance was only accounted for by the capacitances of the three-element Windkessel components. Adding more compliances would most likely affect the amplitude and waveform of the curves. However, as no time varying measurements were available for this study, defining values for these parameters in rats would be challenging. Moreover, in this study, we opted for a minimum number of elements to minimize the parameters to be calibrated. Additional experimental measurements could allow for construction of a more detailed model (e.g including a capacitance in the aorta and in the vena cava), as proposed in [47] or patients with single-ventricle physiology.
Towards the future, hemodynamics (e.g. HA/PV pressures and flows, MAP, and CO) and the percentage of shunted blood should be measured prior to VCC of rat livers. In this study, we discussed the results in light of previously performed measurements [15, 23, 24]. While it did not allow for a one-on-one comparison/validation, simulated values were in close agreement with the values measured in a previous study in the same animal model (except for the CO). We adopted this approach to gain more insight into a single aspect of cirrhosis, i.e. the impaired perfusion due to vascular morphological changes. In addition, since VCC involves the sacrificing of the animal, it is not possible to perform a
rat-specific longitudinal study. Furthermore, we believe that analyzing (and segmenting) a larger number of animals could shed more light on the observed hemodynamic intervariability within groups. . In addition, vascular compliance of the liver could be added to the model to account for changing mechanical properties during cirrhogenesis, i.e. liver becomes progressively stiffer leading to lower compliance [48]. Its implementation, however, would primarily affect flow and pressure pulsatility. On the other hand, it would be interesting to refine the liver model by integrating the changing blood volume reservoir of the liver during cirrhogenesis if the disease progression is dynamically modeled. Here, the transfer of blood volume from the liver to the circulation is taken into account by an increase in venous blood return to the heart in case II.
In this work, the lobule-scale microcirculation was not precisely modelled, even though it is generally assumed that angioarchitectural changes of the microcirculation play a pivotal role in the development of cirrhosis. In fact, the sinusoidal network was merely represented by a single resistor in this model (the last generation of HV). More accurate 3D models of healthy and cirrhotic circulation have been proposed by [13, 14, 18, 49]. Coupling our lobe-specific closed-loop model to a more detailed model of the microcirculation may facilitate to gain a better understanding of the altering microcirculatory hemodynamics during cirrhogenesis. In addition, the Fahraeus-Lindqvist effect was not accounted for, thereby assuming a constant blood viscosity throughout the macro- and microcirculation. This assumption, however, was justified for the present study, as we were mainly interested in the relative hemodynamic differences between consecutive time points of cirrhogenesis. On the other hand, the effective blood viscosity could be integrated into the model using the empirical law of Pries and Secomb [50], defining the viscosity as a function of the radius based on in-vivo and in-vitro experiments.
Lastly, the transition from rat towards human seems inevitable to fully elucidate this disease process. This would imply implementing a human liver model accounting for the different segments of the human liver. Such a segment-specific model would provide added value on the internal flow distribution, useful to detect segments affected by hepatofugal flow. A requisite for such human liver model, however, is the development of methods to measure or estimate necessary model parameters of each segment noninvasively. Moreover, it was not a priori obvious that the implemented systemic circulatory disorders that came from observations from the human [38, 39] would lead to rat model outputs that matched rat experimental data. The model can thus serve to test if cirrhosis triggers similar hemodynamics changes mechanisms between species.
Next to providing a better insight into liver perfusion and hemodynamics, the model could also be valuable for assessment of the “mechanistic treatment” of patients. Often, a transjugular intrahepatic portosystemic shunt (TIPS) is placed within the liver to connect the PV to the systemic venous circulation [51]. The immediate effect of this procedure is lowering the PV pressure, yet at the cost of bypassing the remaining functional hepatocytes thus bypassing the remnant liver functionality. Our model simulations could assist in sizing the TIPS (radius, length) for a specific patient to optimise the tradeoff between reducing the PV pressure and diverting blood around the liver.
V. CONCLUSION
Intra- and extrahepatic hemodynamics were simulated during TAA cirrhogenesis in rats. At predefined time points, VCC was used to finely reconstruct in 3D the hepatic vascular trees. Quantifications of the vascular trees topology and morphology served as input for a lobe-specific liver model that was coupled to a closed-loop model of the entire circulation of rats. The results portrayed the impact of the
hepatic morphological changes on the systemic
hemodynamics during cirrhogenesis. The model indicated that in the case of cirrhosis, an increase in hepatic venous resistance combined with a decrease in hepatic arterial resistance severely dysregulated liver perfusion by mainly increasing HA flow, the pressure loss in the hepatic venous system, and thus portal pressure. The commonly reported ‘IHVR increase’ reflects these coupled influences. The model results even displayed reversal of PV flow in some lobes. Systemic circulatory disorders, inherent to the hyperdynamic state, were also incorporated in the model and their specific influence on hepatic, systemic and pulmonary hemodynamics was studied. The simulations concurred with hemodynamic measurements performed earlier at similar time points and in the same animal model [15] when a combination of systemic circulatory disorders was taken into account. Pulmonary hypertension was an output of the model, quantifying its link with liver disease. The impact of this work might be of interest for surgical liver interventions.
Acknowledgment
This work was supported by the Agency for Innovation by Science and Technology in Flanders (Strategic Basic Research IWT 131446) and was in part funded via a BASL research grant. This material is based upon work supported by the French National Agency for Research ANR-13-TECS-0006 iFLOW. Charlotte Debbaut is supported by a postdoctoral research grant of the Research Fund Flanders (FWO, Grant number 1202418N).
TABLEI
MEASURED AND SIMULATED HEALTHY HEMODYNAMICS Heart rate (1/min) Splanchnic flow (ml/s) HA flow (ml/s) PV flow (ml/s) CO (ml/s) MAP (mmHg) PV pressure (mmHg) Measurements Fernandez-Munoz [23] 330 ± 29 0.16 0.08 ± 0.02 0.17 ± 0.01 1.3 ± 0.1 117 ± 5 9.6 ± 0.8 Niederberger [24] 2.2±0.07 130 ± 4 Pacher [25] 370 - 420 0.8 - 1.2 100- 124 Davies [26] 362 0.14 0.03 0.16 1.2 Laleman [15] 125- 137 5.6 - 5.9 Simulations Control 1 300 0.17 0.036 0.17 1.1 126 5.2 Control 2 300 0.17 0.014 0.17 1.1 128 6.3
Overview of measured healthy hemodynamics reported in literature and values obtained after simulating two control rats with the closed-loop lumped model (see Fig. 3). The model parameters of the closed-loop model were calibrated in such a way that the simulated values were close to literature values.
TABLEII
VASCULAR TREE RESISTANCES EVOLUTION WITH CIRRHOGENESIS HA resistance (Pa·s·m-3 x 10¹¹) PV resistance (Pa·s·cm-3 x 10⁹) HV resistance (Pa·s·m-3 x 10⁹) Control 1 4.25 0.97 0.72 Control 2 11.6 1.22 0.97 Hepatitis1 6.67 0.82 0.82 Hepatitis 2 5.91 0.97 0.61 Advanced fibrosis 1 7.76 0.79 1.34 Advanced fibrosis 2 2.06 1.25 3.10 Cirrhosis 1 1.27 0.62 5.97 Cirrhosis 2 0.98 1.84 8.08
The equivalent resistances (in Pa·s·m-3) of all vascular trees (HA, PV, and HV) calculated for two animals at each cirrhogenic time point.
REFERENCES
[1] M. Pinzani, et al., "Liver cirrhosis," Best Pract. Res. Clin.
Gastroenterol., vol. 25, no. 2, pp. 281-290, Apr 2011.
[2] D. Schuppan and N. H. Afdhal, "Liver cirrhosis," Lancet, vol. 371, no. 9615, pp. 838-851, Mar 2008.
[3] D. Thabut and V. Shah, "Intrahepatic angiogenesis and sinusoidal remodeling in chronic liver disease: New targets for the treatment of portal hypertension?," J. Hepatol., vol. 53, no. 5, pp. 976-980, Nov 2010.
[4] S. Lemoinne, et al., "Portal myofibroblasts promote vascular remodeling underlying cirrhosis formation through the release of microparticles," Hepatology, vol. 61, no. 3, pp. 1041-1055, Mar 2015. [5] M. Bolognesi, et al., "Splanchnic vasodilation and hyperdynamic
circulatory syndrome in cirrhosis," World J. Gastroenterol., vol. 20, no. 10, pp. 2555-2563, Mar 14 2014.
[6] E. A. Tsochatzis, et al., "Liver cirrhosis," Lancet, vol. 383, no. 9930, pp. 1749-1761, May 2014.
[7] Y. Iwakiri, et al., "Vascular pathobiology in chronic liver disease and cirrhosis - current status and future directions," J. Hepatol., vol. 61, no. 4, pp. 912-924, Oct 2014.
[8] S. Moller, et al., "Central and systemic haemodynamic effects of terlipressin in portal hypertensive patients," Liver, vol. 20, no. 1, pp. 51-59, Feb 2000.
[9] J. Vorobioff, et al., "Hyperdynamic circulation in portal-hypertensive rat model: a primary factor for maintenance of chronic portal hypertension," Am J Physiol., vol. 244, no. 1, pp. G52-G57, Jan 1983. [10] X. Li, et al., "Computational hemodynamics of portal vein hypertension
in hepatic cirrhosis patients," Biomed. Mater. Eng., vol. 26, pp. S233-S243, Aug 2015.
[11] C. Van Steenkiste, et al., "Vascular corrosion casting: analyzing wall shear stress in the portal vein and vascular abnormalities in portal hypertensive and cirrhotic rodents," Lab. Invest., vol. 90, no. 11, pp. 1558-1572, Nov 2010.
[12] C. Debbaut, et al., "Perfusion characteristics of the human hepatic microcirculation based on three-dimensional reconstructions and computational fluid dynamic analysis," J. Biomech. Eng., vol. 134, no. 1, p. 011003, Jan 2012.
[13] C. Debbaut, et al., "A 3D porous media liver lobule model: the importance of vascular septa and anisotropic permeability for homogeneous perfusion," Comput Methods Biomech Biomed Engin, vol. 17, no. 12, pp. 1295-1310, Dec 2014.
[14] G. Peeters, et al., "A multilevel modeling framework to study hepatic perfusion characteristics in case of liver cirrhosis," J. Biomech. Eng., vol. 137, no. 5, p. 051007, May 2015.
[15] W. Laleman, et al., "A stable model of cirrhotic portal hypertension in the rat: thioacetamide revisited," Eur. J. Clin. Invest., vol. 36, no. 4, pp. 242-249, Apr 2006.
[16] C. Debbaut, et al., "Modeling the impact of partial hepatectomy on the hepatic hemodynamics using a rat model," IEEE Trans. Biomed. Eng., vol. 59, no. 12, pp. 3293-3303, Dec 2012.
[17] C. Audebert, et al., "Partial hepatectomy hemodynamics changes: Experimental data explained by closed-loop lumped modeling," J.
Biomech., vol. 50, pp. 202-208, Jan 2017.
[18] G. Peeters, et al., "A multilevel framework to reconstruct anatomical 3D models of the hepatic vasculature in rat livers," J. Anat., vol. 230, no. 3, pp. 471-483, Mar 2017.
[19] C. Sanger, et al., "Intrahepatic Vascular Anatomy in Rats and Mice--Variations and Surgical Implications," PLoS One, vol. 10, no. 11, p. e0141798, Nov 2015.
[20] S. Hammad, et al., "Protocols for staining of bile canalicular and sinusoidal networks of human, mouse and pig livers, three-dimensional reconstruction and quantification of tissue microarchitecture by image processing and analysis," Arch. Toxicol., vol. 88, no. 5, pp. 1161-1183, May 2014.
[21] A. Friebel, et al., "TiQuant: software for tissue analysis, quantification and surface reconstruction," Bioinformatics, vol. 31, no. 19, pp. 3234-3236, Oct 2015.
[22] G. Peeters, et al., "Quantitative analysis of hepatic macro- and microvascular alterations during cirrhogenesis in the rat," J Anat (in
press), 2017.
[23] D. Fernandez-Munoz, et al., "Systemic and splanchnic hemodynamic disturbances in conscious rats with experimental liver cirrhosis without ascites," Am. J. Physiol., vol. 249, no. 3 Pt 1, pp. G316-G320, Sep 1985.
[24] M. Niederberger, et al., "Comparison of vascular nitric oxide production and systemic hemodynamics in cirrhosis versus prehepatic portal hypertension in rats," Hepatology, vol. 24, no. 4, pp. 947-951, Oct 1996.
[25] P. Pacher, et al., "Measurement of cardiac function using pressure-volume conductance catheter technique in mice and rats," Nat. Protoc., vol. 3, no. 9, pp. 1422-1434, Aug 2008.
[26] B. Davies and T. Morris, "Physiological parameters in laboratory animals and humans," Pharm. Res., vol. 10, no. 7, pp. 1093-1095, Jul 1993.
[27] J. Trebicka, et al., "Role of β3-adrenoceptors for intrahepatic resistance and portal hypertension in liver cirrhosis," Hepatology, vol. 50, no. 6, pp. 1924-1935, Aug 2009.
[28] P. J. Blanco and R. A. Feijoo, "A dimensionally-heterogeneous closed-loop model for the cardiovascular system and its applications," Med.
Eng. Phys., vol. 35, no. 5, pp. 652-667, May 2013.
[29] H. Suga and K. Sagawa, "Instantaneous pressure-volume relationships and their ratio in the excised, supported canine left ventricle," Circ.
Res., vol. 35, no. 1, pp. 117-126, Jul 1974.
[30] C. Audebert, et al., "Kinetic scheme for arterial and venous blood flow, and application to partial hepatectomy modeling," Comput.Methods in
Appl.Mech.Eng., vol. 314, pp. 102-125, Feb 2017.
[31] F. Liang and H. Liu, "A closed-loop lumped parameter computational model for human cardiovascular system," JSME INT J C MECH SY, vol. 48, no. 4, pp. 484-493, May 2005.
[32] P. Segers, et al., "Systemic and pulmonary hemodynamics assessed with a lumped-parameter heart-arterial interaction model," J Eng Math, vol. 47, no. 3, pp. 185-199, Dec 2003.
[33] E. Kung, et al., "A simulation protocol for exercise physiology in Fontan patients using a closed loop lumped-parameter model," J.
Biomech. Eng., vol. 136, no. 8, p. 081007, Aug 2014.
[34] Y. Shi, et al., "Review of zero-D and 1-D models of blood flow in the cardiovascular system," Biomedical engineering online, vol. 10, no. 1, pp. 10-33, Apr 2011.
[35] P. N. A. Martins and P. Neuhaus, "Surgical anatomy of the liver, hepatic vasculature and bile ducts in the rat," Liver Int, vol. 27, no. 3, pp. 384-392, Apr 2007.
[36] A. C. Hindmarsh, et al., "SUNDIALS: Suite of nonlinear and differential/algebraic equation solvers," ACM Trans. Math. Softw., vol. 31, no. 3, pp. 363-396, Sep 2005.
[37] A. C. Hindmarsh, et al., "User Documentation for ida v3. 0.0 (sundials v3. 0.0)," 2017.
[38] L. Blendis and F. Wong, "The hyperdynamic circulation in cirrhosis: an overview," Pharmacol. Ther., vol. 89, no. 3, pp. 221-231, Mar 2001. [39] S. Møller and J. H. Henriksen, "The systemic circulation in cirrhosis,"
in Ascites and renal dysfunction in liver disease. , 2nd ed, Malden: Blackwell, 2005, pp. 137-155.
[40] C. C. Chan, et al., "Hemodynamic assessment of the development of portal-systemic collaterals in portal hypertensive rats," Dig. Dis. Sci., vol. 56, no. 2, pp. 417-424, Feb 2011.
[41] J. F. Halvorsen and A. O. Myking, "The porto-systemic collateral pattern in the rat. An angiographic and anatomical study after partial occlusion of the portal vein," Eur. Surg. Res., vol. 6, no. 3, pp. 183-195, Apr 1974.
[42] W. W. Lautt, "Regulatory processes interacting to maintain hepatic blood flow constancy: Vascular compliance, hepatic arterial buffer response, hepatorenal reflex, liver regeneration, escape from vasoconstriction," Hepatol. Res., vol. 37, no. 11, pp. 891-903, Nov 2007.
[43] D. R. Monbaliu, et al., "Flow competition between hepatic arterial and portal venous flow during hypothermic machine perfusion preservation of porcine livers," Int. J. Artif. Organs, vol. 35, no. 2, pp. 119-131, Feb 2012.
[44] S. Gaiani, et al., "Prevalence of spontaneous hepatofugal portal flow in liver cirrhosis. Clinical and endoscopic correlation in 228 patients,"
Gastroenterology, vol. 100, no. 1, pp. 160-167, Jan 1991.
[45] S. A. Gaskari, et al., "Therapy insight: cirrhotic cardiomyopathy," Nat.
Clin. Pract. Gastroenterol. Hepatol., vol. 3, no. 6, pp. 329-337, Jun
2006.
[46] N. McAvoy, et al., "Differential visceral blood flow in the hyperdynamic circulation of patients with liver cirrhosis," Aliment.
Pharmacol. Ther., vol. 43, no. 9, pp. 947-954, May 2016.
[47] S. Pant, et al., "Inverse problems in reduced order models of cardiovascular haemodynamics: aspects of data assimilation and heart rate variability," J R Soc Interface, vol. 14, no. 126, p. 20160513, Jan 2017.
[48] S. K. Venkatesh, et al., "Magnetic resonance elastography of liver: technique, analysis, and clinical applications," J. Magn. Reson.
Imaging, vol. 37, no. 3, pp. 544-555, Mar 2013.
[49] S. Hoehme, et al., "Prediction and validation of cell alignment along microvessels as order principle to restore tissue architecture in liver regeneration," Proc. Natl. Acad. Sci. U. S. A., vol. 107, no. 23, pp. 10371-10376, Jun 2010.
[50] A. R. Pries and T. W. Secomb, "Microvascular blood viscosity in vivo and the endothelial surface layer," Am. J. Physiol. Heart Circ. Physiol., vol. 289, no. 6, pp. H2657-H2664, Dec 2005.
[51] A. Monescillo, et al., "Influence of portal hypertension and its early decompression by TIPS placement on the outcome of variceal bleeding," Hepatology, vol. 40, no. 4, pp. 793-801, Oct 2004.
SUPPLEMENTARYMATERIALS TABLEIII
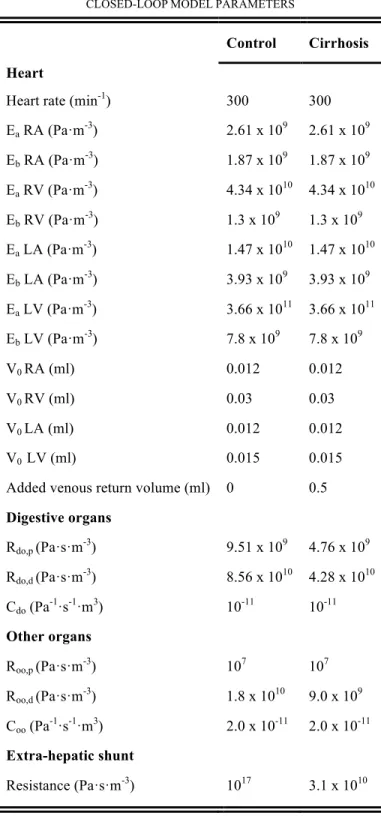
CLOSED-LOOPMODELPARAMETERS
Control Cirrhosis Heart
Heart rate (min-1) 300 300
Ea RA (Pa·m-3) 2.61 x 10⁹ 2.61 x 10⁹ Eb RA (Pa·m-3) 1.87 x 10⁹ 1.87 x 10⁹ Ea RV (Pa·m-3) 4.34 x 10¹⁰ 4.34 x 10¹⁰ Eb RV (Pa·m-3) 1.3 x 10⁹ 1.3 x 10⁹ Ea LA (Pa·m-3) 1.47 x 10¹⁰ 1.47 x 10¹⁰ Eb LA (Pa·m-3) 3.93 x 10⁹ 3.93 x 10⁹ Ea LV (Pa·m-3) 3.66 x 10¹¹ 3.66 x 10¹¹ Eb LV (Pa·m-3) 7.8 x 10⁹ 7.8 x 10⁹ V0 RA (ml) 0.012 0.012 V0 RV (ml) 0.03 0.03 V0 LA (ml) 0.012 0.012 V0 LV (ml) 0.015 0.015
Added venous return volume (ml) 0 0.5
Digestive organs Rdo,p (Pa·s·m-3) 9.51 x 10⁹ 4.76 x 10⁹ Rdo,d (Pa·s·m-3) 8.56 x 10¹⁰ 4.28 x 10¹⁰ Cdo (Pa-1·s-1·m3) 10-11 10-11 Other organs Roo,p (Pa·s·m-3) 107 107 Roo,d (Pa·s·m-3) 1.8 x 10¹⁰ 9.0 x 10⁹ Coo (Pa-1·s-1·m3) 2.0 x 10⁻¹¹ 2.0 x 10⁻¹¹ Extra-hepatic shunt Resistance (Pa·s·m-3) 1017 3.1 x 10¹⁰
Model parameters defining the circulation of rats in physiological conditions (control) and in the case of circulatory disorders (cirrhosis). Heart: the heart rate was used to define the duration of the ventricular and atrial contraction and the relaxation in the elastance function; Ea and Eb stand for the amplitude and baseline
of elastance function E(t) = Ea e(t) + Eb,, with e(t) a normalized time-varying function of the elastance [28, 29] for each cardiac chamber (right atrium (RA), right
ventricle (RV), left atrium (LA), left ventricle (LV) ); V0 denotes the unloaded volume of the heart chamber. Other organs and digestive organs are represented