LARGE-SCALE BIOLOGY ARTICLE
Frequent Gene Movement and Pseudogene Evolution Is
Common to the Large and Complex Genomes of Wheat,
Barley, and Their Relatives
W OAThomas Wicker,
aKlaus F.X. Mayer,
bHeidrun Gundlach,
bMihaela Martis,
bBurkhard Steuernagel,
cUwe Scholz,
cHana Sˇimkova´,
dMarie Kubala´kova´,
dFre´de´ric Choulet,
eStefan Taudien,
fMatthias Platzer,
fCatherine Feuillet,
eTzion Fahima,
gHikmet Budak,
hJaroslav Dolezˇel,
dBeat Keller,
aand Nils Stein
c,1aInstitute of Plant Biology, University of Zurich, CH-8008 Zurich, Switzerland
bMunich Information Center for Protein Sequences/Institute for Bioinformatics and Systems Biology, Helmholtz Center Munich, 85764 Neuherberg, Germany
cLeibniz Institute of Plant Genetics and Crop Plant Research, D-06466 Gatersleben, Germany
dCentre of the Region Hana´ for Biotechnological and Agricultural Research, Institute of Experimental Botany, 77200 Olomouc, Czech Republic
eInstitut National de la Recherche Agronomique University Blaise Pascal Joint Research Unit 1095, Genetics, Diversity, and Ecophysiology of Cereals, 63100 Clermont-Ferrand, France
fLeibniz Institute for Age Research–Fritz Lipmann Institute, 07745 Jena, Germany gInstitute of Evolution, University of Haifa, Mount Carmel, Haifa 31905, Israel
hSabanci University, Faculty of Engineering and Natural Sciences, Orhanli, Tuzla, 34956 Istanbul, Turkey
All six arms of the group 1 chromosomes of hexaploid wheat (Triticum aestivum) were sequenced with Roche/454 to 1.3- to 2.2-fold coverage and compared with similar data sets from the homoeologous chromosome 1H of barley (Hordeum vulgare). Six to ten thousand gene sequences were sampled per chromosome. These were classified into genes that have their closest homologs in the Triticeae group 1 syntenic region in Brachypodium, rice (Oryza sativa), and/or sorghum (Sorghum bicolor) and genes that have their homologs elsewhere in these model grass genomes. Although the number of syntenic genes was similar between the homologous groups, the amount of nonsyntenic genes was found to be extremely diverse between wheat and barley and even between wheat subgenomes. Besides a small core group of genes that are nonsyntenic in other grasses but conserved among Triticeae, we found thousands of genic sequences that are specific to chromosomes of one single species or subgenome. By examining in detail 50 genes from chromosome 1H for which BAC sequences were available, we found that many represent pseudogenes that resulted from transposable element activity and double-strand break repair. Thus, Triticeae seem to accumulate nonsyntenic genes frequently. Since many of them are likely to be pseudogenes, total gene numbers in Triticeae are prone to pronounced overestimates.
INTRODUCTION
The Triticeae tribe contains some of the world’s most important crop species, including wheat (Triticum aestivum) and barley (Hordeum vulgare). Despite their economic importance, neither crop’s genome has been completely sequenced so far, mainly for two reasons: first, the haploid genome size of most Triticeae species is larger than 5500 Mbp, almost twice the size of the human genome (Bennett and Smith, 1976). Second, the ge-nomes of Triticeae contain at least 80% repetitive DNA.
Further-more, bread wheat is a hexaploid that arose from hybridizations of three diploid ancestor species. The first hybridization event occurred probably more than one million years ago (Feldman et al., 1995) and combined the genomes of Triticum urartu (hereafter referred to as the A genome) with a not yet identified close relative of Aegilops speltoides (B genome). The resulting tetraploid Triticum turgidum (genome formula AABB) hybridized only
;
10,000 years ago with the donor of the D genome,Aegilops tauschii, resulting in hexaploid wheat T. aestivum
(ge-nome formula AABBDD; Feldman et al., 1995).
In the absence of a complete genome sequence, gene content and gene order of Triticeae genomes have largely been inferred from comparison with the completely sequenced model grass genomes of rice (Oryza sativa; International Rice Genome Se-quencing Project, 2005), sorghum (Sorghum bicolor; Paterson et al., 2009) and Brachypodium (International Brachypodium Initiative, 2010). Although Brachypodium has a small genome of 273 Mbp, it is the closest relative of the Triticeae, from which it
1Address correspondence to stein@ipk-gatersleben.de.
The author responsible for distribution of materials integral to the findings presented in this article in accordance with the policy described in the Instructions for Authors (www.plantcell.org) is: Nils Stein (stein@ipk-gatersleben.de).
WOnline version contains Web-only data.
OAOpen Access articles can be viewed online without a subscription.
www.plantcell.org/cgi/doi/10.1105/tpc.111.086629
diverged
;
25 to 30 million years ago (Bossolini et al., 2007; International Brachypodium Initiative, 2010). Brachypodium and rice diverged;
40 million years ago, while sorghum diverged from the two others;
50 million years ago (International Brac-hypodium Initiative, 2010). Recent studies indicate that up to 80% of genes are in conserved syntenic positions betweenBrachypodium and rice (International Brachypodium Initiative,
2010; Wicker et al., 2010). Considering that Triticeae are more closely related to Brachypodium than any of the other two grasses, one would therefore expect more than 80% of all genes to be syntenic between Brachypodium and wheat. However, Luo et al. (2009) reported a lower than expected number of syntenic genes between Ae. tauschii and rice and sorghum.
In recent years, chromosome sorting using flow cytometry (Vra´na et al., 2000) has allowed the targeted isolation of single chromosomes and single chromosome arms from the Triticeae (Kubala´kova´ et al., 2002). This drastically reduced the complexity and costs of investigating the composition of Triticeae genomes, allowing a divide-and-conquer approach (Dolezˇel et al., 2007). Recently, chromosome 1H and subsequently all chromosomes of barley were sample sequenced by Roche/454 technology (Mayer et al., 2009, 2011). Although far from yielding a complete genomic sequence, the sequences sampled probably more than 95% of all barley genes (Mayer et al., 2011). Compilation of synteny information from the genomes of rice (International Rice Genome Sequencing Project, 2005), sorghum (Paterson et al., 2009), and Brachypodium (International Brachypodium Initiative, 2010) allowed the deduction of a hypothetical gene order (i.e., genes found in syntenic regions of any of the other three ge-nomes were assumed to have the same order as in the respec-tive reference genomes).
The total number of genes in a genome is difficult to determine precisely. Numbers are usually obscured by annotation artifacts (Bennetzen et al., 2004) or the presence of genes and gene fragments that were moved and duplicated by transposable elements (TEs; Jiang et al., 2004; Lai et al., 2005; Morgante et al., 2005; Paterson et al., 2009) or through double-strand break (DSB) repair (Wicker et al., 2010). Nevertheless, for genomes that have been sequenced to near completion, a consensus has begun to emerge that they probably contain roughly 26,000 genes (Paterson et al., 2009; International Brachypodium Initia-tive, 2010; www.Arabidopsis.org). For example, the recently published maize (Zea mays) genome, despite its large size of 2500 Mbp, has only a slightly higher estimated gene number of 30,000. By contrast, estimates for gene numbers in wheat and barley vary: sequencing of megabase-scale contigs from wheat chromosome 3B (Choulet et al., 2010) suggested a diploid gene number between 38,000 and 50,000, while a minimum of 32,000 genes was recently proposed for barley based on 454 sequenc-ing of sorted chromosomes (Mayer et al., 2011).
Analysis of wheat chromosome 3B (Choulet et al., 2010) showed that most genes that were expected based on synteny to Brachypodium, rice, and sorghum were indeed present. However, these syntenic genes were interspersed with numer-ous nonsyntenic genes that had their closest homologs else-where in the model genomes, outside the 3B syntenic region. This study raised the question whether Triticeae genomes are indeed exceptional in their high gene content. Since the number
of genes that are syntenic between Triticeae and the three model genomes was in the expected range, it is of particular importance to investigate the origin of the numerous nonsyntenic genes since these mainly account for the high gene number estimated for Triticeae species.
For this study, we sequenced flow-sorted Triticeae group 1 chromosomes and chromosome arms with Roche/454 tech-nology to 1.33 to 2.23 coverage. The data allowed us to estimate the number of genes that are syntenic and nonsyntenic between Triticeae and Brachypodium, rice, and sorghum. The number of genes that are syntenic between Triticeae and the model grasses is
;
83%, as expected. Our particular focus, however, was on the very high numbers of genes that had their closest homologs outside the Triticeae group 1 syntenic region in the model grass genomes. Surprisingly, the majority of these genes were not even conserved between barley and wheat or between wheat subgenomes. We found evidence that many of them are pseudogenes originating from TE-driven gene move-ment and DSB repair. Our data indicate that these processes contribute to the rapid divergence of Triticeae genomes by generating thousands of pseudogenes, which can distort gene number estimates considerably.RESULTS
Chromosome Sorting and Sequencing
The short and long arms of chromosomes 1A, 1B, and 1D were isolated by flow cytometric sorting from double ditelosomic lines of wheat cv Chinese Spring. These wheat lines contain two complementary chromosome deletions (for example, one copy of chromosome 1A, which lacks the short arm, and one copy of chromosome 1A, which lacks the long arm). Therefore, the use of these lines permitted simultaneous sorting of short and long arms from the same sample. To collect the equivalent of
;
20 ng DNA, between 19,000 (1AL fraction) and 44,000 (1DS fraction) telosomes were sorted, depending on their molecular size (Table 1). Contamination of sorted fractions by random mixtures of other chromosomes and chromosome fragments, as determined by fluorescence in situ hybridization (FISH), ranged from 6% (1AS fraction) to 10% (1BL fraction). Since the isolation of high numbers of chromosomes providing sufficient DNA quantities for direct 454 sequencing is very time-consuming and laborious and was beyond the capacity of the involved laboratories, DNA of sorted telosomes was purified and amplified via multiple dis-placement amplification (MDA). The yields of individual amplifi-cation reactions ranged from 1.8mg (1BL fraction) to 5.3 mg (1BS fraction).The amplified DNA samples from the sorted chromosome arms were sequenced with Roche/454 Titanium technology to 1.3- to 2.2-fold coverage, with chromosome arm 1BS having the highest and 1DL the lowest coverage (Table 1). For additional comparative analysis within the Triticeae tribe, we had available previously published Roche/454 sequence data sets from barley chromosome 1H (Table 1; Mayer et al., 2009, 2011). While all arms of barley chromosomes 2H to 7H can be sorted from wheat-barley telosome addition lines (Sucha´nkova´ et al., 2006),
only the short arm of 1H is accessible as cytogenetic stock due to the sterility of telosomic addition for 1HL (Islam and Shepherd, 2000). Therefore, data sets were only produced for the entire chromosome 1H.
Identification of Putative Gene-Containing 454 Reads For gene identification, we used all individual 454 reads as queries in sequence comparisons (BLASTN) against the gene set from Brachypodium distachyon (International Brachypodium Ini-tiative, 2010) since Brachypodium represents the closest relative to the Triticeae that has been completely sequenced. To mini-mize potential artifacts, we used a set of Brachypodium genes (20,468 out of 25,532) that has also DNA homology support from both sorghum and rice. This reduces the number of false pos-itives caused by annotation artifacts or TE sequences and renders the gene number estimates more conservative.
MDA of sorted chromosomes has been shown to introduce a bias in the representation of individual amplified region (Pinard et al., 2006). In addition, uneven sequence coverage can also be caused by the emulsion PCR during Roche/454 sequencing. Such distortions in the representation of sequences can be recognized as regions where multiple 454 reads cover the exact same region of a gene and their removal is a crucial step in the
identification of putative nonsyntenic genes (see Methods). After compensating for this bias, there were between 8423 (for 1AS) and 21,968 (for 1BL) 454 reads with homology to Brachypodium genes left (Table 2). In the data set for barley chromosome 1H, we identified 39,892 reads with homology to genes (Table 2). When multiple 454 reads covered the same gene, they were assembled into a partial gene sequence. The total number of genes sampled in the wheat group 1 data sets ranged from 1899 (1AS) to 4442 (1AL) genes. The data set for barley chromosome 1H sampled 5951 genes (Table 2).
The Double Ditelosomic Line 1D Contains a Highly Rearranged Chromosome 1D
Gene sequences were mapped to the Brachypodium genome. As expected, many mapped to the Triticeae group 1 syntenic regions on Brachypodium chromosomes 2 and 3 (Figure 1A). This was the case for all three data sets from the long arm of wheat group 1 chromosomes as well as for the short arms of 1A and 1B data sets, respectively.
In contrast with 1AS and 1BS, the data set for chromosome arm 1DS contained genes that mapped to both the 1S and 1L syntenic region in Brachypodium. To exclude the possibility that the wheat variety Chinese Spring, which was used for the Table 1. 454 Data Sets for Wheat Group 1 Chromosome Arms
Name Size (Mbp)a Reads Average Read Length (bp) Total Mb Coverage
1AS 275a 945,890 409 387 1.4 1BS 314a 1,698,313 411 698 2.2 1DS 224a 1,142,457 381 435 1.9 1AL 523a 1,972,212 394 777 1.5 1BL 535a 2,067,359 400 827 1.5 1DL 381a 1,345,317 379 510 1.3 1Hb 622c 4,705,710 291 1,369 2.2
Reads were quality trimmed and selected for sizes >100 bp.
aChromosome sizes were estimated based on relative chromosome lengths determined by Gill et al. (1991), 4C nuclear DNA content 69.27 pg DNA
(Bennett and Smith, 1976), and considering 1 pg DNA = 978 Mbp (Dolezˇel et al., 2003).
b454 Titanium reads combined with previously published GSFLX data set (Mayer et al., 2009).
cChromosome size was estimated based on relative 1H chromosome length determined by Marthe and Ku¨nzel (1994), 2C nuclear DNA content 10.43
pg DNA, and considering 1 pg DNA = 978 Mbp (Dolezˇel et al., 2003, 2004).
Table 2. Number of 454 Reads with Homology to Genes and Total Numbers of Genes Sampled in the Data Sets
Chromosome Gene Readsa NR Readsb Genes Sampledc Contaminationsd
1AS 13,692 8,423 2,162 817 (9.7%) 1BS 29,295 18,722 4,604 1,894 (10.1%) 1AL 30,463 21,178 5,024 1,557 (7.4%) 1BL 32,722 21,968 5,263 1,579 (7.2%) 1DL 25,652 19,139 4,606 1,428 (7.5%) 1H 62,601 39,892 4,346 1,604 (4.0%) NR, nonredundant.
aTotal number of 454 reads with homology to genes.
bTotal number of gene reads after removal of amplification artifacts. cTotal number of different genes sampled.
dGene reads that were classified as contaminants from other chromosomes. The fraction of the total number of gene reads is in parentheses.
production of the ditelosomic lines already contained a rear-ranged 1DS chromosome arm, we tested all ESTs that had been mapped to deletion bins on chromosome 1DS (Peng et al., 2004). We found that ESTs mapped to the proximal parts of 1DS were absent from our data set. This indicated that the cytogenetic stock used for chromosome sorting actually contains a strongly rearranged telosome and that it does not contain the complete 1DS arm. Instead, the chromosome seems to be a product of complex rearrangement of several fragments of chromosome 1D. Mapping the 454 reads of the 1DS data set to the
Brachypo-dium genome showed that apparently both telomeric ends of 1D
as well as some interstitial regions are present (Figure 1B). The pattern suggests that the centromeric and pericentromeric part and at least two more interstitial regions of 1D were eliminated. Thus, the 1DS data set could not be used for comparative analyses of the three subgenome chromosome arms.
Identification of Triticeae Genes That Are Syntenic in Brachypodium, Rice, and Sorghum
The genes sampled in the 454 data sets were classified into three categories: (1) genes that have their closest homologs in the Triticeae group 1 syntenic regions in Brachypodium, rice, and/or sorghum, (2) genes that have their closest homologs outside those regions, and (3) contaminations from other chromosomes as the result of the flow sorting process. To obtain a data set of the genes we expect to find on Triticeae group 1 chromosomes, we created reference data sets that contain all the 1744
Brachy-podium genes from the 1L syntenic region and the 600 genes
from the 1S syntenic region (see Methods). To account for genes that might have been moved out of this region in Brachypodium, we added those Brachypodium genes whose homologs are located in the group 1 syntenic region in both rice and sorghum. The final reference data sets of the 1L syntenic region contained 1875 genes, while the one for 1S contained 644 genes. For identification of syntenic genes in barley, we combined the data sets for 1S and 1L into one data set.
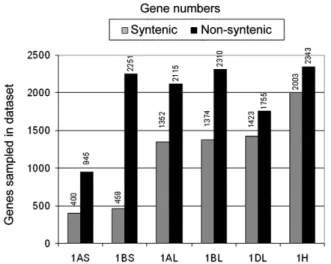
If a gene from the group 1 sequences had its closest homolog in this reference data set, we postulated that this gene is located in the same position as its homologs from Brachypodium, rice, and/or sorghum (i.e., the gene was considered syntenic between Triticeae and the three model genomes). For the long arm of group 1 chromosomes, the numbers of genes that were classi-fied as syntenic in the three model genomes were very similar with 1352, 1374, and 1423 for 1AL, 1BL, and 1DL, respectively (Figure 2). Thus, we found
;
72 to 76% of the genes contained in the 1L reference data set also in our 454 sequences. The numbers for 1AS and 1BS ranged between 400 and 459 genes, respectively (Figure 2), representing 62 and 72% of the genes in the 1S reference set.Barley chromosome 1H contained homologs of 2003 genes present in the group 1 reference data sets, which is consistent with previous findings (Mayer et al., 2009, 2011). This number is higher than the 1752 and 1833 genes from the combined data sets of the long and short arms of chromosomes 1A and 1B, respectively (Figure 2). This may at least in part be explained by the higher sequence coverage of chromosome 1H. Alternatively, it could also reflect a differential gene loss (for example, during diploidization) that has occurred in the A and B genomes due to genomic redundancy in the hexaploid wheat.
Group 1 Chromosomes Share Many of the Genes That Are Syntenic in Brachypodium, Rice, and Sorghum
To estimate differences in gene content between wheat subge-nomes and between wheat and barley, we compared the lists of all
Brachypodium homologs that were represented in the individual
data sets. This was done to circumvent the fact that most genes are not completely covered by 454 reads (e.g., it is possible that a gene’s 59 half is covered in one data set, while its 39 half is covered in the other, but the sequences from the two data sets do not overlap). Thus, if the same Brachypodium gene had homologs in two data sets, we assumed that this gene was conserved between the two homologous chromosomes. However, cases where mul-tiple copies of genes with the same Brachypodium homolog may Figure 1. Mapping of Gene-Containing 454 Reads to the Brachypodium
Genome.
The five Brachypodium chromosomes are labeled Bd1 through Bd5. (A) The 454 data sets for chromosome arms 1BL and 1BS were mapped separately. The heat map indicates that the vast majority of gene reads map to the regions on Bd2 and Bd3, which are syntenic to group 1 chromosomes from Triticeae.
(B) Mapping of 454 reads from the 1DS data set reveals that the double ditelosomic line used apparently contains a highly rearranged chromosome that is composed of several fragments of the original 1D chromosome.
exist cannot be distinguished. When we combined the data sets from the long and short arms of chromosome 1A and 1B for the wheat-barley comparison, we therefore counted those genes that had copies on both chromosome arms only once (see below).
We first compared the data sets of genes from wheat chro-mosomes 1AL, 1BL, and 1DL that have homologs in the Triticeae group 1L syntenic region of Brachypodium, rice, and/or sor-ghum. The majority of the genes (1113) were found in all three data sets (Figure 3A), corresponding to 78 to 82% of all genes that were present in the data sets. Only 40 to 72 (2 to 5%) of the genes were represented in only one of the data sets, while 122 to 183 (9 to 13%) were common to two data sets (Figure 3A). Considering that at sequence coverage of 1.33 to 1.53, we sampled
;
84 to 88% of all genes (see Supplemental Figure 1 online; see below), these data indicate that the set of genes that have their homologs in the Triticeae group 1L syntenic region in the model grass genomes is highly conserved in all three wheat subgenomes.Since barley chromosome-directed sequence analysis used sampled complete barley 1H chromosomes rather than individ-ual chromosome arms, the data are not directly comparable with the wheat data sets. We therefore combined the data sets from the long and short arms of chromosomes 1A and 1B into whole-chromosome data sets (Figures 3C and 3D). The comparisons of the wheat 1A and 1B data sets with barley 1H very much reflect the situation that was found between the wheat subgenomes: the set of genes with their closest homologs in the group 1 syntenic region in Brachypodium, rice, and/or sorghum are highly con-served with 1514 genes (76 to 87%) being common to 1H, 1A, and 1B (Figure 3C). Only between 41 and 139 genes were found in only a single data set.
Triticeae Group 1 Chromosomes Contain Large and Highly Diverse Sets of Genes That Are Not Syntenic with
Brachypodium, Rice, and Sorghum
All sorted chromosome data sets contained high numbers of genes that had their closest homologs outside the Triticeae group 1 syntenic region in the three model genomes (Figure 2). We used stringent criteria to distinguish true nonsyntenic genes from con-taminations that stem from flow sorting: We accepted only those genes that are covered by multiple independent 454 reads or are present in more than one data set (e.g., when a gene from the 1AL and 1BL data sets had the same Brachypodium gene as closest homolog; see also Methods). Thus, the estimates for nonsyntenic genes can be considered minimum numbers.
In the data sets for wheat chromosome arms 1AL, 1BL, and 1DL, we discovered 2115, 2310, and 1755 genes that map to nonsyntenic regions in the three model genomes, respectively. Surprisingly, in the 1AS data set, we found 945 putative non-syntenic genes, more than twice the number of genes that are syntenic (Figure 2). The most extreme was wheat chromosome arm 1BS, where we identified 2251 putative nonsyntenic genes, more than 5 times the number of syntenic genes (Figure 2).
Interestingly, 247 pairs of nonsyntenic genes (gene pairs with one copy from 1AL and one from 1AS, respectively) had the same closest homolog in Brachypodium. This suggests that both the long and the short arm of chromosome 1A contain copies from genes that originate from a nonsyntenic donor region elsewhere in the genome. The situation is even more pronounced for chromosome 1B, where 545 different genes from the long and the short arm have the same closest homolog in Brachypodium. To identify putative nonsyntenic genes in barley chromosome 1H, we took an approach analogous to the one for wheat except that we also accepted those genes that were hit by only one 454 read but were present in one or both of the combined 1A or 1B data sets from wheat (e.g., genes from 1H that have the same closest Brachypodium homologs as genes found in the 1A or 1B data sets). In total, we identified 2343 putative nonsyntenic genes. Since barley sequences were not allocated to the chromosome arms, it was not possible to select cases where multiple indepen-dent copies of the same nonsyntenic gene were present on both chromosome arms. Thus, in such cases, the 454 reads covering different copies were collapsed and assigned to one single gene. In contrast with the syntenic genes (see above), the sets of those genes that have their closest homologs outside the group 1L syntenic region in the model genomes are highly diverse between wheat subgenomes. The data sets for the long arms of wheat group 1 chromosomes contain between 1759 and 2309 Brachypodium homologs (Figure 3B). In total, they contain 4068 different
Brachy-podium genes. Only 558 of them are present in all three data sets,
corresponding to 24 to 32% of genes represented in the individual data sets (Figure 3B). Between 33 and 45% of gene sequences were found in only one subgenome data set (Figure 3B). Similarly, the data sets also show pronounced differences between wheat and barley: Only 761 Brachypodium homologs were represented in all three, the 1H, 1A, and 1B data sets. Particularly striking is the high number of 1976 genes that were found exclusively in wheat chromosome 1B. This is due to the enormous number of non-syntenic genes on the short arm of chromosome 1B (Figure 2). Figure 2. Numbers of Genes Sampled in 454 Sequences from
Flow-Sorted Chromosomes.
Wheat data sets represent short and long arms of chromosomes, while barley (1H) represents the entire chromosome. The gray bars (syntenic genes) indicate the number of genes that have their closest homolog in the synthetic region in Brachypodium, rice, and/or sorghum. The black bars indicate the number of genes with their homologs outside the syntenic region.
The Groups of Genes That Differ Most between Triticeae Have Characteristics of Pseudogenes
The finding that genes that are nonsyntenic between Triticeae and the three model grasses are also less conserved within the Triticeae is intriguing. We hypothesized that many, if not the majority, of these genes are pseudogenes, which are nonfunc-tional copies of genes elsewhere in the genome, and tested them for characteristics of pseudogenes. A recent study showed that pseudogenes in Arabidopsis are on average shorter and less likely to be expressed than functional genes (Yang et al., 2011). Genic sequences that were captured by TEs or duplicated during DSB repair are often only fragments (Jiang et al., 2004; Paterson et al., 2009; Wicker et al., 2010). Therefore, we inves-tigated what fractions of individual genes were covered by 454 reads. Triticeae genes that have their closest homologs outside the group 1L syntenic region in the model genomes are covered on average 33% of their entire length by 454 reads. Only 7.1% had both their ends covered. This is in contrast with genes mapping to the group 1 syntenic region in the model grasses, which are covered on average 75% of their entire length, and 27% of them have both ends covered by 454 reads. This
indicates that many of the nonsyntenic genes are not present as full copies but as 59 or 39 fragments.
We also argue that pseudogenes are less likely to be expressed and therefore should have fewer perfect matches in EST data-bases. This is under the assumption that for many of these genes, the duplication from elsewhere in the genome dates back perhaps hundreds of thousands or even millions of years.. During this time, the duplicated sequences accumulated mutations that distin-guish them from their functional originals and therefore can be distinguished by sequence divergence from the functional copy.
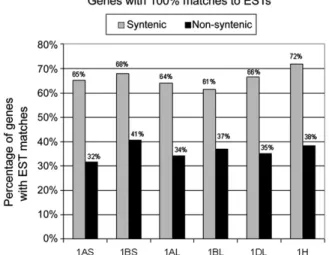
All gene sequences were used for BLASTN searches against wheat and barley EST databases. Sequence alignments had to contain a stretch of 100 identical bases. We found that 61 to 72% of genes that map to the group 1 syntenic regions in
Brachypo-dium, rice, and sorghum putative syntenic genes had matches to
ESTs, while only 32 to 41% of genes that are nonsyntenic between Triticeae and the model grasses had EST matches (Figure 4). Evidence for TE-Driven Pseudogene Formation
Our previous studies have shown that duplications of DNA fragments to different locations in the genome are often the Figure 3. Comparison of Gene Sets from Flow-Sorted Chromosomes from Wheat and Barley.
(A) and (B) Comparison of genes in the 1AL, 1BL, and 1DL data sets.
(A) Genes that have their closest homologs in the Triticeae group 1 syntenic region in Brachypodium, rice, and/or sorghum.
(B) Genes that have their closest homologs outside the 1L syntenic region in Brachypodium, rice, and/or sorghum. Note that the number of genes unique to one data set is much higher for the nonsyntenic genes.
(C) and (D) Comparison of gene numbers from wheat chromosomes 1A and 1B chromosome and 1H from barley. (C) Putative syntenic genes.
(D) Putative nonsyntenic genes. Note that the number of genes unique to one single data set is much higher for the nonsyntenic genes.
result of DSB repair (Wicker et al., 2010) whereby a copy of the foreign DNA is used as filler to repair the break (for reviews on the mechanisms, see Nassif et al., 1994; Puchta, 2005). Additionally, gene fragments are often captured by TEs and moved to a new location (Jiang et al., 2004; Lai et al., 2005; Morgante et al., 2005; Paterson et al., 2009). To test whether some of the nonsyn-tenic genes may be the result of DSB repair or TE capture, we compared the genomic regions that contain the original genes with those that contain putative duplicates. We used a database of over 2000 barley BAC clones that were sequenced to phase 1 level (i.e., unordered, gapped sequence contigs). This data-base was searched with all putative nonsyntenic barley genes to identify genes that hit exactly two BAC clones (i.e., possibly represent a single duplication event). The gene that is identical or most similar (tolerating 97% identity to account for sequencing errors) to the one in the 454 data set is most likely the copy that is located on chromosome 1H. Consequently, the gene on the other BAC probably originates from elsewhere in the genome.
A total of 157 nonsyntenic genes hit exactly two BAC clones. Not surprisingly, 51 of them were simply pairs of overlapping BAC clones where the respective gene was located in the overlapping region. From the remaining 106 pairs of BACs, we analyzed 50 in detail.
In 33 pairs of BAC clones, one BAC clearly corresponded to the sequence from 1H. In all these BAC pairs, we were able to identify distinct fragments that contain the gene and potential pseudogene sequence conserved between the two BACs. The size of these duplicated fragments ranged from <75 bp to >13 kb. In 12 cases, the gene copy from 1H was clearly a pseudogene (e.g., only a gene fragment or containing frame shifts and stop codons), while the copy on the other BAC appeared to be intact. The inverse case was found only three times. In 16 cases, both copies were likely to be pseudogenes, and in only two cases both genes appeared to be intact (see Supplemental Table 1 online).
We compared the corresponding BAC sequences in detail to determine the precise border of the duplicated region and possibly identify adjacent TE sequences or other diagnostic motifs that might explain the gene movement. In three cases, the duplicated fragment was directly adjacent to a TE, indicating that the insertion of the TE has caused a DSB, which was then repaired with a filler DNA that contained the gene or parts of it. The example of gene HoVul_1H_05012_UZH shows that a frag-ment of
;
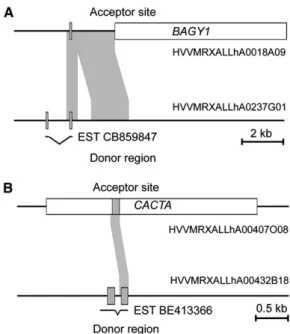
2.5 kb was duplicated. It contains one exon of the duplicated gene, while the donor region still contains the com-plete gene with two exons. One EST was identified that covers both exons of the gene at the donor site (Figure 5A). The duplicated fragment is immediately adjacent to an RLG_BAGY1 retrotransposon. We postulate that the insertion of the RLG_BAGY1 has caused a DSB on one side of the element (Figure 5A).
In the case of HoVul_1H_05448_UZH, the duplication is the result of TE-driven gene capture. As shown in Figure 5B, a fragment of the gene comprising one exon plus some adjacent intron sequences was apparently captured by a CACTA trans-poson and moved to its current location on chromosome 1H. We found four additional cases where both copies of genes were located inside a TE, indicating that the TE had proliferated after the gene capture. In one case (HoVul_1H_05625_UZH), the 1H copy was only a fragment of the 39 end of the gene and it did not contain any introns, while the copy on the BAC from outside 1H was complete and contained several introns. This strongly suggests that HoVul_1H_05625_UZH is a pseudogene that originated from reverse transcription of an mRNA. For 12 BAC pairs, the available sequence of one or both BACs was too fragmented to allow conclusions, while five BAC pairs were false positives because the gene we had assembled from the 454 reads was a hybrid of two different genes with the same closest homolog in Brachypodium, which were present on either one of the two BACs (e.g., one 454 read covering the 59 region of the gene and another covering 454 read covered the 39 region were wrongly connected into one hybrid).
Deduction of a Core Set of Genes That Are Syntenic among Triticeae but Nonsyntenic between Triticeae and
Other Grasses
As described above, most of the genes that have their homologs outside the group 1 syntenic region in the model genomes are specific to only one of the species or subgenomes. Only a small subset is found in all wheat subgenomes and in barley.
We hypothesized that most of these conserved genes are indeed functional. These would be those genes that were trans-located to chromosome 1 in the common Triticeae ancestor and remained functional (or gained a new function) and thus were conserved. We hereafter refer to this group as group 1–specific genes. They include the 761 genes that have their closest
Brachypodium homologs outside of the group 1 syntenic region
but are found to be common to the 1H, 1A, and 1B data sets. They differ from nonfunctional gene fragments, which arise periodically over time and get removed again from the genome. The second group may mainly comprise those genes that are present in only one of the chromosome data sets (here referred to as group 1 pseudogenes).
Figure 4. Number of Genes with 100% Matches of Longer Than 100 bp in EST Databases.
In all data sets, the putative nonsyntenic genes have much fewer matches to ESTs. Wheat genes were used in BLAST searches against wheat ESTs, and barley genes were searched against barley ESTs.
We compared the group 1–specific genes and the putative group 1 pseudogenes against EST data sets using the same criteria as described above. Indeed, the group 1–specific genes had in all three data sets (1H, 1A, and 1B) the most perfect matches to ESTs (Figure 6). The results were most pronounced for the barley genes, where 53% of the group 1–specific genes had EST matches. By contrast, only 30% of the genes that were found exclusively in the barley data set had matches to ESTs. The values were similar for genes that were found only in two data sets (1H+1A or 1H+1B; Figure 6). The results were analo-gous, although less clear for 1A and 1B).
We also found that 15.7% of the group 1–specific genes have both their ends covered by 454 reads compared with only 2.7% of the putative group 1 pseudogenes. This indicates that a much larger portion of the group 1–specific genes is present as full-length genes.
Estimation of Total Gene Numbers Based on Sequence Coverage Data
Having five large data sets, we wanted to study the influence of sequence coverage on the number of genes that are sampled
and whether the true number of genes can be extrapolated from that data. We used different sized portions of the 454 data sets and counted how many genes are sampled in different sized data sets. Based on the estimated coverage provided by the 454 reads (Table 1), the data sets were broken down to represent a series of sequence coverages starting at 0.1-fold and increasing in steps of 0.1. Figure 6 shows the relationship of coverage to the number of sampled genes. For all data sets, we compared the complete gene data set with the data set of putative syntenic genes. The number of genes sampled follows, as expected, a saturation curve with the saturation value being the hypothetical total number of genes on the respective chromosome arm.
The saturation curves are very similar for the data sets from 1AL, 1BL, and 1DL (see Supplemental Figure 1A online) for both the putative syntenic genes as well as the total number of genes. The total number of syntenic genes extrapolated from the data is in a narrow range of 1609 to 1648, while the extrapolated total gene numbers vary a bit more from 4139 for 1DL to 4794 for 1AL (see Supplemental Figure 1A online).
Again, the results for the short arms 1AS and 1BS differed quite strongly (see Supplemental Figure 1B online): While the extrap-olated number of syntenic genes is only
;
10% higher in the 1BS data set than in the 1AS data set (496 versus 456), the total number of genes is more than twice as high in 1BS than in 1AS (3664 versus 1917). This indicates that 1BS has undergone an extreme accumulation of nonsyntenic genes. Interestingly, this apparently did not happen on the long arm of chromosome 1B. For barley chromosome 1H, the overall picture is very similar to that of the long arm of wheat chromosome 1. The extrapolated total number of genes is;
2- to 2.5-fold higher than the number of syntenic genes (see Supplemental Figure 1C online). The extrap-olated number of 2210 putative syntenic genes is slightly higher Figure 5. Examples for Gene Movement and Origin of NonsyntenicGenes.
The acceptor sites are located on chromosome 1H of barley. The donor sites are in unknown locations elsewhere in the genome. Exons of genes are depicted as gray boxes and TEs as white boxes. EST matches are indicated underneath the maps with exons connected with bent lines. (A) The insertion of a BAGY1 retrotransposon presumably caused a DSB, which was repaired with a copy of a fragment from the donor region containing the homolog of Bradi1g00850. The result is the duplicated fragment immediately adjacent to the BAGY1 element. Subsequently, an additional deletion in the duplicated region occurred in the acceptor site. (B) A gene fragment containing one exon of the Bradi1g51650 homolog and small fragments of the adjacent introns was captured by a CACTA transposon and moved to chromosome 1H.
Figure 6. Comparison of Triticeae Group 1–Specific Genes with Putative Pseudogenes Located on Group 1 Chromosomes.
Group 1–specific genes are those that are nonsyntenic between Triticeae and other grasses but are found in all group 1 data sets (1H, 1A, and 1B). The y axis indicates the percentage of genes that have matches to Triticeae ESTs. For each data set, we distinguished four groups: those genes that are found in all three data sets, those found in only two (e.g., 1H+1A), and those that are specific for one chromosome.
than in the combined 1A and 1B data sets (2065 and 2104, respectively).
Most data sets (except 1BS and 1H) provided 1.33 to 1.53 coverage. Based on the above calculations, we sampled 84 to 88% of the syntenic genes. For 1BS and 1H, which were covered
;
2.2-fold, we estimate that we sampled 91 to 93% of the syntenic genes. The percentage of total (nonsyntenic plus syn-tenic) genes sampled in all data sets is somewhat lower (72 to 84%). It is possible that this lower number is a result of the stringent criteria we used to distinguish putative nonsyntenic genes from contaminations.We were also interested in whether the extrapolated number of genes would differ if the estimates of the physical size (Table 1) and the corresponding sequence coverage had been inaccurate. Therefore, we ran a series of calculations for the 1AL, 1BL, and 1DL data set assuming that the coverage would range from 1.03 to 2.03 (see Supplemental Figure 2 online). In the example of 1AL, this would correspond to physical chromosome sizes ranging from 394 to 788 Mbp. Interestingly, the number of extrapolated genes varied only by
;
3.5%. For a physical size of 394 Mbp, the extrapolated gene number was 1770, while for 782 Mbp, it was 1831 (see Supplemental Figure 2 online). Thus, inaccuracies in the physical size estimates only have a minimal effect on the estimated gene numbers.DISCUSSION
Our data indicate that all three wheat subgenomes, as well as barley, contain very similar sets of genes that are syntenic with the model grasses. This is consistent with many previous studies that found very good colinearity of genetic markers between Triticeae and other grasses (Gale and Devos, 1998; Bossolini et al., 2007; Salse et al. 2008). The Triticeae chromosome 1 syntenic region in
Brachypodium contains 2269 genes with homologs in rice and
sorghum. Our previous study showed that
;
83% of them are found in syntenic positions in rice (Wicker et al., 2010). AsBrachypodium is more closely related to Triticeae than to rice,
one would expect more than 83% (i.e., >1900) of the genes to be syntenic. Considering that we sampled
;
84% (for 1A) to 93% (for 1H) of all genes and that these also include genes that have homologs in the group 1 syntenic region in rice or sorghum (but notBrachypodium), the observed numbers, 1752, 1833, and 2003 for
1A, 1B, and 1H, respectively, fit the expectations very well. However, the most intriguing finding of this study was that genic sequences that have their homologs outside the group1 syntenic region in the model grass genomes by far outnumbered the syntenic ones, although they contribute only
;
20 to 30% in comparative analyses of other grasses (Paterson et al., 2009; International Brachypodium Initiative, 2010; Wicker et al., 2010). Therefore, our main interest was to further explore the nature of the nonsyntenic genes. Since they cause overestimation of gene counts projected from the study of individual chromosomes or genomic regions (but not for complete genomes or genome representations), they probably underlie the varying gene counts found for complete genome representations as opposed to an individual chromosome or chromosome segments (Mayer et al., 2009, 2011; Choulet et al., 2010).Many of the Genic Sequences That Are Nonsyntenic between Triticeae and Other Grasses Are Likely to Be Pseudogenes
We argue that a large percentage of the genes that are found in only one of the Triticeae chomosome (arm) data sets but are absent from all others are most likely nonfunctional pseudo-genes. If they were functional genes, that would mean that hundreds of duplications of functional genes must have occurred since the divergence of the A, B, and D genomes (to account for the many differences between them) and a similar process happened independently in barley. This is unlikely, as it would make the Triticeae completely unique among all grasses for which genomic data are available.
Our data show that many nonsyntenic genes have character-istics of pseudogenes: First, coverage of genes with 454 reads suggests that many of them are only fragments, as only one end of the gene was present in the data sets (based on comparison with the closest Brachypodium homolog). Overall, genes that have their homologs in the group 1 syntenic regions in the model grasses were covered over
;
75%, while the nonsyntenic ones were only covered;
33% of their length. This would be consis-tent with previous reports showing that pseudogenes originating from TE capture of DSB repair (see below) are often small fragments.Second, pseudogenes are often not transcribed and almost twice as many syntenic as nonsyntenic genes had perfect matches to ESTs. This suggests that little more than half of the nonsyntenic genes are actually still actively transcribed. We consider this a maximum number, since for a young duplication a copy of a gene (i.e., the pseudogene) sequence might still be highly similar to the transcript that is produced by the original, but it may in fact be silenced or might lack a functional promoter.
A large-scale analysis of contiguous genomic sequences from Triticeae was published recently (Choulet et al., 2010). By ana-lyzing 18 Mbp of BAC contig sequences from wheat chromo-some 3B, this study revealed that 25% of the genic regions identified were either pseudogenes or highly degenerated gene fragments. This confirms, using large contiguous sequences, that deciphering functional versus inactivated genes is crucial to avoid overestimation of the coding potential in Triticeae. The high gene number estimate of 50,000 for the whole wheat genome reported in this previous study was slightly overestimated be-cause it included 12% pseudogenes that were either syntenic or nonsyntenic with model grass genomes. However, 75% of the nonsyntenic genes had a structure likely to be functional, sug-gesting that many of these genes have been maintained by selection. Thus, to resolve gene/pseudogene discrepancies and dynamics, complete coverage and chromosomal ordering of the Triticeae nonrepetitive sequences will be required.
Numerous Pseudogenes Are the Result of TE Activity and DSB Repair
Several studies have documented that the movement of genes or gene fragments to new locations can be mediated by TEs, which capture fragments of foreign DNA (Jiang et al., 2004; Lai et al., 2005; Morgante et al., 2005; Paterson et al., 2009). Additionally,
duplications of genomic fragments can also be the result of the repair of DSBs induced by TE insertions and excisions and other recombination events (Wicker et al., 2010). These DSBs are sometimes repaired with filler DNA that is a copy of a random fragment from elsewhere in the genome (for reviews, see Nassif et al., 1994; Puchta, 2005). Such fillers can be several kilobases in size and sometimes contain multiple genes (Wicker et al., 2010).
In a detailed analysis of 50 pairs of duplicated genes in barley for which we had near-complete BAC sequences, we identified 33 cases of duplicated genes. In 27 of these cases, the 1H copy was a pseudogene. It is intriguing that we found evidence for at least three different molecular mechanisms causing the dupli-cation: In four cases, the duplication was likely caused by DSB repair; in five cases, a gene was captured by a TE; and in one case, a duplication was due to retrotransposition. Although such detailed BAC analysis is very labor-intensive, it would be very promising to conduct a much broader examination of this phe-nomenon to examine the frequency and mechanisms of pseu-dogene formation in Triticeae.
Because of the very high number of TEs in Triticeae, rear-rangements due to DSB repair and TE-driven gene capture probably occur much more often than in smaller genomes. Indeed, previous studies found that TE-driven gene capture and movement is more frequent in larger genomes, such as sorghum or maize, than in rice or Brachypodium (Paterson et al., 2009; Schnable et al., 2009; Wicker et al., 2010). In the genomes of rice, sorghum, and maize, genes and gene fragments that are moved and duplicated by the described processes are probably in the hundreds or low thousands (Jiang et al., 2004; Paterson et al., 2009; Schnable et al., 2009; Wicker et al., 2010). By contrast, the vast numbers of putative pseudogenes identified in this study indicate that the wheat genome might indeed have experienced an exceptionally high frequency of such events. It is so far not known whether this process contributed to functional diversity or even the evolution of agriculturally important genes or if it mostly represents genomic noise.
Evolution of a Triticeae Group 1–Specific Core Gene Set The mechanisms described above will in most cases produce nonfunctional and/or fragmented copies of genes. These will largely be removed from the genome within a relatively short evolutionary time through deletions (Wicker et al., 2003; Vitte and Panaud, 2005). In rare cases, a complete gene will be duplicated. If that gene gains a new function or its functional source copy is eliminated, it can become fixed at its new position in the genome. The common ancestor of the Triticeae has certainly accumulated hundreds of such gene movements starting
;
30 million years ago (when it diverged from the Brachypodium lineage) until;
12 million years ago (when the wheat-barley lineages diverged). We postulate such cases of moved functional genes are now found in the 761 genes that are noncolinear between Triticeae and the three model grasses but are conserved among Triticeae. Indeed, comparison of the group 1–specific genes with those that are present in only one of the group 1 chromosome data sets showed that the group 1–specific genes on average cover a larger region of their Brachypodium homologs and they have more perfect matches to Triticeae ESTs.Runaway Amplification of Genic Sequences on the Short Arm of Chromosome 1A and 1B?
Besides the mere number of genes that were specific to only one single chromosome data set, one of the most surprising findings in this study was the pronounced differences in the total numbers of chromosome/arm-specific gene sequences between sub-genomes and between homologous chromosome arms. As described above, the vast majority of these sequences are probably pseudogenes. The long arms of wheat group 1 chro-mosomes contain between 577 (1DL) and 1035 (1BL) gene homologs that are specific to only the respective chromosome arm. This indicates very different levels of amplifications of genic sequences between wheat subgenomes. Interestingly, the numbers somewhat correlate with the individual sizes of the subgenomes, with the B genome being the largest and the D genome the smallest (Furuta et al., 1986).
Especially striking, however, is the finding that the number of specific genes also differs drastically between chromosome arms of the same genome. The short arms of chromosomes 1A and 1B have a much higher percentage of such chromosome arm–specific gene sequences than the long arms. Apparently, 1BS has undergone a particularly massive accumulation of genic sequences from nonsyntenic regions, as they outnumber the genes that are syntenic with Brachypodium, rice, and sorghum by a ratio of almost 5:1. The short arm of 1A went through a similar process on a more moderate scale. If this strong accu-mulation of genic sequences is indeed driven by TE activity, these findings suggest that different chromosome arms within the same genome can show very different dynamics.
This situation is somewhat reminiscent of the short arm of
Brachypodium chromosome 5, which is syntenic to rice 4S and
sorghum 6S. In all three species, this particular chromosome arm has approximately half the gene density of the rest of the genome and a much higher repeat content (International Brachypodium Initiative, 2010). It was proposed that this chromosome arm was established as nesting ground for TEs already in the common ancestor of the grasses and has been maintained ever since (International Brachypodium Initiative, 2010). The hypothesis says that TEs were enriched through stochastic processes until a tipping point was reached where frequent TE insertions and interelement recombination events had deleterious effects on gene islands. Such effects have also been proposed for small gene islands in barley (Vicient et al., 2005). It is possible that chromosomes 1AS and 1BS are examples of such stochastic processes having occurred in relatively recent evolutionary times.
Technical Considerations
For practical reasons, we used only a relatively small number of flow-sorted chromosomes and amplified their DNA via the mul-tiple displacement procedure. This limited the quantitative anal-yses that could be performed on the data. We had to develop specific procedures to filter out the effects of the amplification to allow for quantitative analyses of gene content. For precise quantitative analyses of the gene and repeat content and pos-sible complete shotgun sequencing of wheat chromosome arms, one would need to use nonamplified sorted chromosome arms.
However, this would be a considerable bottleneck as it requires much larger numbers of sorted chromosome arms.
The fact that 1DS isolated from a double ditelosomic line consisted of fragments of both arms of 1D was an unexpected observation, which limited our wheat subgenome comparisons to the long arm of 1D. This finding confirms the uncertainty on the origin of 1DS in the double ditelosomic line 1D of cv Chinese
Spring, as E.R. Sears concluded that this telocentric
chromo-some was “short, presumably proximal segment of 1DL” (Sears, 1977). A simple transfer of an existing telocentric chromosome would not account for a dramatic change in its structure, as observed here. Only further sample sequencing can confirm that indeed the two telocentrics are different and show if 1DS in the ditelosomic line is normal. The fact that we detected such a complex rearrangement raises the concern that other cytoge-netic stocks may also contain rearranged chromosomes and that these might not be noticed if only relatively small segments of a chromosome are affected.
In conclusion, our approach to combine flow sorting of chro-mosome arms with 454 sample sequencing has provided many insights in the evolution and organization of the Triticeae ge-nomes. Continuing and extending such efforts will likely be a crucial contribution on the path to completely sequenced ge-nomes of wheat and barley and to a better understanding of genome dynamics and evolution of Triticeae.
METHODS
Chromosome Sorting and DNA Amplification
Seeds of double ditelosomic lines 1A, 1B, and 1D of Triticum aestivum cv Chinese Spring were provided by Bikram S. Gill (Kansas State University, Manhattan, KS). Seeds of Hordeum vulgare cv Morex were obtained from the Agricultural Research Institute (Kromeˇrˇı´zˇ, Czech Republic). Aqueous suspensions of mitotic chromosomes were prepared from root tips of wheat and barley as described by Kubala´kova´ et al. (2002) and Sucha´nkova´ et al. (2006), respectively. DNA of chromosomes in suspension was stained with 2mg/mL 49,6-diamidino-2-phenylindole, and wheat telocentric chro-mosomes and barley chromosome 1H were sorted using a FACSVantage SE flow cytometer (Becton Dickinson) into 0.5-mL microtubes containing 40mL sterile deionized water. Several samples were prepared from each chromosome arm, and two reaching the highest purity were chosen for DNA amplification. The identity and purity of sorted chromosomes was determined using FISH with telomeric repeats, GAA microsatellites, and Afa repeats according to Kubala´kova´ et al. (2003). DNA of isolated chromo-some arms was amplified by MDA as described by Simkova´ et al. (2008). The sorted chromosomes were treated with proteinase K, and after its removal, chromosomal DNA was amplified by the Illustra GenomiPhi V2 DNA amplification kit (GE Healthcare Bio-Sciences) in a 20-mL reaction volume. Amounts of amplification products were estimated fluorometrically using a Modulus single-tube multimode reader (Turner Biosystems).
454 Sequencing
DNA amplified from sorted chromosomes was used for 454 shotgun se-quencing. Five micrograms of individual chromosome arm MDA DNA was used to prepare the 454 sequencing library using the GS Titanium general library preparation kit following the manufacturer’s instructions (Roche Diagnostics). The 454 sequencing libraries were processed using the GS FLX Titanium LV emPCR (Lib-L) and GS FLX Titanium Sequencing (XLR70) kits (Roche Diagnostics) according to the manufacturer’s instructions.
Evaluation of Purity of Sorted Chromosomes
To evaluate the purity of the sorted chromosomes, we compared the 454 shotgun data sets from the six chromosome arms against (1) a collection of 2785 barley markers located on the individual chromosomes (Close et al., 2009) and (2) a comparison against wheat bin-mapped markers (Peng et al., 2004). Cutoff values for wheat versus barley were identity $85% and alignment length $50 bp; for wheat versus wheat bin-mapped markers, BLASTN parameters were identity$98% and alignment length $50 bp. Comparison of sequence reads matching the individual data sets demonstrates low background and successful enrichment of the respec-tive chromosomal arms (see Supplemental Figure 3 online).
Sequence Analysis
All analyses were performed on Linux systems. Stand-alone BLAST was obtained from the National Center for Biotechnology Information (NCBI; www.ncbi.nlm.nih.gov/). We used coding sequence data sets from the sorghum (Sorghum bicolor) genome version 1 (Paterson et al., 2009), rice (Oryza sativa) genome version 6 (rice.plantbiology.msu.edu), and
Brac-hypodium genome version 1 (International BracBrac-hypodium Initiative,
2010). As multiple gene models exist for most genes, we created a condensed data set that only contained the largest gene model for each gene. Closest homologs of Brachypodium genes in rice and sorghum were determined by BLASTN. For identification of gene-containing 454 reads, BLASTN searches of individual 454 reads against Brachypodium coding sequence were performed with the help of a custom Perl script, which evaluated the BLAST report. We chose BLASTN because it is more stringent than comparison of amino acid sequence similarity. Sequences with hits were collected in one file and those without hits in another. Throughout this study, we considered BLAST hits with E-values smaller than 10E-10 as significant. Multiple and pairwise sequence alignments were done with ClustalW (Thompson et al., 1994) at default settings and with DOTTER (Sonnhammer and Durbin, 1995).
Genes were named as proposed at the International Wheat Genome Sequencing Consortium workshop at the Plant and Animal Genome Meeting 2011. A five-letter species code (HoVul for barley and TrAes for wheat) is followed by an index of the chromosome (arm), a running number, and the code UZH for University of Zurich.
Production of Group 1 Syntenic Reference Gene Sets
For gene identification, we used only those Brachypodium genes with homologs at the DNA level in both rice and sorghum. Using an E-value cutoff of <10E-10, of the 25,532 Brachypodium genes, 20,468 have homologs at the DNA level in both rice and sorghum. The regions syntenic to the Triticeae group 1 chromosomes are located on two different chromosomes in Brachypodium, rice, and sorghum (International Brachy-podium Initiative, 2010): The short arm of Triticeae chromosome 1 corre-sponds to a region on chromosome 2 between genes Bradi2g30410 through Bradi2g40150. The 1L syntenic region corresponds to
Brachypo-dium chromosome 2 (genes Bradi2g14080 through Bradi2g30400) and
chromosome 3 (genes Bradi3g25620 through Bradi3g34630). These two regions correspond to rice chromosomes 5 and 10 and sorghum chromo-somes 9 and 1, respectively (see Supplemental Figure 4 online).
To the references data sets, we used all the 1744 Brachypodium genes from the 1L syntenic region and the 600 genes from the 1S syntenic region. To account for genes that might have been moved out of this region in Brachypodium, we added those Brachypodium genes whose homologs lie in the group 1 syntenic region in both rice and sorghum. During the production of the data sets, we discovered that there is an overlap of 21 genes in the data sets of 1L and 1S. This is apparently due to translocations of genes between the 1L and 1S syntenic regions in one of the three reference genomes.
Removal of Redundancy Due to DNA Amplification or Sequencing We identified the quantitative bias resulting from the MDA or 454 sequencing by determining the exact positions of each 454 read that hit
Brachypodium genes. If we found multiple 454 reads covering the exact
same region of a particular gene, we interpreted this as amplification bias and eliminated all but one of the reads from the records (see Supple-mental Figure 5 online). For example, Brachypodium gene Bradi3g27910 is covered by 189 reads. There are clearly some reads that are present in multiple copies (due to the MDA or emulsion PCR), but the overall coverage is quite even (see Supplemental Figure 5A online). By contrast,
Bradi3g31900, which is covered by 186 reads, shows extremely distorted
coverage where one region in the 59 region is covered almost 150-fold (see Supplemental Figure 5B online). Between 4.0 and 10.1% of all 454 reads that hit genes were removed in this process (Table 2). Eliminating redundancy was an important step in identifying putative nonsyntenic genes because we only considered those genes that were covered by multiple 454 reads (see Supplemental Table 2 online).
Identification of Putative Nonsyntenic Genes
To distinguish true nonsyntenic genes from contaminations that origi-nate from the flow-sorting process, we introduced an additional selec-tion criterion: We expect that real nonsyntenic genes should have a higher coverage with 454 reads than the contaminants because the contamination consists of a mix of all chromosomes (i.e., >95% of the genome are represented in a contamination of <10%; see above). We considered it extremely unlikely that a gene stemming from contamina-tion would be covered by more than one 454 read. Thus, we kept only those genes that are covered by multiple independent 454 reads (after removal of amplification artifacts, as described above). However, since we had three data sets for the long arm and two for the short arm of group 1 chromosomes, we relaxed that criterion by keeping also those genes that were covered by only one 454 read but are present in one of the data sets from other subgenomes. The numbers of gene-containing 454 reads that were classified as contaminations from other chromo-somes corresponded well with the estimates for contaminations pro-vided by FISH (Table 2).
Accession Numbers
All sequence information generated by Roche/454 was deposited to the European Bioinformatics Institute short-read archive under accession number ERP000445 for the barley and ERP000446 for the wheat data sets. Sequences of barley BAC clones were deposited at NCBI under the following accession numbers: ERR013911, ERR013563, ERR014029, ERR014259, ERR014486, ERR013316, ERR015286, ERR013976, ERR014838, ERR015277, ERR014696, ERR014673, ERR014249, ERR014784, ERR014801, ERR020498, ERR014500, ERR013785, ERR013667, ERR014433, ERR013668, ERR014090, ERR013883, ERR015284, ERR015021, ERR014831, ERR013785, ERR015208, ERR014831, ERR014155, ERR013785, ERR015106, ERR014551, ERR015232, ERR013762, ERR013570, ERR014957, ERR014724, ERR013727, ERR014791, ERR013801, ERR014611, ERR014249, ERR013945, ERR015235, ERR014103, ERR015087, ERR013381, ERR014173, ERR015292, ERR013785, ERR015046, ERR014873, ERR014488, ERR013764, ERR014034, ERR015063, ERR013912, ERR014040, ERR014269, ERR013471, ERR014547, ERR014778, ERR014786, ERR013676, and ERR014653 (these accession numbers are ordered by pairs of BACs that contain corresponding gene copies; see Supplemental Table 1 online). The data set for syntenic genes (in virtual chromosome order) and nonsyntenic genes can be obtained from the authors via FTP upon request.
Author Contributions
N.S., B.K., J.D., C.F., T.F., H.B., U.S., K.F.X.M., and M.P. designed the research. T.W., H.S., M.K., S.T., and N.S. performed the research. T.W., B.S., H.G., M.M., and F.C. analyzed data, and T.W., J.D., H.S., F.C., and N.S. wrote the article. All authors contributed to revising the draft manuscript and approved the final version.
Supplemental Data
The following materials are available in the online version of this article. Supplemental Figure 1. Relationship between Sequence Coverage and Number of Genes Sampled by Roche/454.
Supplemental Figure 2. Relationship of Estimated Physical Chro-mosome Size to Extrapolated Gene Numbers on ChroChro-mosome Arms. Supplemental Figure 3. Evaluatuon of Purity of the Sorted Wheat Chromosome Arms.
Supplemental Figure 4. Regions Syntenic to Triticeae Chromosome Arms 1S and 1L in Brachypodium, Rice, and Sorghum.
Supplemental Figure 5. Examples for 454 Coverage of
Brachypo-dium Genes.
Supplemental Table 1. Pairs of BAC Clones of Which One Was Mapped to Chromosome 1H and the Other One Elsewhere in the Genome.
Supplemental Table 2. Removal of Redundancy in the 454 Data with Homology to Brachypodium Genes.
ACKNOWLEDGMENTS
This work was supported by grants from the German Ministry of Education and Research (BMBF, FKZ 0314000, and GABI-BARLEX), the Swiss National Science Foundation (Grant 3100A-127061/1), the Czech Republic Ministry of Education Youth and Sports (Awards LC06004 and OC08025), and grants from the Commissariat a` l´Energie Atomique-Genoscope (AP2008) and the Agence Nationale de la Recherche ANR-GPLA06001G SMART in the framework of the national Genoplante program. The research leading to these results received funding from the European Community’s Seventh Framework Programme (FP7/2007-2013) under the grant agreement FP7-212019 (Triticeae Genome) and was supported in the framework of the European Cooperation in Sci-ence and Technology FA0604 (Tritigen). We thank Jarmila Cˇ ı´halı´kova´, Romana Sˇperkova´, and Zdenka Dubska´ for assistance with chromo-some sorting and DNA amplification. We thank Susanne Ko¨nig and Jana Schellwat for excellent technical assistance in 454 sequencing of flow-sorted wheat chromosomes. We also thank Bikram S. Gill for providing seeds of double ditelosomic lines and the Cereal Research Institute Kromeˇrˇı´zˇ for the seeds of barley cv Morex. We thank Perry Gustafson and Kathleen Ross for the access to the Annual Reports of the Missouri Agricultural Experiment Station.
Received April 19, 2011; revised April 19, 2011; accepted May 16, 2011; published May 27, 2011.
REFERENCES
Bennett, M.D., and Smith, J.B. (1976). Nuclear DNA amounts in angiosperms. Philos. Trans. R. Soc. Lond. B Biol. Sci. 274: 227–274. Bennetzen, J.L., Coleman, C., Liu, R., Ma, J., and Ramakrishna, W. (2004). Consistent over-estimation of gene number in complex plant genomes. Curr. Opin. Plant Biol. 7: 732–736.
Bossolini, E., Wicker, T., Knobel, P.A., and Keller, B. (2007). Com-parison of orthologous loci from small grass genomes Brachypodium and rice: Implications for wheat genomics and grass genome anno-tation. Plant J. 49: 704–717. Erratum. Plant J. 50: 1129.
Choulet, F., et al. (2010). Megabase level sequencing reveals con-trasted organization and evolution patterns of the wheat gene and transposable element spaces. Plant Cell 22: 1686–1701.
Close, T.J., et al. (2009). Development and implementation of high-throughput SNP genotyping in barley. BMC Genomics 10: 582. Dolezˇel, J., Bartosˇ, J., Voglmayr, H., and Greilhuber, J. (2003).
Nuclear DNA content and genome size of trout and human. Cytometry A 51: 127–128.
Dolezˇel, J., Greilhuber, J., Lucretti, S., Meister, A., Lysa´k, M. A., Nardi, L., and Obermayer, R. (2004). Plant genome size estimation by flow cytometry: Inter-laboratory comparison. Ann. Bot. 82 (Suppl. A): 17–26.
Dolezˇel, J., Kubala´kova´, M., Paux, E., Bartosˇ, J., and Feuillet, C. (2007). Chromosome-based genomics in the cereals. Chromosome Res. 15: 51–66.
Feldman, M., Lupton, F.G.H., and Miller, T.E. (1995). Wheat. In Evolution of Crop Plants, 2nd ed. J. Smartt and N.W. Simmonds, eds (New York: Longman Scientific and Technical), pp. 184–192. Furuta, Y., Nishikawa, K., and Yamaguchi, S. (1986). Nuclear DNA
content in diploid wheat and its relatives in relation to the phylogeny of tetraploid wheat. Jpn. J. Genet. 61: 97–105.
Gale, M.D., and Devos, K.M. (1998). Comparative genetics in the grasses. Proc. Natl. Acad. Sci. USA 95: 1971–1974.
Gill, B.S., Friebe, B., and Endo, T.R. (1991). Standard karyotype and nomenclature system for description of chromosome bands and structural aberrations in wheat. Genome 34: 830–839.
International Brachypodium Initiative (2010). Genome sequencing and analysis of the model grass Brachypodium distachyon. Nature 463: 763–768.
International Rice Genome Sequencing Project (2005). The map-based sequence of the rice genome. Nature 436: 793–800. Islam, A.K.M.R., and Shepherd, K.W. (2000). Isolation of a fertile
wheat–barley addition line carrying the entire barley chromosome 1H. Euphytica 111: 145–149.
Jiang, N., Bao, Z., Zhang, X., Eddy, S.R., and Wessler, S.R. (2004). Pack-MULE transposable elements mediate gene evolution in plants. Nature 431: 569–573.
Kubala´kova´, M., Vala´rik, M., Barto, J., Vra´na, J., Cı´halı´kova´, J., Molna´r-La´ng, M., and Dolezˇel, J. (2003). Analysis and sorting of rye (Secale cereale L.) chromosomes using flow cytometry. Genome 46: 893–905.
Kubala´kova´, M., Vra´na, J., Cı´halı´kova´, J., Simkova´, H., and Dolezˇel, J. (2002). Flow karyotyping and chromosome sorting in bread wheat ( Triticum aestivum L.). Theor. Appl. Genet. 104: 1362–1372. Lai, J., Li, Y., Messing, J., and Dooner, H.K. (2005). Gene movement
by Helitron transposons contributes to the haplotype variability of maize. Proc. Natl. Acad. Sci. USA 102: 9068–9073.
Luo, M.C., et al. (2009). Genome comparisons reveal a dominant mech-anism of chromosome number reduction in grasses and accelerated genome evolution in Triticeae. Proc. Natl. Acad. Sci. USA 106: 15780– 15785.
Marthe, F., and Ku¨nzel, G. (1994). Localization of translocation break-points in somatic metaphase chromosomes of barley. Theor. Appl. Genet. 89: 240–248.
Mayer, K.F.X., et al. (2011). Unlocking the barley genome by chromo-somal and comparative genomics. Plant Cell, in press.
Mayer, K.F.X., et al. (2009). Gene content and virtual gene order of barley chromosome 1H. Plant Physiol. 151: 496–505.
Morgante, M., Brunner, S., Pea, G., Fengler, K., Zuccolo, A., and
Rafalski, A. (2005). Gene duplication and exon shuffling by helitron-like transposons generate intraspecies diversity in maize. Nat. Genet. 37: 997–1002.
Nassif, N., Penney, J., Pal, S., Engels, W.R., and Gloor, G.B. (1994). Efficient copying of nonhomologous sequences from ectopic sites via P-element-induced gap repair. Mol. Cell. Biol. 14: 1613–1625. Paterson, A.H., et al. (2009). The Sorghum bicolor genome and the
diversification of grasses. Nature 457: 551–556.
Peng, J.H., et al. (2004). Chromosome bin map of expressed sequence tags in homoeologous group 1 of hexaploid wheat and homoeology with rice and Arabidopsis. Genetics 168: 609–623.
Pinard, R., de Winter, A., Sarkis, G.J., Gerstein, M.B., Tartaro, K.R., Plant, R.N., Egholm, M., Rothberg, J.M., and Leamon, J.H. (2006). Assessment of whole genome amplification-induced bias through high-throughput, massively parallel whole genome sequencing. BMC Genomics 7: 216.
Puchta, H. (2005). The repair of double-strand breaks in plants: mech-anisms and consequences for genome evolution. J. Exp. Bot. 56: 1–14. Salse, J., Bolot, S., Throude, M., Jouffe, V., Piegu, B., Quraishi, U.M., Calcagno, T., Cooke, R., Delseny, M., and Feuillet, C. (2008). Identification and characterization of shared duplications between rice and wheat provide new insight into grass genome evolution. Plant Cell 20: 11–24.
Schnable, P.S., et al. (2009). The B73 maize genome: Complexity, diversity, and dynamics. Science 326: 1112–1115.
Sears, E.R. (1977). E.R. Sears Papers, Western Historical Manuscript Collection. In Annual Reports of the Missouri Agricultural Experiment Station 1977–1978. (Columbia, MO: University of Missouri), p. 44. Simkova´, H., Svensson, J.T., Condamine, P., Hribova´, E., Sucha´nkova´,
P., Bhat, P.R., Bartosˇ, J., Safa´r, J., Close, T.J., and Dolezˇel, J. (2008). Coupling amplified DNA from flow-sorted chromosomes to high-density SNP mapping in barley. BMC Genomics 9: 294. Sonnhammer, E.L., and Durbin, R. (1995). A dot-matrix program with
dynamic threshold control suited for genomic DNA and protein sequence analysis. Gene 167: GC1–GC10.
Sucha´nkova´, P., Kubala´kova´, M., Kova´rova´, P., Bartosˇ, J., Cı´halı´kova´, J., Molna´r-La´ng, M., Endo, T.R., and Dolezˇel, J. (2006). Dissection of the nuclear genome of barley by chromosome flow sorting. Theor. Appl. Genet. 113: 651–659.
Thompson, J.D., Higgins, D.G., and Gibson, T.J. (1994). CLUSTAL W: Improving the sensitivity of progressive multiple sequence alignment through sequence weighting, position-specific gap penalties and weight matrix choice. Nucleic Acids Res. 22: 4673–4680.
Vicient, C.M., Kalendar, R., and Schulman, A.H. (2005). Variability, recombination, and mosaic evolution of the barley BARE-1 retrotrans-poson. J. Mol. Evol. 61: 275–291.
Vitte, C., and Pannaud, O. (2005). LTR retrotransposons and flower-ing plant genome size: Emergence of the increase/decrease model. Cytogenet. Genome Res. 110: 91–107.
Vra´na, J., Kubala´kova´, M., Simkova´, H., Cı´halı´kova´, J., Lysa´k, M.A., and Dolezˇel, J. (2000). Flow sorting of mitotic chromosomes in common wheat (Triticum aestivum L.). Genetics 156: 2033–2041. Wicker, T., Buchmann, J.P., and Keller, B. (2010). Patching gaps in
plant genomes results in gene movement and erosion of colinearity. Genome Res. 20: 1229–1237.
Wicker, T., Guyot, R., Yahiaoui, N., and Keller, B. (2003). CACTA transposons in Triticeae. A diverse family of high-copy repetitive elements. Plant Physiol. 132: 52–63.
Yang, L., Takuno, S., Waters, E.R., and Gaut, B.S. (2011). Lowly expressed genes in Arabidopsis thaliana bear the signature of pos-sible pseudogenization by promoter degradation. Mol. Biol. Evol. 28: 1193–1203.