Publisher’s version / Version de l'éditeur:
Vous avez des questions? Nous pouvons vous aider. Pour communiquer directement avec un auteur, consultez la première page de la revue dans laquelle son article a été publié afin de trouver ses coordonnées. Si vous n’arrivez Questions? Contact the NRC Publications Archive team at
[email protected]. If you wish to email the authors directly, please see the first page of the publication for their contact information.
https://publications-cnrc.canada.ca/fra/droits
L’accès à ce site Web et l’utilisation de son contenu sont assujettis aux conditions présentées dans le site
LISEZ CES CONDITIONS ATTENTIVEMENT AVANT D’UTILISER CE SITE WEB.
85th Annual Meeting of the Transportation Research Board [Proceedings], pp. 1-19, 2006-01-22
READ THESE TERMS AND CONDITIONS CAREFULLY BEFORE USING THIS WEBSITE. https://nrc-publications.canada.ca/eng/copyright
NRC Publications Archive Record / Notice des Archives des publications du CNRC : https://nrc-publications.canada.ca/eng/view/object/?id=1a83831c-26b1-40e2-b83b-3cefdc6e4688 https://publications-cnrc.canada.ca/fra/voir/objet/?id=1a83831c-26b1-40e2-b83b-3cefdc6e4688
Archives des publications du CNRC
This publication could be one of several versions: author’s original, accepted manuscript or the publisher’s version. / La version de cette publication peut être l’une des suivantes : la version prépublication de l’auteur, la version acceptée du manuscrit ou la version de l’éditeur.
Access and use of this website and the material on it are subject to the Terms and Conditions set forth at Characterization of bituminous-sealants utilizing modified bending beam rheometer
Cha ra c t e rizat ion of bit um inous-se a la nt s
ut ilizing m odifie d be nding be a m
rhe om e t e r
N R C C - 4 8 6 2 7
A l - Q a d i , I . L . ; Y a n g , S - H . ; E l s e i f i , M . A . ;
M a s s o n , J - F . ; M c G h e e , K . M .
A version of this document is published in / Une version de ce document se trouve dans:
85th Annual Meeting of the Transportation Research Board, Washington, D.C., Jan. 22-26, 2006, CD-ROM Paper #06-1882, 21 pages.
Characterization of Bituminous-Sealants Utilizing
Modified Bending Beam Rheometer
Imad L. Al-Qadi, Shih-Hsienn Yang, Mostafa A. Elseifi,
J-F. Masson, and Kevin M. McGhee
Illinois Center for Transportation
www.ict.uiuc.edu
Transportation Research Board
85
thAnnual Meeting
January 22-26, 2006
Washington, D.C.
Duplication for publication or sale is strictly prohibited without prior written
permission of the Transportation Research Board
Imad L. Al-Qadi
Founder Professor of Engineering Illinos Center for Transporation, Director Department of Civil and Environmental Engineering
University of Illinois at Urbana-Champaign 205 N Mathews MC-250, Urbana, IL 61801
e-mail: [email protected]
Shih-Hsien Yang Graduate Research Assistant
Department of Civil and Environmental Engineering University of Illinois at Urbana-Champaign 205 N Mathews MC-250, Urbana, IL 61801
e-mail: [email protected]
Mostafa A. Elseifi Research Scientist
Advanced Transportation Research and Engineering Laboratory Department of Civil and Environmental Engineering
University of Illinois at Urbana-Champaign 1611 Titan Dr., Rantoul, IL 61866
e-mail: [email protected]
J-F. Masson
Institute for Research in Construction
National Research Council of Canada, Ottawa, ON, K1A 0R6, Canada. E-mail: [email protected]
Kevin M. McGhee Senior Research Scientist
Virginia Transportation Research Council, VDOT Charlottesville, VA 22903
ABSTRACT
Early research showed that the current specification for the selection of crack sealants correlates poorly with field performance. To address this issue and help predict the low temperature properties of hot-poured bituminous sealants, a modified Bending Beam Rheometer (BBR) method is utilized. Eight sealants, with a wide range of rheological behaviors, were tested between –4 and –40°C. When the time-temperature superposition principle was used, the stiffness after 240s at a temperature T was equivalent to the stiffness after 5h of creep loading at a temperature of T+10°C. The results indicate that the stiffness of hot-poured sealant at 240s help predict low temperature behavior. In addition, the rate of stiffness change in a log-log scale (m-value) can be used to assess stress relaxation. Two additional parameters are thought to provide a useful indication of the sealant performance at low temperature: steady-state creep rate, obtained after a 240s loading; and the average creep rate, based on deflection measurements over the 240s.
Keywords: roadway, pavement, maintenance, preservation, specification, sealant, testing, low temperature, stiffness, m-value, BBR, and creep rate
INTRODUCTION
Crack sealing and filling is used on a routine basis for preventive maintenance. Crack sealing prevents the infiltration of water in the pavement structure, thus preventing the weakening of the pavement and delaying its deterioration. Several years of service life may be added to the pavement at a relatively low cost, assuming that an appropriate sealant material is correctly installed at the right time in the pavement’s life. After a proper installation, a bituminous (hot-poured) sealant can only provide an acceptable performance if it resists degradation, and adhesive and cohesive failures at service temperatures. As a result of the chemical complexity of these sealants, specification tests have been developed around physical properties thought to be relevant to performance. The current ASTM D5329 and AASHTO M173 sealant specifications rely on simple, but empirical, tests like the cone penetration and softening point in an attempt to measure the ability of the materials to resist cohesive and adhesive failure. Although the viscoelastic behavior of crack sealants is too complicated to be described by these simple empirical parameters, the consistency tests have been perceived as acceptable for specifying crack sealants and ensuring the consistency of sealant properties.
As a result of increasing traffic, axle loadings, and tire pressures, as well as the early failure of hot-poured crack sealants, a new range of highly-modified crack sealants have been introduced (1). These sealants can exhibit quite complex behavior compared to traditional sealant materials (2). In addition, traditional consistency tests adequately do not describe the viscoelastic properties needed to do not relate the sealant’s physical properties to field performance, nor do they allow for the development of performance-based specifications. The results of these tests were found to correlate poorly with field performance. Some sealants that provided superior field performance were ranked equally with those that had poor performance. This inconsistency between field performance and the current specification system has been widely reported in the literature (3). Hence, an improved sealant specification and selection system is urgently needed.
The objective of this study was to evaluate the rheological properties of both aged and unaged sealants, in an effort to develop performance-based guidelines for sealant selection. Whenever possible, it is an economically-attractive solution to make use of the well-established methods and equipment originally developed for the asphalt binder Performance Grade (PG) system during the five-year Strategic Highway Research Program (SHRP). As a result of the softness of sealants and their excessive deformation under the standard load during bending beam rheometer (BBR) analysis, the method was deemed unsuitable to measure the stiffness of hot-poured crack sealants (1). Hence, some modifications to the BBR were suggested (4). The modifications include a doubling of the beam thickness to increase its inertia, thus reducing beam deflection.
In this paper, indicators of sealant performance at low temperatures are investigated. The criteria used to select these indicators include the ability to describe the rheological behavior of the sealant at low temperature, ease of measurement and calculation, repeatability, and ability to predict field performance. This paper addresses the first three criteria.
BACKGROUND
The SuperPave (Superior Performing Asphalt Pavements) binder tests and specification system was developed in the early 1990s as a part of the SHRP program. A unique feature of the SuperPave binder specification system is that the specified criteria remain constant, though the temperature at which the criteria must be met changes for the various PG grades. The tests are performed at typical pavement service temperatures. To measure the fundamental rheological properties of asphalt binders at low temperature, the BBR and the direct tensile tester (DTT) were developed. Tests and specifications were initially intended for asphalt binders, including both modified and unmodified asphalt binders.
In this study, the adaptation of the BBR to test sealants is of particular interest. The behavior of bituminous sealants is similar to that of highly-modified asphalt binders, with the polymers’ content reaching as high as 18% (5). Prior to adopting the BBR to test sealants, it is essential that the SuperPave assumptions also apply to sealants. It is first assumed that the materials show linear viscoelasticity (LVE). Unless the measurements are taken at relatively small strains, this assumption is generally invalid. A departure from LVE would necessitate a highly complex analysis to calculate stiffness, and the approach would be much different than the current SuperPave binder specification system. Therefore, stiffness measurements must be within the linear-viscoelastic region.
Another important assumption of SuperPave is that 1h of conditioning between the pouring of the sample and its testing suffices to reduce the effect of physical hardening on the measured stiffness. Here, sealants were also conditioned for 1h. Another SuperPave assumption is that the BBR creep stiffness and the slope change of stiffness (the m-value) suffice to distinguish and grade different binders in terms of low temperature performance. This assumption was proved inadequate, however (7, 8). This is especially true of polymer-modified binders, although field observations clearly show that such binders are effective at low temperature (9). As crack sealants are highly-modified asphalts, it is critical to select parameters that would allow for the differentiation among different materials in terms of low temperature performance.
Modifications to the standard BBR method
The standard SuperPave BBR method was found inappropriate to test sealants (4). Sealant deflections exceed the instrument limit within a few seconds of loading. To address this issue, the moment of inertia of the tested beam was increased by doubling its thickness (from 6.35mm to 12.7mm). This allowed testing of soft sealants within the equipment deflection limits (6mm). For the new beam dimensions, it was found that only 4% of the beam center deflection is due to shear, a value deemed acceptable for sealant evaluation and comparison (4). The sample preparation was also modified because of the highly elastic and heterogeneous nature of sealants versus that of unmodified asphalts. The sample was first heated to the manufacturer-recommended installation temperature for 30min and was then firmly stirred before pouring into the BBR molds. The key point of the suggested laboratory procedure was to keep the sealant fluid and homogeneous during sample preparation. The Mylar strips that are recommended in the SuperPave binder specification system were also substituted with an appropriate release agent because regular strips stick to crack sealants.
EXPERIMENTAL PROGRAM
Eight sealants from three manufacturers were selected. They had the widest possible range of rheological behavior. TABLE 1 presents some standard test results to highlight the differences between the sealants. The sealants were divided into two groups: soft sealants (BB, MM, NN, and PP), designed for service at low temperatures (e.g., -34 to -40°C); and stiff sealants (sealants QQ, ZZ, YY, and AB), designed for milder winters (e.g., -4 to -10°C). Soft sealants, with very high penetrations, most often in excess of the specification limit, are used in the Northern US (e.g., Minnesota, Michigan, etc.) and Canada, while stiff sealants are used in the Southern US (e.g., Texas). Given the penetrations and the softness of the various sealants, they were classified into one of two groups: high or low penetration. TABLE 1 ranks the sealants according to their penetration. The two groups were evaluated separately in this study.
TABLE 1 Standard Sealant Specifications as Reported by the Manufacturers
Sealant Penetration at 25°C (dmm)! Flow at 60°C (mm) Resilience at 25°C (% recovery) Rank^ BB 148* 0 80 4 PP 130* 1 44* 2 NN 75 0 70 1 MM 120* 1 70 3 QQ 22 0 36* 1 AB 40 N/A 23* 2 ZZ 42 N/A N/A 3 YY 42 N/A N/A 3
^: Rank based on the results of the penetration test; *: do not meet the specification requirements; !: maximum allowable penetration is 90dmm.
Aging of sealants
During installation, crack sealants are placed in a melter applicator unit to change the materials from a solid to a liquid state and to ensure thermal consistency of the sealant during application. When the sealant reaches the recommended application temperature, it is applied to the crack or routed-reservoir through a pump-fed applicator wand. In practice, sealants weather and age; and as a result, they become stiffer and more brittle. If the sealant can no longer accommodate the cyclic opening and closing of pavement cracks, cohesive failure may occur. As it was recommended in the SuperPave specification system, testing of the aged sealant is thought to be both more critical and more representative of the failure conditions of the sealants. Therefore, BBR was conducted on aged sealants. The aging was done at 115°C for 16 hours in a vacuum oven (5).
Bending Beam Rheometer (BBR)
A BBR manufactured by ATS was used to measure low temperature stiffness on aged sealants. A constant load of 980mN was applied at the mid-span of a simply supported sealant
beam with an effective length of 102mm, a thickness of 12.7mm and a width of 12.7mm. The tests were conducted in a fluid bath maintained at a constant test temperature. During the test, the deflection of the center point of the beam was measured continuously, along with the loading time and magnitude, as well as the beam recovery after unloading. The loading time was 240s and the unloading recovery time was 480s. Sealants were conditioned 1h at the test temperature prior to testing. Four replicates were tested at each temperature. The soft sealants were tested at -28, -34, and -40°C while the stiff sealants were tested at -4, and -10°C. Figure 1 presents a typical time-deflection curve as obtained from the modified BBR test.
Verification of Linear Viscoelasticity
Before the evaluation of the low temperature behavior, the linear viscoelastic behavior was verified. The approach of Marasteanu and Anderson was adopted (6):
• Apply three different load levels, and ensure that the measured stiffness at different loads is the same.
• Apply the linear superposition principle by measuring the response of the material to a sequence of loads.
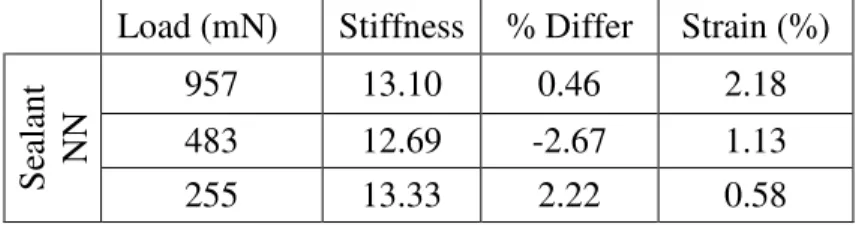
The material is considered linearly viscoelastic when the results of these tests vary by less than 5%. The results of the first test for sealant NN at -40°C are presented in TABLE 2. As the table shows, the stiffness was independent of the load level. The results of the second test for linearity are shown in TABLE 3, where the deflection at a time (t) was compared to the recovered deflection after the load was removed at a time (240+t). The difference between the deflection at a times (t) and (240+t) ranged from 1 to 12%. In an attempt to keep the variation under 5%, creep testing was conducted at a reduced load of 600mN. The results indicated that even at a small load, the sample did not fully recover the creep deflection. At this stage of our research, it appears that crack sealants satisfy the first condition of linearity while they may violate the second condition at some temperature, possibly because of the use of a sitting load.
TABLE 2 Verification of Sealant Linear Viscoelasticity Stiffness at Different Loads Load (mN) Stiffness % Differ Strain (%)
957 13.10 0.46 2.18 483 12.69 -2.67 1.13 S ea la nt N N 255 13.33 2.22 0.58
TABLE 3 Percent Difference between Deflection at time (t) and Recovered Deflection at time (240 +t) % Difference Temperature (°C) Sealant -30 -28 -25 PP -5.83 -10.36 -5.66 NN -1.09 -12.20
----0 0.5 1 1.5 2 2.5 3 3.5 4 4.5 5 0 100 200 300 400 500 600 700 800 Time (s) D efl ec ti on (m m ) -200 0 200 400 600 800 1000 1200 L oa d (m N ) BB-40 BB-34 Load (a) 0 0.5 1 1.5 2 2.5 3 0 100 200 300 400 500 600 Time (s) D efl ec ti on (m m ) -200 0 200 400 600 800 1000 1200 L oa d (m N ) BB-34 Load (b)
Figure 1 (a) Typical deflection vs. time curves for sealant BB and (b) Creeping of the same sealant under the influence of the sitting load after a creep load of 50s
A significant factor that needs to be considered in the interpretation of the BBR results is related to the sitting load (usually 30mN). Although the sitting load is essential to ensure an adequate contact between the loading frame and the beam’s top surface, it was noticed that this
small load could cause a creeping of the sample after the initial recovery of some of the exhibited deflection. This phenomenon was more pronounced with soft crack sealants than with asphalt binder. Crack sealants are compliant in nature and may creep under their own weight even at low temperature. Figure 1b presents a typical case of creeping under the sitting load. In this figure, the recovery part was conducted under no load except the sitting load. The results of this analysis should therefore be evaluated further before a definite conclusion can be drawn with respect to the linear viscoelastic region of crack sealants. For the purpose of the analysis presented in this paper, linear viscoelastic behavior of crack sealants was assumed.
RESULTS AND ANALYSIS
In addition to the SuperPaveTM parameters (stiffness and m-value), two performance parameters were evaluated: minimum creep rate, and average creep and recovery rate.
Stiffness (S) and m-value
Research conducted by Hills and Brien in the late 1960s and early 1970s suggested that binder stiffness correlates well with thermal cracking in flexible pavements after a loading time of 1 to 5.5h (10). Based on these results, it was suggested to limit the creep stiffness to 300MPa after a loading time of 2h. Based on field observations, the SuperPaveTM testing protocol imposed limits on the creep stiffness measured in the BBR test setup. However, for practical reasons and on the basis of the assumed validity of the time-temperature superposition principle, the loading time in the BBR was reduced from 2h to 60s while the temperature was raised by 10°C. After several preliminary tests, a loading time of 240s was selected. In addition to the creep stiffness, the stress relaxation of the asphalt binder was also considered. The stress relaxation was obtained by measuring the change in stiffness with respect to time in a log-log scale (i.e., the slope or the rate), also known as the m-value. Physically, a faster change in stiffness rate (m-value) would indicate a faster relaxation of stresses, which is desirable at low temperatures.
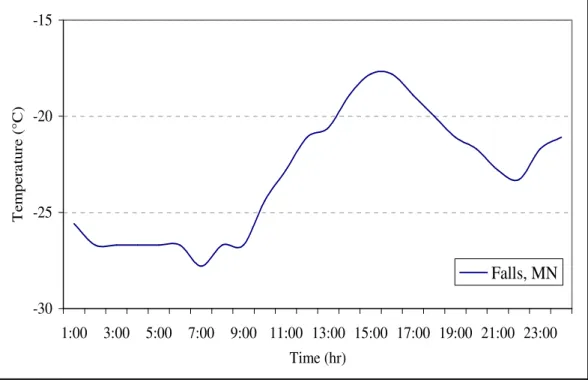
For crack sealants, a different failure mechanism is expected. Figure 2(a) presents the daily temperature variation in International Falls, Minnesota (one of the coldest locations in the US) during the winter season, as obtained from the typical meteorological year (TMY) files. These data represent temperatures judged to be typical based on a statistical analysis of 30 years of weather records. As shown in the figure, the temperature drops over 10h, between 4PM and 2AM, to stabilize at its lowest level of -27°C for about 7h during the night. It is worth noting that in several Canadian cities that were part of this project, the temperature could reach lows of -40°C in winter. Figure 2(b) presents the average daily temperature variation in a much warmer location: Roanoke, Virginia, during the winter. In this location, the temperature drops over about 6h and it is stable at the low of -1°C for about 3h. Hence, with dropping temperatures, sealants may be under tensile strain for 6 to 10 h. With constant temperatures and static cracks and joints, the internal stresses may dissipate by stress relaxation over 3 to 7h.
The rationale used for setting a maximum threshold limit for the stiffness of crack sealants is different than that used for asphalt binders. At a short loading time, the sealant could be brittle and prone to cracking if the material is unable to dissipate the energy imposed by the load through deformation. However, because the thermal load is usually applied progressively
and crack sealants are much more compliant than asphalt binder, the occurrence of this failure mechanism may not be critical. On the other hand, upon the tensile loading of the sealant over 6 to 10h, it may fail before stress relaxation occurs. It would be prohibitive to conduct a stiffness test for such a long time. Consequently, the stiffness at 240s was used in an attempt to predict sealant stiffness after 5h of loading using the time-temperature superposition principle (11).
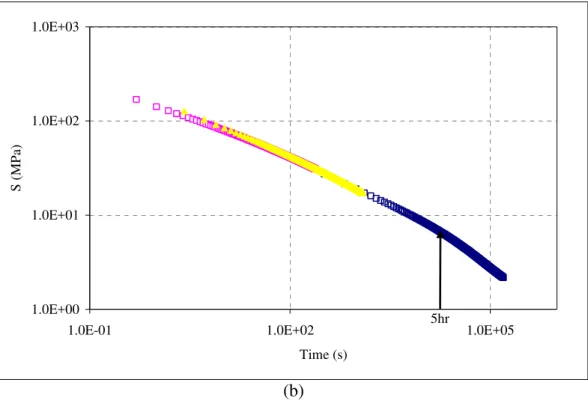
Figure 3 presents the constructed master curve for sealant MM based on rheometry at -28, -34, and -40°C. The master curve makes it possible to determine stiffness up to about 30h at a reference temperature of -40°C. If the temperature-superposition principle applies, it was found that the stiffness at 240s at temperature T (°C) can be used to predict the stiffness after 5h of loading at a temperature T-10 (°C). In this case, a maximum stiffness needs to be set so that sealant failure can be avoided if the material does not relax the imposed stress after 5h of creep loading. The use of the m-value can be justified by the same rationale that is used in the SuperPaveTM binder specification system. In this case, the m-value would provide an indication of how fast the crack sealant can relax the imposed thermal load.
-30 -25 -20 -15 1:00 3:00 5:00 7:00 9:00 11:00 13:00 15:00 17:00 19:00 21:00 23:00 Time (hr) T e m p e ra tu re ( °C ) Falls, MN (a)
-5 -3 -1 1 3 5 1:00 3:00 5:00 7:00 9:00 11:00 13:00 15:00 17:00 19:00 21:00 23:00 Time (hr) T e m p e ra tu re ( °C ) Roanoke, VA (b)
Figure 2 Variation of air temperature for two locations: (a) International Falls (MN) and (b) Roanoke (VA)
1.0E+00 1.0E+01 1.0E+02 1.0E+03
1.0E-01 1.0E+02 1.0E+05
Time (s) S (M P a) -40°C -28°C -34°C (a)
1.0E+00 1.0E+01 1.0E+02 1.0E+03
1.0E-01 1.0E+02 1.0E+05
Time (s) S ( M P a) 5hr (b)
Figure 3 Construction of a master curve from the BBR test data obtained at three temperatures: (a) before shifting and (b) after shifting
The 240s stiffness of sealants BB, MM, NN, and PP was measured at -40 and –34°C, and sealants AB, QQ, YY, and ZZ were measured at -10 and –4°C, respectively (Figure 4 a and b). As previously noted, a low stiffness is desirable to prevent cohesive failure of the sealant. The average stiffness measured at 240s and -40°C for sealant MM was 31MPa with a coefficient of variance (COV) of 2.3%. For sealant BB, the average stiffness was 7.8MPa with a COV of 1.8%. At a temperature of -10°C, sealant QQ showed the highest stiffness value of 65.8MPa with a COV of 3.5% (which was also the highest), and sealant AB showed the lowest stiffness value of 6.7MPa with a COV of 0.5% (which was the lowest). Using the aforementioned rationale, at -40°C sealant BB would perform best while sealant NN would perform worst. Similarly, at -10°C sealant AB would perform best, while sealant QQ would perform worst – at the tested temperature. Figures 5(a and b) show the m-value for the sealants. It appears that the m-value can discriminate between the responses of different sealants at low temperatures.
0 5 10 15 20 25 30 35 BB MM NN PP Sealants S2 4 0 (M P a) -40C -34C (a) 0 10 20 30 40 50 60 70 YY ZZ AB QQ Sealant S2 4 0 ( M P a) -10°C -4°C (b)
Figure 4 (a) S240 for Sealant BB, MM, NN, and PP at -40 and -34°C and (b) S240 for
Sealant YY, ZZ, AB, and QQ under 10 and 4°C (Sealant YY could not be tested at -4°C because the deflection exceeded the equipment limits of 6mm.)
0.00 0.10 0.20 0.30 0.40 0.50 BB MM NN PP Sealant m2 4 0 -40°C -34°C (a) 0.0 0.1 0.2 0.3 0.4 0.5 0.6 0.7 YY ZZ AB QQ Sealant m 2 4 0 -10°C -4°C (b)
Figure 5 Sealant (a) m240 for Sealant BB, MM, NN, and PP at -40 and -34°C and (b)
m240 for Sealant YY, ZZ, AB, and QQ under -10 and -4°C (Sealant YY could not be
tested at -4°C because the deflection exceeded the equipment limits of 6mm.)
Creep Rate at 240s
The shape of a typical creep curve of strain versus time is shown in Figure 6(a). The slope of the strain curve is the creep rate. A creep behavior of a material can be divided into
three stages: primary creep, in which the creep resistance increases with the strain leading to a decreasing creep strain rate; secondary (or steady state) creep, in which there is a balance between work hardening and recovery processes, leading to a minimum constant creep rate; and tertiary creep, in which there is an accelerating creep rate due to the accumulated damage, which leads to creep rupture. The latter may not be observed in the modified BBR test because of the short loading time. Among these three stages, the minimum secondary creep rate may be of the greatest interest as a performance indicator for bituminous sealants. A high creep rate characterizes a sealant capable of deforming under a load without building up significant stresses.
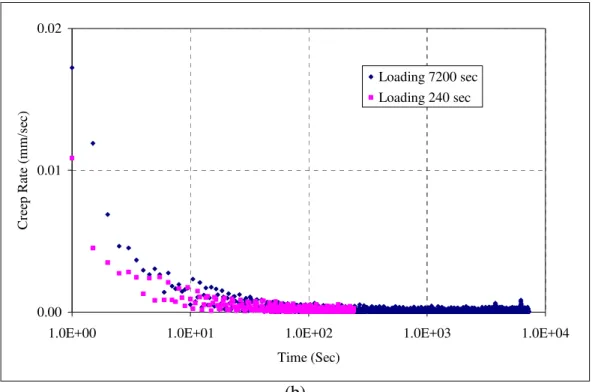
With a loading time of only 240s in the BBR, the test is an accelerated one. To verify the validity of this approach, results over 240s were compared to those over an extended loading time of 7200s. Results in Figure 6(b) show that the calculated creep rate after 240s is indicative of the creep rate after longer loading time. Figures7 (a and b) show the calculated creep rate at 240s for the soft and stiff sealants. At the various temperatures, sealants BB and AB would be expected to exhibit the best performance, given their high rate of creep. Interestingly, the creep rate varied considerably from one sealant to another, indicating that this parameter may discriminate between sealants.
Primary Secondary Tertiary
Time Total Strain
Creep Rate
.
.
0.00 0.01 0.02
1.0E+00 1.0E+01 1.0E+02 1.0E+03 1.0E+04
Time (Sec) C re ep R at e (m m /s ec ) Loading 7200 sec Loading 240 sec (b)
Figure 6 (a) Stages in a Typical Creep Rate versus Time Curve; (b) Comparison between Creep Rate at 240s loading and 7200 sec loading
0.0E+00 5.0E-04 1.0E-03 1.5E-03 2.0E-03 2.5E-03 3.0E-03 3.5E-03 4.0E-03 4.5E-03 BB MM NN PP Sealants S te a d y S ta te C re e p R a te ( m m /s e c ) (a)
0.0E+00 5.0E-04 1.0E-03 1.5E-03 2.0E-03 2.5E-03 3.0E-03 YY ZZ AB QQ Sealants S te ad y S ta te Cre ep Ra te (m m /s ec ) (b)
Figure 7 (a) Steady State Creep Rate at 240s for Sealant BB, MM, NN, and PP at 40°C; and (b) Steady State Creep Rate at 240s for Sealant YY, ZZ, AB, and QQ at -10°C
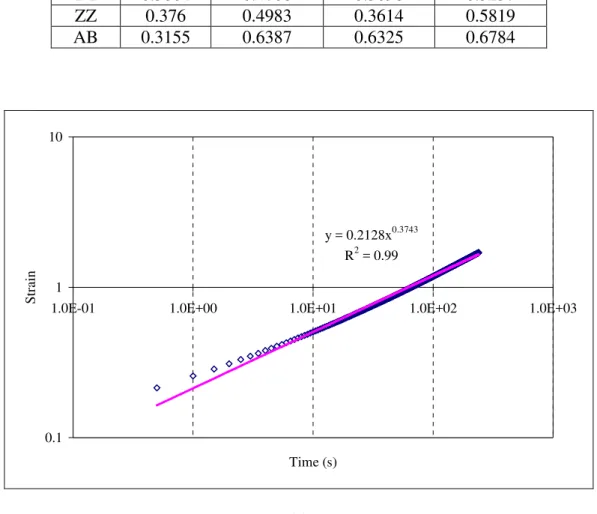
Average Creep Rate and Average Recovery Rate
Another method to evaluate creep and recovery behavior from BBR data is to determine the average rate of creep and recovery. The creep and recovery data versus time were fitted to a power law model. The exponents of the power law model represent the average rate of creep and recovery. The absolute values of the exponents were then compared. An illustration of the calculation of the average rate of creep and recovery for Sealant BB at -40°C is shown in Figure 8(a and b). From the results presented in these figures, it can be estimated that the average rate of creep is 0.3743, which is higher than the average rate of recovery estimated at 0.0899. This indicates that for sealant BB at -40°C, the material deforms faster than it recovers. Tables 4 and 5 show the average of rates of creep and recovery for the eight tested sealants. In this approach, the recovery rate at any given time is directly proportional to the preceding creep stress and the exhibited deformation. This explains the fact that the recovery rate at higher temperature was greater than the recovery rate at lower temperature. If the deformation is kept constant, the material should recover faster at lower temperature than at high temperature. This could not be obtained using the standard BBR device for a constant loading time of 240s at a specified load of 980mN because of the sitting load. Therefore, the use of this parameter as an indicator of low temperature performance is not recommended, given the adopted BBR test setup. In fact, using parameters related to recovery, such as percentage strain recovery, can result in erroneous interpretation of the data and so be misleading.
TABLE 4 Average Rate of Creep and Recovery for (a) the Soft Sealants Group at -40°C; and (b) the Stiff Sealants Group at -10°C
-40°C -34°C
(a)Sealant Creep Rate
Recovery Rate
Creep Rate Recovery Rate BB 0.3743 0.0899 0.3785 0.107 MM 0.2709 0.4108 0.3465 0.5027
NN 0.2933 0.2231 0.3527 0.3007 PP 0.4073 0.1982 0.4442 0.2283
TABLE 5 Average Rate of Creep and Recovery for the Stiff Sealants Group at -10°C
-10°C -4°C
Sealant Creep Rate
Recovery
Rate Creep Rate
Recovery Rate QQ 0.2723 0.3657 0.4261 0.4645 YY 0.3064 0.4706 0.3098 0.5237 ZZ 0.376 0.4983 0.3614 0.5819 AB 0.3155 0.6387 0.6325 0.6784 y = 0.2128x0.3743 R2 = 0.99 0.1 1 10
1.0E-01 1.0E+00 1.0E+01 1.0E+02 1.0E+03
Time (s) S tr ai n (a)
y = 1.6787x-0.0899 R2 = 0.98
0.1 1 10
1.0E-01 1.0E+00 1.0E+01 1.0E+02 1.0E+03
Time (s) S tr ai n (b)
Figure 8 (a) Average Rate of Creep; and (b) Average Rate of Recovery for Sealant BB at -40°C
DISCUSSION
TABLE 4 shows the ranking of the eight tested sealants in terms of the different parameters presented in this study. There was a relatively good agreement between the different parameters obtained with the modified BBR. Interestingly, the agreement between the modified BBR and the penetration rankings was only fair. This is not totally surprising given the lack of correlation between the field performance of sealants and the standard specification that makes use of the penetration (12) and the lack of correlation between the penetration and the performance of polymer-modified binders (13). This reinforces the need to go beyond the standard specification to assess the likely performance of sealants, especially those formulated for service at very low temperatures. The agreement between the modified BBR parameters in TABLE 6 indicates that the method is a promising one to asses low temperature behavior. The correlation of the modified BBR results to field performance and its predictions will be addressed in future work.
CONCLUSIONS
A modification of the standard BBR method for asphalt binders was shown to be reliable for evaluating the rheological behavior of hot-poured crack sealants. Three parameters were identified to evaluate the crack sealants’ cohesive performance at low temperatures, using the following criteria: ability to describe the sealant’s rheological behavior, ease of measurement and calculation, repeatability, and correlation with field performance. The first three criteria were included in this study, while the fourth is currently being researched.
The present study found that sealants’ stiffness measured using BBR at 240s can be used to predict the ability of a hot-poured crack sealant to dissipate the imposed energy without being fractured. The rate of stiffness change in a log-log scale (m-value) can be used to predict the ability of the material to relax the applied stresses. Using the time-temperature superposition principle, the stiffness after 240s at a temperature T is equivalent to the stiffness after 5hr of creep loading at a temperature T+10°C. In addition, two additional parameters were thought to provide useful indications as to the sealants’ performance at low temperature: the steady-state creep rate, which can be predicted from the creep rate after a loading time of 240s; and the average creep rate, which is based on the deflection measurements over 240s.
TABLE 6 Ranking of the Eight Tested Sealants in Terms of the Different Parameters Rank
Sealant
Penetration Stiffness m-value
Average Creep Rate Creep Rate @ 240s BB 4 1 2 1 1 PP 2 2 1 2 2 NN 1 3 4 4 3 MM 3 4 3 3 4 AB 2 1 3 2 2 QQ 1 4 4 4 4 YY 3 3 2 3 3 ZZ 3 2 1 1 1 ACKNOWLEDGEMENTS
This research is sponsored by the Federal Highway Administration Pool-fund TPF5 (045) and the Canadian Crack Sealant Consortium. The contribution of the participating states, industry, and provinces is acknowledged. The contents of this paper reflect the view of the authors who are responsible for the facts and the accuracy of the data presented herein. The contents do not necessarily reflect the official views or policies of the pool-fund participating Departments of Transportation or the Federal Highway Administration. This paper does not constitute a standard, specification, or regulation. The assistance of A. Loulizi, W. Hobbs, S. Dessouky, and J. Stein is greatly appreciated.
REFERENCES
1. Zanzotto, L. Laboratory Testing of Crack Sealing Materials for Flexible Pavements. Final Report, Transportation Association of Canada, Ottawa, Ontario, 1996.
2. Belangie, M. C., and D.I. Anderson. Crack Sealing Methods and Materials for Flexible
Pavements. Final Report, No. FHWA-UT-85-1, Utah Department of Transportation, Salt
Lake City, UT, 1985.
3. Smith, K. L., and Romine, A.R. Innovative Materials Development and Testing. Volume 3:
4. Al-Qadi, I. L., A. Loulizi, S. Aref, J-F. Masson and K.M. McGhee. Modification of Bending Beam Rheometer Specimen for Low-Temperature Evaluation of Bituminous Crack Sealants. In Transportation Research Broad, Washington, D.C., 2004 (in Press).
5. Al-Qadi, Imad, J-F Masson, Amara Loulizi, and Peter Collins, Kevin K. McGhee, John R. Woods, Sla ana Bundalo-Perc. Long-term aging and low temperature testing. In Internal Report of Crack Sealant Consortium Draft Report B5508.5, 2003.
6. Masson, J-F., L. Pelletier, P. Collins. Rapid FTIR Method for Quantification of Styrene-Butadiene Type Copolymers in Bitumen. Journal of Applied Polymer Science, v79, No 5, 2001, pp. 1034-1041.
7. Marasteanu, M. O. and D. A. Anderson. Establishing Linear Viscoelastic Conditions for Asphalt Binders. In Transportation Research Record: Journal of the Transportation Research
Board, No.1728, TRB, National Research Council, Washington, D.C., 2000, pp. 1-6.
8. Hesp, S.A., S. Iliuta, M.O. Marasteanu, K.K. Tam, and T. Masliwec. Field Validation Study of Low-Temperature Performance Grading Tests for Asphalt Binders. In Transportation
Research Record: Journal of the Transportation Research Board, No 1875, TRB, National
Research Council, Washington, D.C., 2004, pp 14-21.
9. Anderson, D.A., L. Champion-Lapalu, M.O. Marasteanu, Y. Le Hir, D. Martin, and J.P. Planche. Low-Temperature Thermal Cracking of Bitumens as Ranked by Strength and Fracture Properties. In Transportation Research Record: Journal of the Transportation
Research Board, No 1766, TRB, National Research Council, Washington, D.C.,2001, pp.
1-7.
10. Hills, J.F., D. Brien. The Fracture of Bitumens and Asphalt Mixes by Temperature Induced Stresses. Proceedings, Association of Asphalt Paving Technologists 35, 1996, pp. 292–309. 11. Ferry, J.D. Viscoelastic Properties of Polymers, 3rd Ed, Wiley, New York, 1980.
12. Masson, J.F., P. Collins, and P-P. Legare. Performance of Pavement Crack Sealants in Cold Urbana Conditions. Canadian Journal of Civil Engineering, vol. 26 No. 4, 1999, pp. 395-401.
13. Isacsson, U., X. Lu. Testing and appraisal of polymer modified road bitumens - state of the art. Materials and Structures/Materiaux et Constructions. Vol. 28, No. 177, 1995, pp.139-159.