Publisher’s version / Version de l'éditeur:
Vous avez des questions? Nous pouvons vous aider. Pour communiquer directement avec un auteur, consultez la première page de la revue dans laquelle son article a été publié afin de trouver ses coordonnées. Si vous n’arrivez pas à les repérer, communiquez avec nous à [email protected].
Questions? Contact the NRC Publications Archive team at
[email protected]. If you wish to email the authors directly, please see the first page of the publication for their contact information.
https://publications-cnrc.canada.ca/fra/droits
L’accès à ce site Web et l’utilisation de son contenu sont assujettis aux conditions présentées dans le site LISEZ CES CONDITIONS ATTENTIVEMENT AVANT D’UTILISER CE SITE WEB.
Architectural Engineering Institute Conference (AEI 2008) [Proceedings], pp. 1-10, 2008-09-25
READ THESE TERMS AND CONDITIONS CAREFULLY BEFORE USING THIS WEBSITE.
https://nrc-publications.canada.ca/eng/copyright
NRC Publications Archive Record / Notice des Archives des publications du CNRC :
https://nrc-publications.canada.ca/eng/view/object/?id=d005778a-c12b-42df-bdd8-34a9b2e18b45 https://publications-cnrc.canada.ca/fra/voir/objet/?id=d005778a-c12b-42df-bdd8-34a9b2e18b45
NRC Publications Archive
Archives des publications du CNRC
This publication could be one of several versions: author’s original, accepted manuscript or the publisher’s version. / La version de cette publication peut être l’une des suivantes : la version prépublication de l’auteur, la version acceptée du manuscrit ou la version de l’éditeur.
Access and use of this website and the material on it are subject to the Terms and Conditions set forth at
Numerical modeling of adhesive applied roofing systems for wind uplift resistance evaluation - a pilot study
http://irc.nrc-cnrc.gc.ca N u m e r i c a l m o d e l i n g o f a d h e s i v e a p p l i e d r o o f i n g s y s t e m s f o r w i n d u p l i f t r e s i s t a n c e e v a l u a t i o n - a p i l o t s t u d y
N R C C - 4 8 6 1 2
M u r t y , B . ; B a s k a r a n , B . A . ; T a n a k a , H .2 0 0 8 - 1 0 - 1 4
A version of this document is published in / Une version de ce document se trouve dans:
Architectural Engineering Institute Conference (AEI 2008), ASCE, Denver, Colorado, Sept. 25-27, 2008
The material in this document is covered by the provisions of the Copyright Act, by Canadian laws, policies, regulations and international agreements. Such provisions serve to identify the information source and, in specific instances, to prohibit reproduction of materials without written permission. For more information visit http://laws.justice.gc.ca/en/showtdm/cs/C-42
Les renseignements dans ce document sont protégés par la Loi sur le droit d'auteur, par les lois, les politiques et les règlements du Canada et des accords internationaux. Ces dispositions permettent d'identifier la source de l'information et, dans certains cas, d'interdire la copie de documents sans permission écrite. Pour obtenir de plus amples renseignements : http://lois.justice.gc.ca/fr/showtdm/cs/C-42
Numerical Modeling of Adhesive Applied Roofing Systems for Wind Uplift Resistance Evaluation - A Pilot Study
B. Murty,1 A. Baskaran,2 and H. Tanaka3 1, 3
PhD student and Professor, respectively, Department of Civil Engineering, University of Ottawa, Canada.
2
Senior Research Officer and Group Leader, Institute for Research in Construction, National Research Council of Canada, Canada. K1A OR6. Tel. +1-613-990 3616, Fax. +1-613-998 6802, E-mail: [email protected] (Corresponding Author)
Abstract
Adhesive Applied Roofing Systems (AARS) are compact roof systems that use cold adhesives to integrate their components. Differences in adhesive types and method of applications can influence the wind uplift performances of AARS. Full scale experimental studies have been conducted and it revealed that majority of failures occurred at the insulation level and its interface. Based on this observation, a simplified three-dimensional finite element (3D-FE) model is developed to assess the uplift resistance of AARS. However, at this stage, the modeling simulation does not incorporate the studies due to the independency effects (e.g. # of meshes, # of elements and type). The model is assumed as isotropic elastic materials consisting of three parts (insulation, adhesive and insulation). To benchmark the model, new testing specimens were fabricated and tested. The results showed good agreement in comparison with the model. Using the benchmarked model, the effects of the adhesive thickness and its methods of application were investigated. Overall stresses distributions were computed at each level of the models as an indicator of AARS performances. This paper presents the results from this ongoing numerical study. Keywords: Roof, AARS, 3D-FE Model, Failure, Adhesive, Insulation, Wind uplift
and Building
Introduction
Roof is a key component of the building envelope that provides an environmental separation between the indoor and outdoor environmental conditions thereby protect occupants from directly exposes to wind, sun, temperature, snow, rain, precipitation and other hazards. Adhesive Applied Roofing Systems (AARS) represent a new generation of Built-Up Roofing Systems (BURS) that utilize adhesives to integrate its components together (e.g. deck, vapour barrier, insulation board, cover board, membrane). Due to this integration technique, AARS can reduce common roof problems that would be related to moisture transports, air intrusions (Hens et al.
1995), thermal bridging and fastener penetrations (Phalen 1993). Presently the continuous development in roofing technology and products permit roofing manufactures to continually develop different types of AARS. The introduction of new components and application techniques could result in different levels of uplift performances. Consequently, when different components are used, the method of applications and the performances obtained would be different. Therefore these phenomena will vary AARS performances in term of their wind uplift resistances. Figure 1 illustrates typical roofing components used to form AARS.
Although AARS have been commercially in use in the North American roofing market, there is no existing test standard to quantify their wind uplift resistance performance. Recent investigation from the hurricane Charley identified major AARS’s wind uplift resistance failures (Graham, 2004). To study common AARS wind uplift resistance performances, a series of experimental investigation has been conducted and showed that most failures occurred at the insulation level, either at the insulation itself or/and at adhesive interface. Further information about the experimental investigation results (mock-up fabrication, testing protocols, failure mode and criteria, static and dynamic uplift rating performances) can be found in Baskaran et al 2007. Based on failure modes obtained from experimental investigation, a simplified numerical analysis model using finite element (FE) modelling technique aided by commercial ABAQUS software was developed. The model developed is considered as an early stage to further study AARS performance using a simplified FE model simulation. The results obtained from the modelling simulation are expected to help AARS roof designers to better understand AARS wind uplift performances in terms of the effect of various elements such as adhesive method of application, adhesive thickness, temperature, roof size and the present of joint insulation in the components. However, the present research only focuses on a development of the simplified model and its validation by using benchmarked experimental data. In addition, the benchmarked model was enhanced to investigate the effects of adhesive method of application and its thickness. This paper presents and discusses the results from these numerical studies.
Numerical Model Model limitation
The three dimensional finite element (3D-FE) model presented herein will work only with the assumption if the AARS weakest link happen to be either at the insulation itself or and at its adhesive interface as documented by Bas et al. 2007 and Current et al. 2008. The numerical analysis performed in the model is based on three dimensional linear elastic analysis simulations.
Modeling Detail
The model consists of three parts namely, Bottom Insulation, Adhesive and Top Insulation. All parts were modeled as three dimensional eight nodes continuum elements (C3D8I) having the same length and width, 305 mm x 305 mm (12 in x 12 in), but different thicknesses, 51 mm (2 in) , 2 mm (0.08 in) for the insulation and the
adhesive respectively. Figure 2 illustrates the detail of the model and the mechanical properties used for the FE simulation. The adhesive and insulation mechanical properties were extracted from Henry 2006 and Baskaran & Borujerdi 2001 respectively. The bottom insulation was fixed with no movement allowed (Encastre) and uniform pressure loads were applied in four steps at the top insulation surface while, the other edges of the three parts were released as shown in Figure 2. The adhesive and insulation parts were modeled as homogenous isotropic elastic material with the adhesive having 100 % contact with the two insulation surfaces at the interface. To simulate these aspects, tie constraints were used to establish connections between the three parts. The model has in total 108 numbers of elements and 654 nodes. The simulation was performed under three-dimensional linear elastic analysis using a static stress procedure provided in ABAQUS software. The AARS uplift performances are indicated in term of their stresses correspondence to four different steps load input.
Stress Concepts
Stresses in ABAQUS are measured in term of Cauchy (true) stresses. Cauchy's stress principle demonstrates that the state of stress at a point in a body is completely defined by the nine components of a second-order Cartesian tensor called the Cauchy stress tensor, given by
Where, , , and are the stress vectors associated with the planes perpendicular to the coordinate axis, ( xxσ =σx), (σyy=σy), and (σzz=σz) are normal stresses, and (σxy=τxy), ( xzσ =τxz), (σyx=τxy), (σyz=τyz), ( zxσ =τzx), and (σzy=τzy) are shear stresses.
The first index ( ijσ ) indicates the stress acts on a plane normal to the axis, and the second index ( ijσ ) denotes the direction in which the stress acts. A stress component is positive if it acts in the positive direction of the coordinate axes, and if the plane where it acts has an outward normal vector pointing in the positive coordinates direction. For the case where cross-sectional area is assumed constant during deformation under certain loads, the stress is called engineering stress or nominal stress. ABAQUS stress output considers that the change in cross-sectional are significant, therefore cross-sectional area at the deformation are used instead of the initial cross-sectional area. The true stresses in Model is calculated as follow, Where, is the nominal (engineering) strain, and is nominal (engineering) stress.
Benchmarked Experiment
A series of experiment have been conducted to benchmark the model. The test specimens consist of three parts (Insulation, Adhesive and Insulation) that have the same size with the model simulation (Fig. 2). Top and bottom insulations were 100% connected by using adhesive at the interface. In total six specimens were fabricated and cured for 28 days prior to testing. As shown on the right side of Figure 2, two plywood dummies were attached to the top and bottom insulation parts using adhesive. The dummies later will be used to attach the test specimens to the testing machine. The test was conducted using an Instron testing machine model 5566 and the specimens were loaded in tension at a rate of 5 mm/min. Figure 3 shows the test set-up used for the testing in comparison with the model simulation boundary condition.
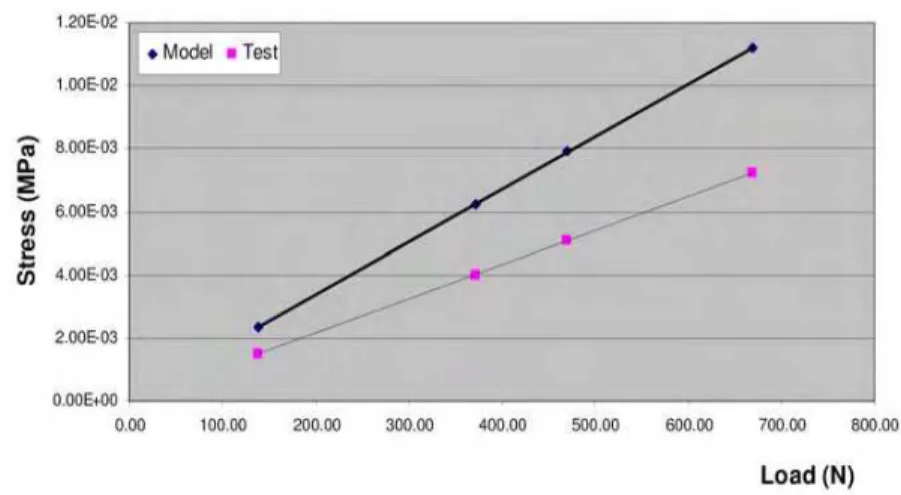
Model Validation
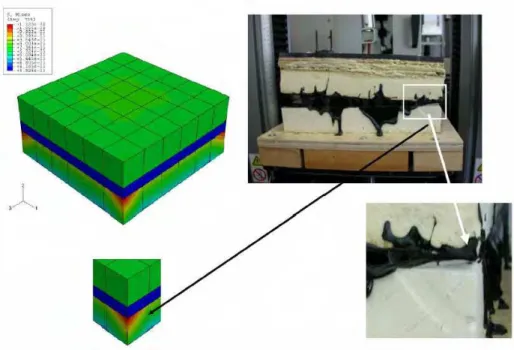
This section discusses the validation of the 3D-FE model developed with the benchmark experimental data. The validation of the model is indicated in term of stresses. The stresses obtained from the model were 2.33E-3 Mpa, 6.22E-3 Mpa, 7.94E-3 Mpa, 1.12E-2 Mpa for the input loads of 138 N, 372 N, 470 N and 670 N respectively. The indicated stresses were then compared to the stresses obtained from the benchmark experiment. The maximum stress for the benchmark experiment was calculated by dividing the average maximum load (After averaging maximum loads from the six specimens tested) with the surface plane area of the specimen (7.2E-3 Mpa). To plot a linear “Stress vs Load” curve for the benchmark experiment, three data points (three average loads) were randomly selected from the average test data (before the maximum load achieved). Adopting the same procedure for calculating the average maximum stress, three other stresses (1.48E-3 Mpa, 4E-3 Mpa and 5.06E-3 Mpa), were calculated correspondence to the three data points selected. Comparison of stresses between the model and the benchmarked experiment are presented in Figure 4. Result shows that the model was able to simulate the test data performance (Figure 4) as well as failure mode (Figure 5). Typical model stress distribution contour diagram indicated in Figure 5 (left side) shows that maximum stresses are concentrated at the corners of insulation part while at the test, failure mode happen at the corner of insulation facer (Right side). This aspect illustrates that the model predict well the test failure performances. However, model was overestimated maximum capacity of the test data as result of stress distribution complexities at the interface of test specimen that depends mainly on adhesive application and its performance. For example, during the failure mode investigation, it was noticed that the adhesive surface at the interface did not have the same thickness and the presence of adhesive bubbles were observed. These phenomena will definitely reduce the performance capacity of the test specimens due to the fact that there were not 100 % covered by adhesives, despite the precautions have been taken during test specimen preparations. Nevertheless, in this study, the authors are not interested in predicting the capacity at the maximum load but rather the study
focuses investigate the trend performance of the specimen at the elastic stage. For this reason, the model was enhanced and used to further study the effect of adhesive method of application and thickness at 50% of its maximum capacity performance. It should be noted that the current modeling analysis does not consider the independency effects such as number of meshes, number of element and type. However, these independency effects will later be addressed on the next stage of the research.
Effect of Adhesive Method of Application
In field, two methods of adhesive application (fully coated (100% adhesive coverage) method and ribbon (beading) method) are used. The selection on using either one of the methods depends on the manufacturer’s specifications. Regardless which method is being used, it can contribute to different stress performance and behavior of AARS due to reduction in the adhesive contact area. In addition to the method of application, adhesive mechanical and physical properties vary from one roof manufacturer to another. This aspect also affects the AARS performance. Hence, a study to investigate the effect of the adhesive application methods is needed. One ways to accomplish this would be by using FE model simulation.
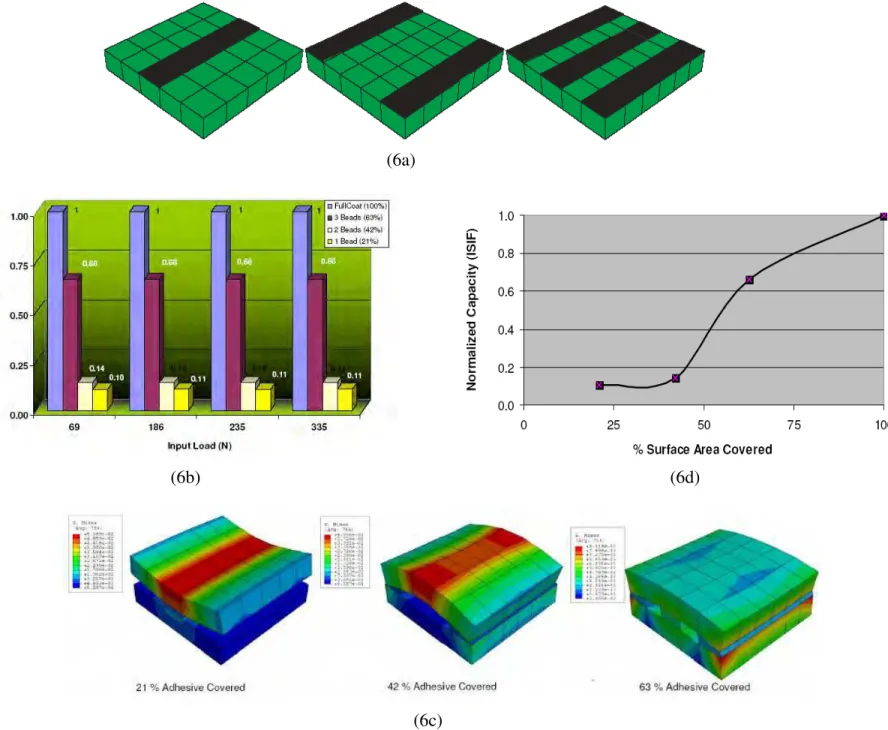
Based on the previously developed FE model (100% adhesive coverage), three other models were created to investigate the effect of common method of adhesive applications in term of one, two and three beading applications that represents 21%, 42% and 62% areas reduction respectively. The three models utilized the same boundary condition applicable to the previous model as well as the size of the insulation parts and element type (C3D8I) for the simulation. The change in the three models was made in terms of adhesive (bead) width because of beading application. The beading width of 63.5 mm (2.5 in) was used instead of 305 mm (12 in) while length and thickness remained the same. Figure 6a illustrates un-deformed geometry diagrams of the three models that show different beading applications. Three-dimensional finite element linear elastic analyses were conducted for the four models (the new three models + previous model). Each analysis consists of four loading steps with the pressure input on each step being 50% lower in comparison with the previous model simulation. This condition was taken in order to ensure that the obtained stress performance remains in an elastic range.
Figure 6b shows the system ability performance due to the effects of four different types of adhesive application (100%-Fully Coated, 62% area covered-3 Beads, 42% area covered- 2 Beads and 21% area covered – 1 Bead). The stresses output results from the three beading application models were normalized with the fully coated adhesive application model. These normalized stresses are plotted in Y axis of Figure 6b while the X axis illustrates the performance in term of each load increment inputs. The figure shows that the system ability performance will be nonlinearly reduced as the adhesive contact area is reduced. The difference of system ability performance reduction between one bead application and two beads application is roughly about 30 to 40%. The system performances of the three bead application decreased
significantly (about 4 to 5 times) compared to one or two beads application. These situations occurred because of the stress distribution phenomena that were caused by system response due to different placement of adhesive application. Figure 6c illustrates the stress distribution contour diagrams for the models at the 335 N input loads. Figure 6d presents the average normalized stress from four different input loads. This curve can be used to predict approximately the reduction in performance due to the difference of adhesive application methods if two extreme cases are known, fully coated and one bead application.
Effect of Adhesive Thickness
Finding the effect of adhesive thickness is crucial to provide clear understanding of its impact on uplift system capacity performances. To achieve this, new models were created based on the fully coated (100% adhesive coverage) FE model. All variables, such as boundary condition, type of analysis and element used, remained the same as before. Modifications were made only with respect to the adhesive thicknesses. Nine different thicknesses (0.5 mm, 1 mm, 2 mm, 3 mm, 4 mm, 5 mm, 10 mm, 20 mm and 30 mm) were selected and used in the model simulations. Stress output results are presented in the Figure 7. Results indicate that there are no significant differences in stress level between the 0.5 mm to 5 mm adhesive thicknesses. A significant difference in the level of stress was noticed in the case of adhesive thicknesses ranging between 5 mm and 30 mm. The numerical study suggests that adhesive thickness used in field application should not be more than 5 mm because of adhesive rigidity decreases when larger thickness is used. This actually reflecting the fact that field adhesive thickness is normally within this range. It must be noted that in relation to the interpretation of these test results that this analysis was only performed using one type of adhesive. As the fact that Young Modulus (E) and Poisson ratio (ν) can be different between one manufacture to another, this will provide variation in term of nominal stress value obtained from the model simulation. Therefore it is important to emphasize that the study here does not attempt to evaluate nominal stress value of the specific adhesive properties rather than how it affects the overall uplift capacity performance when different adhesive thicknesses are used by roofing manufactures in field application.
Conclusions
This ongoing numerical analysis study provides some useful information that later can be used to further numerically analyse AARS uplift capacity performances. There are several conclusions that can be drawn from this study as follows,
1. A preliminary simplified three dimensional finite element model was established and verified using benchmarked experiment. It is proven that the simplified model can be used to predict AARS uplift performances if the weakest link of AARS lies on insulation and its adhesive interface. At a later stage, another study for the model will be performed to account for dependency effects due to number of meshes, number of element and type.
2. The effect of adhesive method of application have been illustrated by using the enhancement of the simplified FE model and a curve (Fig. 6d) to approximately predict the AARS uplift performances in term of its stress has also been developed. However, in the future study this curve will need to be verified in term of other effects such as surface temperature, roof size and existence of joints in insulation components.
3. The effect of adhesive thickness on AARS uplift performances has also been studied and it is proposed that the thickness used at the field application should not be more than 5 mm.
Acknowledgement
The authors acknowledge financial support provided by the Natural Sciences and Engineering Research Council (NSERC) project under Grant # CDR 305819, Roofing manufacturers: BAKOR Inc., IKO Industries Ltd, SOPREMA Inc., TREMCO Inc. and Roofing Contractor Association of British Columbia (RCABC).
References
Abaqus (2007), User’s manual, v 6.7.-1. Hibbitt, Karlsson and Sorensen, inc., Pawtucket, RI .
Baskaran, B. A., Murty, B., and Tanaka, H.(2007), “Pilot Study on Wind Uplift Resistance of Adhesive Applied Low Slope Roofing Systems”, Journal of ASTM International, Vol. 4 No. 10, West Conshohocken, USA
Baskaran, A. and Borujerdi, J. (2001), “Application of Numerical Models to Determine Wind Uplift Ratings of Roofs,” Journal of Wind and Structures, 4, (3), June, pp. 213-226.
Current, J., Murty, B., Wu, J., Baskaran, B.A., and Tanaka, H. (2008),”Wind Uplift Resistance Data for Adhesive Applied Roofing Systems,” Research Report, National Research Council Canada; pp 1- 236.
Graham, M. (2004), “Hurricane Charley: A preliminary report”, Professional Roofing (Magazine), October Edition.
Hens, H., Janssens, A., and Silberstein, A.(1995), “A Study of Parameters Influencing the Hydric Behavior of Insulated Sloped Roofs Without Air Barrier,” Thermal Envelopes Conference, Vol. 1, pp. 729–739.
Henry Company Canada Inc. (2006),” Young’s Modulus and Poisson’s Ratio for Bakor MBA Gold and Bakor Thermostick 880-33” Test Report, July 6th.
Phalen, T. E., Jr.(1993), Design & Analysis of Single Ply Roof Systems, Prentice Hall Publishing, Englewood Cliffs, NJ; pp. 1–624.
Figure 1.
Figure 3. Typical Experimental Setup Figure 4. Stresses Performances – Model vs Exp. Figure 1. AARS Typical Isometric Diagram
Figure 2. Modelling Detail and Properties
(6a)
9 of 10
Figure 6. a) Undeformed Geometry Diagrams, b) Normalized Stress vs Input Load, c) Stresses Contour Diagrams for the Three Beading Applications and d) Average Normalized Stress vs % Surface Area Covered.
(6b) (6d)
10 of 10
Figure 7. Adhesive Thickness vs Stress (at 669 N Input Load) Figure 5. Failure Phenomena – Model vs Exp.