Publisher’s version / Version de l'éditeur:
Applied and environmental microbiology, 76, 15, pp. 5105-5112, 2010
READ THESE TERMS AND CONDITIONS CAREFULLY BEFORE USING THIS WEBSITE. https://nrc-publications.canada.ca/eng/copyright
Vous avez des questions? Nous pouvons vous aider. Pour communiquer directement avec un auteur, consultez la première page de la revue dans laquelle son article a été publié afin de trouver ses coordonnées. Si vous n’arrivez pas à les repérer, communiquez avec nous à PublicationsArchive-ArchivesPublications@nrc-cnrc.gc.ca.
Questions? Contact the NRC Publications Archive team at
PublicationsArchive-ArchivesPublications@nrc-cnrc.gc.ca. If you wish to email the authors directly, please see the first page of the publication for their contact information.
NRC Publications Archive
Archives des publications du CNRC
This publication could be one of several versions: author’s original, accepted manuscript or the publisher’s version. / La version de cette publication peut être l’une des suivantes : la version prépublication de l’auteur, la version acceptée du manuscrit ou la version de l’éditeur.
For the publisher’s version, please access the DOI link below./ Pour consulter la version de l’éditeur, utilisez le lien DOI ci-dessous.
https://doi.org/10.1128/AEM.00183-10
Access and use of this website and the material on it are subject to the Terms and Conditions set forth at
Detection of microcystin-producing cyanobacteria in Missisquoi Bay,
Quebec, Canada, using Quantitative PCR
Fortin, Nathalie; Aranda-Rodriguez, Rocio; Jing, Hongmei; Pick, Frances;
Bird, David; Greer, Charles W.
https://publications-cnrc.canada.ca/fra/droits
L’accès à ce site Web et l’utilisation de son contenu sont assujettis aux conditions présentées dans le site LISEZ CES CONDITIONS ATTENTIVEMENT AVANT D’UTILISER CE SITE WEB.
NRC Publications Record / Notice d'Archives des publications de CNRC:
https://nrc-publications.canada.ca/eng/view/object/?id=bd16fcb8-7d4f-4340-a5cc-ed1dc8c610cc
https://publications-cnrc.canada.ca/fra/voir/objet/?id=bd16fcb8-7d4f-4340-a5cc-ed1dc8c610cc
0099-2240/10/$12.00 doi:10.1128/AEM.00183-10
Copyright © 2010, American Society for Microbiology. All Rights Reserved.
Detection of Microcystin-Producing Cyanobacteria in Missisquoi Bay,
Quebec, Canada, Using Quantitative PCR
䌤
Nathalie Fortin,
1Rocio Aranda-Rodriguez,
2Hongmei Jing,
4Frances Pick,
3David Bird,
4and Charles W. Greer
1*
National Research Council Canada, Biotechnology Research Institute, Montreal, QC, Canada1; Environmental Health Center,
Health Canada, Ottawa, ON, Canada2; Biology Department, University of Ottawa, Ottawa, ON, Canada3; and
Biological Sciences, University of Quebec at Montreal, Montreal, QC, Canada4
Received 25 January 2010/Accepted 8 June 2010
Toxic cyanobacterial blooms, as well as their increasing global occurrence, pose a serious threat to public health, domestic animals, and livestock. In Missisquoi Bay, Lake Champlain, public health advisories have been issued from 2001 to 2009, and local microcystin concentrations found in the lake water regularly exceeded the Canadian drinking water guideline of 1.5 g literⴚ1
. A quantitative PCR (Q-PCR) approach was developed for the detection of blooms formed by microcystin-producing cyanobacteria. Primers were designed for the -ketoacyl synthase (mcyDKS) and the first dehydratase domain (mcyDDH) of the mcyD gene, involved in
microcystin synthesis. The Q-PCR method was used to track the toxigenic cyanobacteria in Missisquoi Bay during the summers of 2006 and 2007. Two toxic bloom events were detected in 2006: more than 6.5 ⴛ 104
copies of the mcyDKSgene ml ⴚ1
were detected in August, and an average of 4.0 ⴛ 104
copies mlⴚ1
were detected in September, when microcystin concentrations were more than 4 g literⴚ1
and approximately 2 g literⴚ1
, respectively. Gene copy numbers and total microcystin concentrations (determined by enzyme-linked immu-nosorbent assay [ELISA]) were highly correlated in the littoral (r ⴝ 0.93, P < 0.001) and the pelagic station (r ⴝ 0.87, P < 0.001) in 2006. In contrast to the situation in 2006, a cyanobacterial bloom occurred only in late summer-early fall of 2007, reaching only 3 ⴛ 102
mcyDKScopies ml ⴚ1
, while the microcystin concentration was barely detectable. The Q-PCR method allowed the detection of microcystin-producing cyanobacteria when toxins and toxigenic cyanobacterial abundance were still below the limit of detection by high-pressure liquid chromatography (HPLC) and microscopy. Toxin gene copy numbers grew exponentially at a steady rate over a period of 7 weeks. Onshore winds selected for cells with a higher cell quota of microcystin. This technique could be an effective approach for the routine monitoring of the most at-risk water bodies.
Toxic cyanobacterial blooms, as well as their increasing global occurrence, pose a serious threat to human health, do-mestic animals, and livestock. The frequency and severity of bloom events continue to rise, most probably as a direct result of increased nutrient loading of water systems worldwide. The number of lakes in Quebec, Canada, affected by blooms of 2 ⫻ 104
cells ml⫺1
or more has been increasing from 21 (2004) to 28 (2005), 62 (2006), 157 (2007), 138 (2008), and 150 (2009). Government agencies are under tremendous pressure to cope with escalating demands for water analysis, specifically, for cyanotoxins.
In Missisquoi Bay, Lake Champlain, public health advisories have been issued from 2001 to 2009 resulting in the closure of several beaches and periodic no-drinking warnings for the wa-ter. These advisories forbid any direct contact with the lake water by both people and animals because of the presence of cyanotoxins. The economic impact around the lake has been substantial, with revenues sometimes falling by 40 to 80% (20). For the past 8 years, microcystin (MCYST)-producing cya-nobacterial genera have composed a major part of the bacte-rial community in Missisquoi Bay during both the summer and
the fall. To date, five species known to produce toxins based on the literature (2) have been identified in the lake, including species of Microcystis and Anabaena (27).
All species with microcystin-producing strains also include related strains that lack the ability to produce this toxin. The nonproducing strains cannot be differentiated by traditional microscopy or ribosomal gene sequences (15). Reliable tools to detect and characterize toxin-producing cyanobacteria are re-quired. Enzyme-linked immunosorbent assay (ELISA) and high-pressure liquid chromatography (HPLC) are currently the most widely used techniques to evaluate whether toxins are present in water samples. The risk assessment response to the increasing occurrence of cyanotoxins has been seriously con-strained due to the limited number of available standards and the limited analytical capability of some laboratories. At least 89 microcystin analogues have been characterized (35), but fewer than 10 reference standards are currently available.
The development and validation of increasingly sensitive, specific, and reliable molecular tools will contribute to the next generation of monitoring approaches. The detection and quan-titation of specific target genes, such as those involved in the synthesis of toxins in cyanobacteria, are the cornerstone of new techniques to identify, monitor, or profile specific targets in environmental samples. These approaches are in general less expensive and faster than the currently available chemical as-says and do not rely on reference standards.
The structure of the microcystin biosynthesis cluster of two * Corresponding author. Mailing address: National Research
Coun-cil Canada, Biotechnology Research Institute, 6100 Royalmount Ave., Montreal, QC H4P 2R2, Canada. Phone: (514) 496-6182. Fax: (514) 496-6265. E-mail: charles.greer@cnrc-nrc.gc.ca.
䌤Published ahead of print on 18 June 2010.
5105
NRCC 53334
strains of Microcystis aeruginosa (17, 18, 31), Planktothrix
agar-dhii NIVA CYA 126/8 (3), and Anabaena sp. strain 90 (28) which encodes the nonribosomal peptide synthetase-polyketide synthase enzyme complex has been elucidated. The
mcygene cluster is located on the chromosome and contains 10 genes (mcyA to mcyJ). The two polyketide synthase modules of
mcyG and mcyE, together with the two polyketide synthase modules of mcyD, are responsible for the synthesis of the unique Adda moiety of microcystins. The Adda side chain is largely responsible for the toxicity through protein phos-phatase inhibition (7, 8, 12).
The number of water bodies affected by cyanobacterial blooms has been increasing worldwide, and scientists have designed primers for the various genes involved in the biosyn-thesis of microcystins. The mcyD gene has been used in con-ventional PCR for phylogenetic studies (16, 22, 29) and as a target to characterize cyanobacterial blooms in Lakes Ontario (11) and Erie (19). The mcyE gene has also been targeted to design genus-specific primers (23, 24, 33) and universal prim-ers encoding the aminotransferase domain of various genera of cyanobacteria (4, 13). All of these primers generated PCR fragments that were larger than the recommended size for quantitative PCR (Q-PCR) (100 to 200 bp).
A Q-PCR technique, the Taq nuclease assay, was developed by Rinta-Kanto and colleagues (25, 26) to study the distribu-tion and abundance of toxic Microcystis blooms in western Lake Erie. In their first study, the mcyD probe was highly specific to Microcystis species but failed to detect the mcyD gene in one of the samples that had a detectable concentration of microcystin in the water. Other microcystin-producers, such as Anabaena and Planktothrix, were identified in that sample and were likely responsible for toxin production.
The number of gene sequences related to microcystin bio-synthesis in the databases has been increasing rapidly since the beginning of 2000. The objectives of this study were to develop a rapid, Q-PCR-based technique for detecting and monitoring the dynamics of microcystin-producing cyanobacteria and to determine the correlation between toxigenic cells and toxin concentration. The mcyD gene was selected as the specific target for characterizing cyanobacterial blooms and applied in Missisquoi Bay, Lake Champlain, during the summers of 2006 and 2007. Oligonucleotide primers were designed based on the alignments of all 50 mcyD nucleotide sequences available in GenBank as of March 2006 and were verified in December 2009. The alignments revealed that the polyketide synthase sequences were divided into three major clusters: some of the submitted sequences encoded the first dehydratase domain, others were from one of the -ketoacyl synthases and the third group of sequences encoded part of both the ketoacetyl syn-thase and the acetyltransferase domains. Primers were de-signed to create PCR fragments from two different regions of the mcyD gene. These fragments were cloned to create a stan-dard curve for absolute quantification. This strategy was cho-sen to ensure that the quantification of cells carrying the target gene would be performed with a standard curve that originated from a single gene copy.
MATERIALS AND METHODS
Sampling.Integrated water samples were collected in 2006 and 2007 in Mis-sisquoi Bay, Lake Champlain, from two different locations in Philipsburg
repre-senting littoral (45°02.380⬘N, 73°04.773⬘W) and pelagic (45°02.363⬘N, 73°05.802⬘W) sites over the whole growing season between mid-May and the end of October (biweekly). Integrated water samples were collected with a peristaltic pump from all depths of the euphotic zone (this lake is unstratified) in a clean polypropylene bottle. Water samples for pigment and toxin analysis were col-lected on 47-mm Whatman 934-AH filters (Whatman, Inc., Florham Park, NJ). Phytoplankton subsamples (100 ml) for enumeration were preserved with 0.5 ml of Lugol’s iodine. Counts were performed using an inverted microscope by the Utermohl method (32).
Extraction for toxin analyses.Water samples (1 liter) were stored at 4°C until filtered on 1.2-m grade GF/C glass microfiber membranes within 5 h of sam-pling. The membranes were kept frozen at ⫺20°C until processed. Filters were extracted by accelerated solvent extraction (ASE) according to the procedure described by Aranda-Rodriguez et al. (1). Briefly, each filter containing the cyanobacteria was placed in an 11-ml stainless steel ASE cell which was then filled with hydromatrix beads (Varian, Palo Alto, CA). Extraction took place in an ASE 200 (Dionex Co., Oakville, Canada) with 2 cycles of 5 min of static extraction at 2,000 lb/in2and 80°C using 75% methanol. Extracts (27 ml) were
spiked with 50 l formic acid and evaporated to dryness using a Zymark Tur-bovap LV concentrator (Caliper Life Science, Hopkinton, MA) and reconsti-tuted with 1 ml of 50% methanol for further analysis.
HPLC-PDA analysis.The chromatographic separation of extracts was per-formed using a Shimadzu HPLC system (Shimadzu, Kyoto, Japan) with a Zorbax SB-C18column (250 mm by 4.6 mm, 5-m particle size). The mobile phase and
eluting gradient program followed that described by Aranda-Rodriguez et al. (1). Detection was achieved with a PD40 photodiode array (PDA) detector (Dionex), UV spectra were acquired from 200 to 300 nm, and data were recorded at 238 nm. Positive microcystin analogue peak confirmation was obtained when the retention times matched those of the standards (RR, YR, LR, LA, LW, and LF) and had the characteristic UV spectra.
ELISA.Based on the HPLC-PDA results, samples were diluted with deionized water to obtain a final concentration within the calibration range of the kit. Tests were performed using an Envirologix QuantiPlate test kit for microcystins (En-virologix, Portland, ME), following the manufacturer’s instructions. Absorbance was measured at 450 nm/630 nm using a Multiskan spectrum (Thermo Electron Co., Vantaa, Finland). The detection limit of the ELISA kit was 0.175 g liter⫺1.
Large volumes of water were filtered (up to 1 liter) to ensure that the samples would be within the detection limit. Based on a 1-liter volume, samples with microcystin concentrations equal to or above 0.175 pg ml⫺1would fall within the
detection limit.
Liquid chromatography-tandem mass spectrometry (LC–MS-MS) analysis.
The chromatographic separation of extracts was performed using a Finnigan Surveyor Plus HPLC system (Thermo Electron Corporation, San Jose, CA) equipped with a Zorbax 300SB-C18column (150 mm by 2.1 mm, 5-m particle
size). The mobile phase consisted of 0.1% formic acid in 5% aqueous acetonitrile (mobile phase A) and 0.1% formic acid in acetonitrile (phase B). Solvents were degassed online, and the column temperature was maintained at 30°C. The elution gradient started with 100% phase A for 2 min, followed by an 8-min linear gradient to 100% B, then a 2-min hold at 100% phase B, and returned back to 100% phase A in 3 min, at a flow rate of 200 l min⫺1. The system was
equilibrated for 5 min at the initial conditions before the next injection. The sample injection volume was 10 l.
Mass spectrometric experiments were performed using a Thermo Finnigan TSQ Quantum Ultra EMR triple quadrupole mass spectrometer (Thermo Elec-tron Corporation). The samples were analyzed in positive-ion electrospray ion-ization, using the selective reaction monitoring (SRM) mode. Xcalibur version 2 was used for data acquisition and processing. The following SRM transitions (m/z) for microcystin were monitored: MCYST3LR (9953135), MCYST3LA (9103776), MCYST3RR (5203135), MCYST3LF (9863852), MCYST3LW (10253446), and MCYST3YR (10453135).
DNA extraction.To produce the Q-PCR standard curves, DNA was extracted from pure cultures of Microcystis aeruginosa UTCC 299 and UTCC 300 (Uni-versity of Toronto, Culture Collection) using the method of Hisbergues et al. (10) with the following modifications: 50 ml of culture was filtered on a 0.2-m modified polyvinylidene fluoride membrane (Millipore Corporation, Bedford, MA). The membrane was transferred to 5 ml of lysis buffer containing 5 mg ml⫺1
of lysozyme and incubated for 1 h in a 37°C incubator with gentle mixing on a Roto-Torque rotator (Cole-Parmer, Anjou, Canada). After the proteinase K-SDS treatment, the membrane was removed from the tube and the solution was extracted with one volume of chloroform/isoamyl alcohol (24:1). RNase A was added to the supernatant at a final concentration of 100 ng l⫺1. The solution
was incubated at 37°C for 1 h and then extracted once with phenol/chloroform/ isoamyl alcohol (25:24:1) and once with chloroform/isoamyl alcohol (24:1). DNA
was precipitated overnight at ⫺20°C in 1 volume of cold 2-propanol and then centrifuged at 12,100 ⫻ g for 30 min. The pellet was washed with 70% (vol/vol) ethanol, air dried, and resuspended in TE (10 mM Tris-Cl, 1 mM EDTA, pH 8). Water samples (100 ml) were stored at 4°C until filtered on 0.2-m hydrophilic polyethersulfone membranes (PAL Corporation, Ann Arbor, MI) within 24 h of sampling. The membranes were kept frozen at ⫺20°C until processed. DNA extraction was performed by transferring the membrane to 5 ml of lysis buffer (50 mM Tris-Cl, 50 mM EDTA, pH 8, 50 mM sucrose, 0.5% SDS, 100 mM NaCl) containing 5 mg ml⫺1of lysozyme. Samples were incubated for 1 h in a 37°C
incubator with gentle mixing on a Roto-Torque rotator (Cole-Parmer). After the addition of 0.5% SDS and 0.4 mg ml⫺1proteinase K, the samples were incubated
on the rotator (37°C) for another 2 h. The membrane was dissolved with one volume of prewarmed phenol/chloroform/isoamyl alcohol (25:24:1) following an incubation of 10 min at 56°C. The samples were centrifuged for 5 min at 3,823 ⫻
g. One volume of chloroform/isoamyl alcohol (24:1) was added to the superna-tant. The mixture was incubated for 10 min at 56°C and then centrifuged as before. RNase A was added to the supernatant at a final concentration of 100 ng l⫺1. The samples were incubated for 1 h at 37°C and then subjected to one
phenol/chloroform/isoamyl alcohol (25:24:1) extraction followed by one chloro-form/isoamyl alcohol (24:1) extraction. The DNA was precipitated overnight with 1 volume of cold 2-propanol and then centrifuged at 12,100 ⫻ g for 30 min. The pellet was washed with 70% (vol/vol) ethanol, air dried, and resuspended in TE (pH 8).
PCR amplification and cloning.Primers were designed for the -ketoacyl syn-thase and the first dehydratase subunits of the mcyD gene (mcyDKSand mcyDDH,
respectively), which are essential for the biosynthesis of microcystin (7, 8, 12). ClustalW multiple alignment analyses (30) were performed with all of the mcyD sequences available in GenBank as of March 2006, to identify the highly conserved regions of the various subunits. The primers designed for the -ketoacyl synthase were mcyDKSF1, 5⬘-TGG-GGA-TGG-ACT-CTC-TCA-CTT-C-3⬘, and mcyDKSR1,
5⬘-GGC-TTC-AAC-ATT-CGG-AAA-ACG-3⬘, which generated a fragment of 107 bp. The primer sequences for the first dehydratase subunit were mcyDDHF1,
5⬘-TAC-GGG-AGT-AAC-TTT-CGG-CTC-A-3⬘, and mcyDDHR1,
5⬘-ACA-AGC-ATC-TAA-CAT-AGC-GGG-A-3⬘, which generated a PCR fragment of 129 bp. The
mcyDKSand mcyDDHprimers were designed to be perfect matches with Microcystis
aeruginosastrain UTCC 299 and Microcystis aeruginosa UTCC 300, respectively. The PCR mixture (50 l) contained 25 ng of genomic DNA from Microcystis
aeruginosaUTCC 299 or UTCC 300, 50 pmol of each oligonucleotide primer, 2.5 units of Taq DNA polymerase (GE Healthcare, Baie d’Urfe, Canada), 5 l of 10⫻ Taq polymerase buffer (100 mM Tris-Cl, pH 9.0, 500 mM KCl, 15 mM MgCl2), 1 mM MgCl2, 8 l of 1.25 mM deoxynucleoside triphosphates (200 M
[each] dATP, dGTP, dCTP, and dTTP), and 0.13 g l⫺1bovine serum albumin
(BSA). Prior to the addition of Taq DNA polymerase, the samples were dena-tured for 5 min at 96°C. For PCR cycling, denaturation was carried out at 94°C for 1 min, the annealing time was 1 min at 58°C, and primer extension was carried out at 72°C for 1 min. Thirty cycles were performed with a final extension at 72°C for 10 min. The PCR products were purified with a Montage PCR kit (Millipore) and quantified by SYBRSafe staining (Qiagen, Mississauga, Can-ada) and spot densitometry using a ChemiImager (Alpha Innotech Corpora-tion, San Leandro, CA).
The amplification products were ligated into the pDrive cloning vector (Qiagen) and transformed with XL1 Blue competent cells following the method described by the manufacturer (Stratagene, La Jolla, CA). Transformants were screened on LB plates containing 100 g ml⫺1ampicillin, 20 g ml⫺15-bromo-4-chloro-3
indolyl--D-galactoside (X-Gal), and 0.25 mM isopropyl--D-thiogalactoside
(IPTG). Recombinant plasmid DNA was extracted using a QIAprep spin mini-prep kit (Qiagen).
Standard curve for mcyD quantification and Q-PCR analyses.Standard curves showing the relationship between the mcyD copy numbers and threshold cycles (CT) were generated with serial dilutions of plasmid DNA containing part of the
mcyDKSor mcyDDHgene. Prior to quantification, the plasmids were linearized
with the restriction endonuclease SmaI. The plasmid DNA concentrations were evaluated by fluorescence using PicoGreen (Invitrogen, Burlington, ON, Can-ada) and a Safire microplate detection system (Tecan, Ma¨nnedorf, Switzerland). The concentrations were also validated on an agarose gel by SYBRSafe staining and spot densitometry with a serial dilution of the 1-kb DNA ladder from MBI Fermentas (Amherst, NY).
Tenfold serial dilutions of plasmid DNA in triplicate were used to establish the mean CTvalues. The plasmid DNA was diluted in 5 mM Tris-Cl, pH 8.0. The
standard curves were prepared with dilutions ranging from 2.31 ⫻ 101to 2.31 ⫻
106copies of the mcyD
KSgene l⫺1and from 2.29 ⫻ 101to 2.29 ⫻ 106copies of
the mcyDDHgene l⫺1. To evaluate the mcyD gene copy number of the plasmid
DNA, the number of picomoles of plasmid per ng of DNA was calculated using
the following formula: 1 ⫻ 106pg g⫺1⫻1 pmole 660 pg⫺1⫻1 plasmid size⫺1.
The DNA gene copy per ng of total DNA was then determined as follows: pmole plasmid ng⫺1DNA ⫻ 6.022 ⫻ 1023molecules mol⫺1(Avogadro constant) ⫻ 1 ⫻
10⫺12moles picomole⫺1. Amplification and detection were performed using a
Rotor Gene 3000 instrument with software version 6.0 (Corbett Research, Mort-lake, NSW, Australia) in a 20-l volume containing 4 mM MgCl2, 0.8 M of both
primers, 5 l of SYBR green from a QuantiTect PCR kit (Qiagen), and 5 l of template DNA. The amplification conditions were as follows: preheating at 95°C for 10 min and then 45 cycles of 58°C for 15 s and 72°C for 20 s. Fluorescence was measured at the end of each cycle at 72°C. The PCR efficiency and the correla-tion coefficient of both the mcyDKSand the mcyDDHstandard curve were 0.95
and 0.999, respectively.
The limit of detection (LOD) was determined for the Q-PCR assay used in this study. Briefly, Q-PCRs of a 2-fold dilution series of linearized plasmid containing the gene fragment of interest were performed in 6 replicates, starting with a concentration of approximately 1,000 gene copies/reaction mixture volume to a concentration of less than 1 gene copy/reaction mixture volume. The results were used to determine the number of copies that is necessary for reliable detection of the gene using the LOD tool from GenEx Pro software (version 4.4.2; MultiD Analyses AB, Go¨teborg, Sweden). When a cutoff value of 33 cycles and a level of confidence of 95% were applied, the LOD was 2.23 copies l⫺1of reaction
mixture.
The mcyD gene copy numbers of Missisquoi Bay water samples were deter-mined by Q-PCR immediately after DNA quantification by PicoGreen. The DNA concentration was also verified on an agarose gel by SYBRSafe staining and spot densitometry with a serial dilution of lambda DNA (GE Healthcare). The DNA was diluted to 5 to 10 ng l⫺1(100) with 5 mM Tris-Cl, pH 8.0, prior
to preparing the 10-fold serial dilutions. The water samples were analyzed in duplicate as 100to 10⫺2or 10⫺1to 10⫺3dilution series. In each run, triplicates
of the 10⫺5and/or 10⫺6plasmid DNA and 5 mM Tris-Cl, pH 8.0, were used as
positive and negative controls, respectively. The water sample CTvalues were
determined by importing the standard curve and adjusting it to the CTvalues of
the 10⫺5or 10⫺6plasmid DNA standard used as the positive control.
Statistical analysis.Pearson correlation coefficients (r) between the mcyDKS
or mcyDDHgene copy number and the microcystin concentration were calculated
with the statistical software R, version 2 (R Project for Statistical Computing). Predictive regression models relating the mcyDKSgene copy number to the
microcystin concentration and the microscope-based cell counts were developed using SAS JMP 8. Data were transformed to logarithms when necessary to meet the assumptions of regression and to derive exponential growth rates.
RESULTS
Q-PCR analysis with mcyDKSin Missisquoi Bay in 2006 and
2007. Copies of mcyDKSwere detected by Q-PCR on every
sampling date at both stations during the summer of 2006: in the littoral station, more than 6.5 ⫻ 104
copies of the mcyDKS
gene ml⫺1
were detected in August, and an average of 4.0 ⫻ 104
copies ml⫺1
were detected in September; the microcystin concentrations were more than 4 ng ml⫺1
and approximately 2 ng ml⫺1
, respectively (Fig. 1A). Although water samples from the pelagic zone could not be collected in mid-August because of strong winds, two bloom events (⬎2 ⫻ 104
cells ml⫺1
) were also identified in that station but with a different trend: the toxin concentrations were significantly lower than the mcyDKS
gene copy number (Fig. 1B). Prior to the first bloom event, 3.0 ⫻ 104
copies of the mcyDKSgene ml ⫺1
were detected when the microcystin concentration was only 0.5 ng ml⫺1
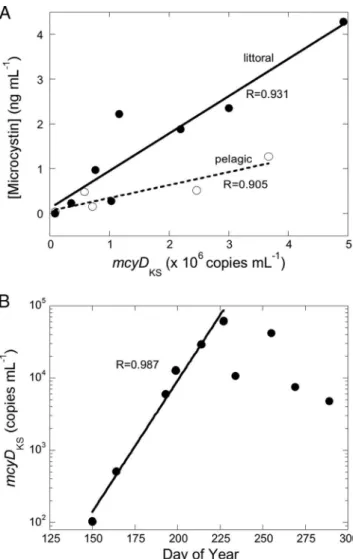
. There was a good correlation at both stations between gene copy numbers and microcystin concentrations (for ELISA results, r ⫽ 0.93,
P ⬍0.001 [littoral] and r ⫽ 0.87, P ⬍ 0.001 [pelagic]; for HPLC results, r ⫽ 0.89, P ⬍ 0.001 [littoral and pelagic]).
The amount of toxin per gene copy increased steadily with time (Fig. 2A). There was a highly significant correlation be-tween gene copy number and microcystin concentration from the end of May until mid-October (for ELISA results, r ⫽ 0.93,
look at the Q-PCR results showed that there was an extended, nearly perfect exponential increase in gene copy numbers from late spring to mid-summer 2006 (Fig. 2B). The exponential growth corresponded to an increase of a factor of exp(0.072)
mcyDKScopies per day, or approximately 7.5% per day, from
May 30 (day 150) to August 15 (day 227), when the maximum was reached, a period of uninterrupted growth of 77 days.
In contrast to 2006, in 2007, cyanobacterial blooms were not observed until the month of September. A level 1 public health advisory was issued only on September 7 (2 ⫻ 104
cells ml⫺1
). The toxin concentrations were low throughout the summer, reaching an average of 7.2 ⫻ 10⫺3
ng ml⫺1
on August 2 in the littoral station (Fig. 3), where a similar trend was observed between the mcyDKSgene copy number and the toxin
concen-tration. At the beginning of August, Q-PCR detected approx-imately 3 ⫻ 102
copies of the mcyDKSgene when the
micro-cystin concentration was 7.2 ⫻ 10⫺3
ng ml⫺1
. In the pelagic zone, the number of mcyDKSgene copies was higher than the
toxin concentration at the beginning of the summer but only until the end of August. A peak of approximately 2.5 ⫻ 102
mcyDKSgene copies ml ⫺1
was observed on August 30, but the
corresponding toxin concentration was quite low. The toxin concentrations increased slightly afterwards, whereas the num-ber of mcyDKSgene copies continued to decrease. There was
no significant correlation between gene copy number and mi-crocystin concentration.
Q-PCR analysis with mcyDDH in Missisquoi Bay in 2006.
The trends described for the mcyDKStarget were also observed
in both stations with the mcyDDHgene (Fig. 1A and B). The
major difference was that the mcyDDH gene copy numbers
were much lower than the mcyDKS numbers. For example,
slightly more than 104
copies of the mcyDDHgene were
de-tected in the littoral zone during the first bloom event, com-pared to 6.5 ⫻ 104
copies of the mcyDKSgene (Fig. 1A). There
was a good correlation at both stations between gene copy number and microcystin concentration (for ELISA results, r ⫽ 0.74, P ⬍ 0.05 [littoral] and r ⫽ 0.95, P ⬍ 0.05 [pelagic]; for FIG. 1. Results of quantitative PCR analysis of the mcyDKSgene in
relation to the results of standard chemical methods (ELISA and HPLC) used to detect microcystin in the littoral (A) and pelagic (B) zones of Philipsburg, Missisquoi Bay, during the summer of 2006.
FIG. 2. (A) Microcystin concentrations measured by ELISA versus
mcyDKSgene copy numbers by Q-PCR in Missisquoi Bay during the
2006 growing season, from May 30 to October 16, in the littoral and pelagic stations. (B) There was an extended period of exponential increase in the mcyDKSgene copy number in Missisquoi Bay from May
30 (day 150) to August 15 (day 227), shown by the straight regression line on this semilog plot. Correlation coefficients are indicated in the panels.
HPLC results, r ⫽ 0.88, P ⬍ 0.005 [littoral] and r ⫽ 0.97, P ⬍ 0.005 [pelagic]) throughout the summer.
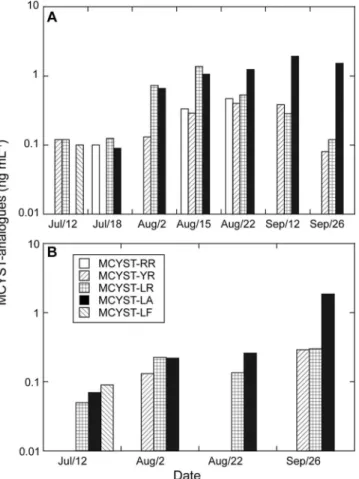
Microcystin analyses.In 2006, the ELISA and HPLC chem-ical assays yielded similar results, with the exception of the littoral station during the August bloom, where the toxin con-centration obtained by HPLC was lower than the results with ELISA (Fig. 1A). Four microcystin analogues (RR, YR, LR, and LA) were identified by HPLC during the August bloom, MCYST LR and LA being predominant on August 15 at the littoral station (Fig. 4A and B). A steady increase of the MCYST LA analogue was observed throughout the summer. This analogue dominated the bloom in September, reaching a concentration of almost 2 ng ml⫺1
. The HPLC results were validated by the results of LC-MS analyses (data not shown). The ELISA results for 2006 demonstrated that the toxin concentration increased by 15% per day for 2 months (r ⫽ 0.999). This allowed us to predict in early July that the lake would close for drinking water on July 26 if the trend contin-ued. The actual health advisory was issued on July 27.
Cyanobacterial abundance in 2006.Several cyanobacterial genera, including potential microcystin-producing species such as Microcystis aeruginosa, Microcystis wesenbergii, and
Anabaena spiroides, were identified by microscopy (Fig. 5 and 6). Microcystis aeruginosa cells were first identified from both stations at the end of May and became numerically dominant throughout the summer and early fall. The population fol-lowed the same trend as the number of mcyDKS copies and
microcystin concentration in the littoral zone (Fig. 1A and 5A). The highest number of cells was recorded on August 15, when the relative abundance reached more than 1.57 ⫻ 105
cells ml⫺1
(Fig. 5A). On that date, the M. aeruginosa population accounted for 58% of the total cyanobacterial abundance. The population dropped to 7.02 ⫻ 104
cells ml⫺1
on August 22 but peaked again at the beginning of September, with more than 1.37 ⫻105
cells ml⫺1
on September 12. On those dates, the population corresponded to 46% and 69% of the total cya-nobacterial abundance, respectively. Six different species of
Anabaenawere identified throughout the summer (5, 21). On August 2, prior to the first bloom, the Anabaena spiroides population accounted for 36% and 40% of the total cyanobac-terial abundance in the littoral and pelagic stations, respec-tively (Fig. 5A and B). During the bloom of August 15, the A.
spiroidespopulation constituted 21% of the total abundance in the littoral station, at 5.61 ⫻ 104
cells ml⫺1
, but during the second bloom event, the A. spiroides population made up only 4% of the total abundance in both stations. Aphanizomenon
flos aquaewas first detected in July and remained part of the phytoplankton community until late fall. The highest counts were obtained in the littoral station at the beginning of Octo-ber, when A. flos aquae cells constituted 58% of the total cyanobacterial abundance (data not shown).
Cyanobacterial abundance in 2007. The cyanobacterial abundance was substantially lower in 2007 than in 2006.
Mi-crocystis aeruginosacells were first identified on June 6 in the littoral zone and on July 19 in the pelagic zone (data not shown). The highest numbers of cells were recorded on August 22, with more than 3.8 ⫻ 103
and 1.5 ⫻ 103
cells ml⫺1
in the littoral and pelagic stations, respectively (Fig. 6A and B). On this date, the M. aeruginosa population accounted for 4.9% (littoral) and 1% (pelagic) of the total cyanobacterial abun-dance. M. aeruginosa cells were not detected after September 5. Six species of Anabaena were identified in both stations FIG. 3. Results of quantitative PCR analysis of the mcyDKSgene in
relation to the results of the chemical method ELISA used to detect microcystin in the littoral and pelagic zones of Philipsburg, Missisquoi Bay, during the summer of 2007.
FIG. 4. Results of HPLC analysis of MCYST analogues identified in Philipsburg, Missisquoi Bay, during the summer of 2006. (A) Litto-ral station. (B) Pelagic station.
during the summer of 2007. Anabaena flos aquae intermedia was identified in both stations but seemed to be predominant at the beginning of September in the littoral zone, at 4.69 ⫻ 103
cells ml⫺1
. Anabaena spiroides crassa was first detected at the end of August, and the number of cells increased until mid-September, from 6.01 ⫻ 101
to 1.71 ⫻ 103
cells ml⫺1
, in the pelagic station (Fig. 6B). Three different species of
Apha-nizomenonwere identified at the beginning of the summer, but none were detected after August 2.
DISCUSSION
Oligonucleotide primers for the mcyDKS gene, encoding
-ketoacyl synthase, were designed and used successfully to characterize cyanobacterial blooms in Missisquoi Bay, Lake Champlain. A higher number of mcyD copies was generated with these primers than with the primers designed from the first dehydratase subunit, mcyDDH. Similar results were
ob-tained from Constance Lake, ON, a much smaller, shallow mesotrophic lake sampled during the same time frame (data not shown). This difference in detection could be attributed to nucleotide mismatches in the reverse primer of mcyDDH.
Alignments of the mcyDDHsequences revealed 2 mismatches
between the primer sequence of the reference strain and the sequence of the Microcystis aeruginosa that was identified in the lake. These results show that primer design is a critical step in the development of Q-PCR methodology for the analysis of cyanotoxins.
The Q-PCR method developed in this study allowed the detection of microcystin-producing cyanobacteria as early as the end of May during the summer of 2006. At the littoral station, toxin producers were detected by Q-PCR before this was possible by chemical analyses (ELISA and HPLC) or mi-croscopy. Furthermore, there was a highly significant correla-tion between gene copy numbers and microcystin concentra-tions. The precision afforded by toxin gene tracing permitted us to document a quite extraordinary period of exponential increase in microcystin-producing cells that was maintained over 50 days. This uninterrupted run was followed by another period of slightly reduced growth, at 6% per day, lasting for another 27 days. When the maximum was reached, Microcystis
aeruginosa made up 46% of phytoplankton biomass, and
Anabaena spiroides was at 45%. This smooth uninterrupted growth phase suggests that external influences (changes in weather, for example) were minimal once the conditions were FIG. 5. Abundance of potential toxin-producing cyanobacteria in
Missisquoi Bay during the summer of 2006. (A) Littoral station. (B) Pelagic station. The numbers above the bars represent the total cyanobacterial abundance (cells ml⫺1).
FIG. 6. Abundance of potential toxin-producing cyanobacteria in Missisquoi Bay during the summer of 2007. (A) Littoral station. (B) Pelagic station. The numbers above the bars represent the total cyanobacterial abundance (cells ml⫺1).
appropriate for cell growth. The bloom was arrested only when essentially all phytoplankton biomass was made up by large, colonial, buoyant cyanobacteria.
The proportions of M. aeruginosa in both the littoral and the pelagic stations were very similar during the months of August and September. There were tremendous spatial variations in total cell abundance, however, so that toxin concentrations varied in August and September from 0.5 ng ml⫺1
in the pelagic station to more than 2 ng ml⫺1
in the littoral station. Southwesterly winds are predominant in this area and often contribute to the accumulation of scum near the shore at our littoral station. The littoral zone also has shallow and warm water, which provides highly favorable conditions for the growth of cyanobacteria. The regression analysis of the micro-cystin concentrations by ELISA versus mcyDKS gene copy
numbers did indicate that nearshore accumulations of cya-nobacteria contained more toxin per cell, estimated at 870 fg per gene copy, than did open water populations, which aver-aged 300 fg per gene copy. These are not unusual values, but they are higher than most microcystin cell quotas reported in the literature, which hover around 200 fg per cell (6). This spatial segregation suggests physical selection of different phe-notypes of toxigenic cells, if not gephe-notypes, by wind. If so, it would provide interesting confirmation of the correlation be-tween colony size, buoyancy, and cell-specific toxicity that has been demonstrated for Microcystis in a German lake (14).
The strength of the relationship between the numbers of
mcyDKSgene copies detected in May and June and toxin
con-centrations in the lake could be used to predict the date of a public health advisory based on the Canadian drinking water guideline of 1.5 g of microcystin liter⫺1
. The gene copy num-ber equation suggested that the health advisory would be is-sued on July 21, 1 week prior to the actual closing date of July 27. The ELISA results demonstrated that the toxin content increased at a fairly constant 15% per day over the same 2 months. A regression equation of the microcystin concentra-tion measured by ELISA versus the day of the year suggested that a public health advisory would be posted on July 26. The accuracy of these predictions, based on early season dynamics, would not be expected every year but is sufficiently striking to encourage further work on toxic bloom prediction via these sensitive methods.
The strong linear relationship between toxin concentrations and gene copies in the two zones does not tell the whole story of toxin dynamics, however. Another interesting observation was that the amount of toxin per gene copy increased steadily with time. The toxin concentration increased faster (⫹15% per day) than the gene copy number (⫹7.5% per day) or the
Microcystispopulation (⫹7.5% per day). This might occur if (i) there is a succession of strains of increasing toxicity with time, (ii) the toxigenic cells slowly accumulate and sequester toxin with time, or (iii) gene expression is enhanced with time. We are unable to distinguish among these possibilities on the basis of these data. Nevertheless, the fraction of Microcystis cells that were potentially toxic (i.e., contained the gene) was more or less constant (except for some unusual outliers where few cells seemed toxic). This suggests that Microcystis was the principal genus producing microcystin in Missisquoi Bay during our study.
The HPLC profile revealed a change in the toxin
composi-tion during the two bloom events. Four microcystin analogues were observed during the bloom in August. Changes in the toxin composition have also been observed by Watanabe et al. (34) from a batch culture experiment containing two
Microcys-tisspecies. Similar amounts of MCYST RR, YR, and LR were present at the beginning of the exponential growth phase of M.
viridis, but a significant increase from 35 g to 112 g of MCYST RR per 100 mg of cells was recorded during the late stage of its exponential growth. In a similar experiment, a substantial increase of MCYST YR from 130 g to 1,020 g per 100 mg of cells was observed during the exponential growth phase of a highly toxic strain of M. aeruginosa.
Favorable conditions for a cyanobacterial bloom occurred only late in the summer of 2007. Very low concentrations of microcystin were monitored with the ELISA method during the month of September. M. aeruginosa was identified early in the summer in both the pelagic and littoral stations but never reached more than 4 ⫻ 103
cells ml⫺1
throughout the summer. Contrary to the situation in the fall of 2006, the cyanobacterial abundance was dominated by various species of Anabaena in September 2007.
In 2007, the low correlation between gene copy number and microcystin concentration in the littoral zone and the lack of correlation in the pelagic zone could be attributed to the low toxin concentrations, where many samples were close to the detection limit. Q-PCR analyses revealed the presence of cya-nobacteria with the ability to produce microcystin in the pelagic zone at the end of August 2007. Potential microcystin producers, such as Microcystis aeruginosa, Anabaena flos aquae
intermedia, and Anabaena spiroides, were present in that sta-tion on August 30 and together constituted 1.8% of the total cyanobacterial abundance.
With the exception of 2007, Missisquoi Bay has experienced significant toxic cyanobacterial blooms since 2000. Although we do not have a clear explanation for the absence of a bloom in 2007, we believe that several environmental factors, such as rainfall, the availability of nutrients, and water temperature, may play a role in the bloom dynamics in the bay. Precipitation events for example, especially in the spring following the ap-plication of manure and fertilizers, can cause substantial ero-sion and internal loading of nutrients to the tributaries of Missisquoi Bay and the bay itself. The Quebec-Vermont task force on phosphorus reduction in Missisquoi Bay (9) con-cluded that 79% of the phosphorus entering the bay is coming from nonpoint sources (erosion and surface runoff) related to agricultural activities. The marked differences in the occur-rence of toxic blooms suggest that nutrient inputs alone, how-ever, are not sufficient to explain year-to-year differences. It is hoped that insights into toxigenic strain demographics pro-vided by molecular tools in this and other lakes will provide clues to help us understand and predict in situ dynamics.
Conclusions.The occurrence of toxic cyanobacterial blooms is to a large extent unpredictable. Environmental factors, such as temperature, light intensity, and turbidity, as well as nutrient availability, can greatly influence the potency and the extent of blooms. Climatic changes which contribute to intense rainfall episodes and warmer temperatures are making these events even more unpredictable and challenging to understand.
A quantitative PCR (Q-PCR) approach was developed for the early detection of blooms formed by microcystin-producing
cyanobacteria. Oligonucleotide primers for the region of the
mcyDgene encoding -ketoacyl synthase were designed and successfully used to characterize cyanobacterial blooms in Mis-sisquoi Bay, Lake Champlain. The Q-PCR method allowed the detection of microcystin-producing cyanobacteria as early as the end of May, before the toxin could be reliably detected by chemical analyses. This result adds to other successes based on molecular approaches that offer new tools to address remain-ing questions in applied and fundamental cyanobacterial ecol-ogy. This technique is promising and can be used for early and efficient monitoring of the most at-risk water bodies.
ACKNOWLEDGMENTS
This research was supported by an NSERC strategic grant and a First Nations and Inuit Health branch grant.
We are very grateful to Serge Paquet for the taxonomy work. We thank Beatrice Barbier for her participation during the DNA extrac-tion optimizaextrac-tion phase, Susan Leblanc for the growth and mainte-nance of Microcystis cultures, Hongmei Duan, Frederique Lebrun, and Julie Champagne for their help with filtration, DNA extraction, and Q-PCR, and Jeromy Harvie for toxin analyses.
REFERENCES
1. Aranda-Rodriguez, R., A. Tillmanns, F. M. Benoit, F. R. Pick, J. Harvie, and
L. Solenaia.2005. Pressurized liquid extraction of toxins from cyanobacterial cells. Environ. Toxicol. 20:390–396.
2. Chorus, I., and J. Bartram (ed.). 1999. Toxic cyanobacteria in water: a guide to their public health consequences, monitoring and management. World Health Organization. E & FN Spon, London, United Kingdom.
3. Christiansen, G., J. Fastner, M. Erhard, T. Bo¨rner, and E. Dittmann. 2003. Microcystin biosynthesis in Planktothrix: genes, evolution, and manipulation. J. Bacteriol. 185:564–572.
4. Fewer, D. P., M. Ko¨ykka¨, K. Halinen, J. Jokela, C. Lyra, and K. Sivonen. 2009. Culture-independent evidence for the persistent presence and genetic diversity of microcystin-producing Anabaena (Cyanobacteria) in the Gulf of Finland. Environ. Microbiol. 11:855–866.
5. Findlay, D. L., and H. J. Kling. 1979. A species list and pictorial reference to the phytoplankton of central and northern Canada, part I. Fisheries and Marine Service manuscript report no. 1503. Western Region Fisheries and Marine Service, Department of Fisheries and the Environment, Winnipeg, Canada.
6. Fitzgerald, D. J., D. A. Cunliffe, and M. D. Burch. 1999. Development of health alerts for cyanobacteria related toxins in South Australia. Environ. Toxicol. 14:203–209.
7. Harada, K., K. Ogawa, K. Matsuura, H. Murata, M. Suzuki, M. F.
Wa-tanabe, Y. Itezono, and N. Nakayama.1990. Structural determination of geometrical isomers of microcystins LR and RR from cyanobacteria by two-dimensional NMR spectroscopic techniques. Chem. Res. Toxicol.
3:473–481.
8. Harada, K., K. Matsuura, M. Suzuki, M. F. Watanabe, S. Oishi, A. M.
Dahlem, V. R. Beasley, and W. W. Carmichael.1990. Isolation and charac-terization of the minor components associated with microcystins LR and RR in the cyanobacterium (blue-green algae). Toxicon 28:55–64.
9. Hegman, W., D. Wang, and C. Borer. 1999. Estimation of Lake Cham-plain basinwide nonpoint source phosphorus export. Lake ChamCham-plain Basin Program Technical Report no. 31. Lake Champlain Basin Program, Grand Isle, VT.
10. Hisbergues, M., G. Christiansen, L. Rouhiainen, K. Sivonen, and T. Bo¨rner. 2003. PCR-based identification of microcystin-producing genotypes of dif-ferent cyanobacterial genera. Arch. Microbiol. 180:402–410.
11. Hotto, A. M., M. F. Satchwell, and G. L. Boyer. 2007. Molecular character-ization of potential microcystin-producing cyanobacteria in lake Ontario embayments and nearshore waters. Appl. Environ. Microbiol. 73:4570–4578. 12. Jaiswal, P., P. K. Singh, and R. Prasanna. 2008. Cyanobacterial bioactive molecules—an overview of their toxic properties. Can. J. Microbiol. 54:701– 717.
13. Jungblut, A.-D., and B. A. Neilan. 2006. Molecular identification and evolu-tion of the cyclic peptide hepatotoxin microcystin and nodularin, synthetase genes in three orders of cyanobacteria. Arch. Microbiol. 185:107–114. 14. Kurmayer, R., G. Christiansen, and I. Chorus. 2003. The abundance of
microcystin-producing genotypes correlates positively with colony size in
Microcystis sp. and determines its microcystin net production in Lake Wannsee. Appl. Environ. Microbiol. 69:787–795.
15. Lyra, C., S. Suomalainen, M. Gugger, C. Vezie, P. Sundman, L. Paulin, and
K. Sivonen.2001. Molecular characterization of planktic cyanobacteria of
Anabaena, Aphanizomenon, Microcystis and Planktothrix genera. Int. J. Syst. Evol. Microbiol. 51:513–526.
16. Mbedi, S., M. Welker, J. Fastner, and C. Wiedner. 2005. Variability of the microcystin synthetase gene cluster in the genus Planktothrix (Oscillatoriales, Cyanobacteria). FEMS Microbiol. Lett. 245:299–306.
17. Nishizawa, T., M. Asayama, K. Fujii, K.-I. Harada, and M. Shirai. 1999. Genetic analysis of the peptide synthetase genes for a cyclic heptapeptide microcystin in Microcystis spp. J. Biochem. 126:520–529.
18. Nishizawa, T., A. Ueda, M. Asayama, K. Fujii, K.-I. Harada, K. Ochi, and M.
Shirai.2000. Polyketide synthase gene coupled to the peptide synthetase module involved in the biosynthesis of the cyclic heptapeptide microcystin. J. Biochem. 127:779–789.
19. Ouellette, A. J. A., S. M. Handy, and S. W. Wilhelm. 2006. Toxic Microcystis is widespread in Lake Erie: PCR detection of toxin genes and molecular characterization of associated cyanobacterial communities. Microbiol. Ecol.
51:154–165.
20. Potamis, G. C., M. Papineau, E. Smeltzer, and M. Mimeault. 2004. Inter-national Missisquoi Bay Task Force. Final report to the InterInter-national Joint Commission, October 20, 2004. International Joint Commission, Ottawa, Canada, and Washington, DC.
21. Prescotte, G. W. 1982. Algae of the western Great Lakes area. Otto Koeltz Science Publishers, Koenigstein, Germany.
22. Rantala, A., D. P. Fewer, M. Hisbergues, L. Rouhiainen, J. Vaitomaa, T.
Bo¨rner, and K. Sivonen.2004. Phylogenetic evidence for the early evolution of microcystin synthesis. Proc. Natl. Acad. Sci. U. S. A. 101:568–573. 23. Rantala, A., P. Rajaniemi-Wacklin, C. Lyra, L. Lepisto¨, J. Rintala, J.
Man-kiewicz-Boczek, and K. Sivonen.2006. Detection of microcystin-producing cyanobacteria in Finnish lakes with genus-specific microcystin synthetase gene E (mcyE) PCR and associations with environmental factors. Appl. Environ. Microbial. 72:6101–6110.
24. Rantala, A., E. Rizzi, B. Castiglioni, G. de Bellis, and K. Sivonen. 2008. Identification of hepatotoxin-producing cyanobacteria by DNA chip. Envi-ron. Microbiol. 10:653–664.
25. Rinta-Kanto, J. M., A. J. Ouellette, G. L. Boyer, M. R. Twiss, T. B.
Bridge-man, and S. W. Wilhelm.2005. Quantification of toxic Microcystis spp. during the 2003 and 2004 blooms in western Lake Erie using quantitative real-time PCR. Environ. Sci. Technol. 39:4198–4205.
26. Rinta-Kanto, J. M., E. A. Konopko, J. M. DeBruyn, R. A. Bourbonniere,
G. L. Boyer, and S. W. Wilhelm.2009. Lake Erie Microcystis: relationship between microcystin production, dynamics of genotypes and environmental parameters in a large lake. Harmful Algae 8:665–673.
27. Rosen, B. H., A. Shambaugh, L. Ferber, F. Smith, and M. Watzin. 2001. Monitoring and evaluation of potential blue green algal toxins in Lake Champlain, summer 2000. Lake Champlain Basin Program, Technical Re-port no. 39. Lake Champlain Basin Program, Grand Isle, VT.
28. Rouhiainen, L., T. Vakkilainen, B. L. Siember, W. Buiema, R. Haselkorn,
and K. Sivonen.2004. Genes coding for hepatotoxic heptapeptides (micro-cystins) in the cyanobacterium Anabaena strain 90. Appl. Environ. Micro-biol. 70:686–692.
29. Tanabe, Y., K. Kaya, and M. M. Watanabe. 2004. Evidence for recombina-tion in the microcystin synthetase (mcy) genes of toxic cyanobacteria
Micro-cystisspp. J. Mol. Evol. 58:633–641.
30. Thompson, J. D., D. G. Higgins, and T. J. Gibson. 1994. CLUSTAL W: improving the sensitivity of progressive multiple sequence alignment through sequence weighting, position specific gap penalties and weight matrix choice. Nucleic Acids Res. 22:4673–4680.
31. Tillett, D., E. Dittmann, M. Erhard, H. von Do¨hren, T. Bo¨rner, and B. A.
Neilan.2000. Structural organization of microcystin biosynthesis in
Micro-cystis aeruginosaPCC7806: an integrated peptide-polyketide synthetase sys-tem. Chem. Biol. 7:753–764.
32. Utermo¨hl, H. 1958. Zur Vervolkommnung der quantitativen phytoplankton-Methodik. Mitt. Internat. Ver. Fu¨r Theoret. Angew. Limnol. 9:1–38. 33. Vaitomaa, J. A. Rantala, K. Halinen, L. Rouhiainen, P. Tallberg, L.
Mokelke, and K. Sivonen.2003. Quantitative real-time PCR for determina-tion of microcystin synthetase E copy numbers for Microcystis and Anabaena in lakes. Appl. Environ. Microbiol. 69:7289–7297.
34. Watanabe, M. F., K. I. Harada, K. Matsuura, M. Watanabe, and M. Suzuki. 1989. Heptapeptide toxin production during the batch culture of two
Micro-cystisspecies (cyanobacteria). J. Appl. Phycol. 1:161–165.
35. Welker, M., and H. von Do¨hren. 2006. Cyanobacterial peptides—nature’s own combinatorial biosynthesis. FEMS Microbiol. Rev. 30:530–563.