Publisher’s version / Version de l'éditeur:
Chemistry of Materials, 2016-01-08
READ THESE TERMS AND CONDITIONS CAREFULLY BEFORE USING THIS WEBSITE.
https://nrc-publications.canada.ca/eng/copyright
Vous avez des questions? Nous pouvons vous aider. Pour communiquer directement avec un auteur, consultez la
première page de la revue dans laquelle son article a été publié afin de trouver ses coordonnées. Si vous n’arrivez pas à les repérer, communiquez avec nous à [email protected].
Questions? Contact the NRC Publications Archive team at
[email protected]. If you wish to email the authors directly, please see the first page of the publication for their contact information.
NRC Publications Archive
Archives des publications du CNRC
This publication could be one of several versions: author’s original, accepted manuscript or the publisher’s version. / La version de cette publication peut être l’une des suivantes : la version prépublication de l’auteur, la version acceptée du manuscrit ou la version de l’éditeur.
For the publisher’s version, please access the DOI link below./ Pour consulter la version de l’éditeur, utilisez le lien DOI ci-dessous.
https://doi.org/10.1021/acs.chemmater.5b04380
Access and use of this website and the material on it are subject to the Terms and Conditions set forth at
Bright gradient-alloyed CdSeₓS
₁₋ₓ quantum dots exhibiting cyan-blue
emission
Zhang, Jing; Yang, Qian; Cao, Hong; Ratcliffe, Christopher I.; Kingston,
David; Chen, Queena Y.; Ouyang, Jianying; Wu, Xiaohua; Leek, Donald M.;
Riehle, Frank S.; Yu, Kui
https://publications-cnrc.canada.ca/fra/droits
L’accès à ce site Web et l’utilisation de son contenu sont assujettis aux conditions présentées dans le site LISEZ CES CONDITIONS ATTENTIVEMENT AVANT D’UTILISER CE SITE WEB.
NRC Publications Record / Notice d'Archives des publications de CNRC:
https://nrc-publications.canada.ca/eng/view/object/?id=4fc345e9-a2f1-4a9c-95a4-794ce69a84ab https://publications-cnrc.canada.ca/fra/voir/objet/?id=4fc345e9-a2f1-4a9c-95a4-794ce69a84abBright Gradient-Alloyed CdSe
x
S
1−x
Quantum Dots Exhibiting
Cyan-Blue Emission
Jing Zhang,
†Qian Yang,
‡Hong Cao,
‡Christopher I. Ratcliffe,
‡David Kingston,
‡Queena Y. Chen,
‡Jianying Ouyang,
‡Xiaohua Wu,
‡Donald M. Leek,
‡Frank S. Riehle,
*
,†and Kui Yu
*
,††
Institute of Atomic and Molecular Physics, Sichuan University, Chengdu 610065, P. R. China ‡
National Research Council of Canada, Ottawa, Ontario K1A 0R6, Canada
*
S Supporting InformationABSTRACT: Highly emissive alloyed CdSeS quantum dots (QDs) with a gradient structure exhibiting photoluminescence (PL) peaking at 490 nm and an absolute quantum yield (QY) of 79% (in toluene with excitation wavelength of 430 nm) were designed and synthesized. The cyan-blue emitters were synthesized at 180 °C in 1-octadecene (ODE) with cadmium oleate (Cd(OA)2), tri-n-octylphosphine selenide (TOPSe),
and tri-n-octylphosphine sulfide (TOPS) as the Cd, Se, and S precursors, respectively; importantly, a commercial secondary phosphine, diphenyl phosphine (DPP or HPPh2), was used as
a beneficial additive. Also, our high Cd/(Se + S) feed molar
ratio aids in shifting the equilibrium of the chalcogenide exchange, TOPE + HPPh2⇔TOP + EPPh2H, to the right. Density
functional theory (DFT) calculations suggest that the formation of SePPh2H proceeds faster than that of SPPh2H, which
supports our high S/Se feed molar ratio used to synthesize the bright gradient-alloyed CdSeS QDs. Compositional and structural characterization was carried out using powder X-ray diffraction (PXRD), transmission electron microscopy (TEM), energy dispersive X-ray spectroscopy (EDX), X-ray photoelectron spectroscopy (XPS), and solid-state nuclear magnetic resonance spectroscopy (NMR). Particularly, our solid-state113Cd NMR analysis reveals that the highly emissive CdSeS QDs consist of a
three-domain structure with a Se-rich inner core region, a Se/S equivalent middle region, and a S-rich outer region. The present study highlights the importance on the use of secondary phosphines together with high cation/anion feed molar ratios in the rational design and synthesis of high-quality metal chalcogenide QDs at relatively low temperature but with high yield and reproducibility.
■
INTRODUCTIONThe synthetic development of alloyed colloidal semiconductor nanocrystals (NCs) or quantum dots (QDs) has become an emerging research field due to their important roles in basic research1−3and in applied science.4−6The bandgap of alloyed QDs can be readily engineered by their chemical composition and internal structure, in addition to size tuning, allowing researchers to access emission color that is difficult from the corresponding binary systems.7Furthermore, alloyed QDs can exhibit superior optical properties as compared to their corresponding binary and core/shell counterparts, regarding photoluminescent (PL) color, quantum yield (QY), and blinking.8,9
Due to the relatively small lattice mismatch between CdS and CdSe which facilitates the formation of alloyed structures,10,11 the CdSexS1−xsystem (also simplified as CdSeS) is an excellent
alloy model system to explore new phenomena such as nonlinear optical effects that are desirable for optoelectronic applications.12 Moreover, alloyed CdSeS QDs could be promising light emitters for the cyan-blue and blue-green color range (490−520 nm), useful for horticultural lighting.13,14 However, the optical properties of cyan-blue emitting QDs are
always poor (with low QY and trap emission).15−18 Accordingly, it is of practical importance to optimize the synthesis of bright cyan-blue emitters without trap emission.
Since 2003, many efforts have been devoted to synthesize PL CdSeS alloyed QDs.1−3,19−25 Table S1 (Supporting Informa-tion) lists the main approaches to CdSeS QDs together with their optical properties. These approaches were usually based on the addition of a mixture of tri-n-octylphosphine selenide (TOPSe) and tri-n-octylphosphine sulfide (TOPS) to a solution of cadmium carboxylate (Cd(OOCR)2) in
1-octadecene (ODE) at high temperature. After the quick injection of the chalcogenide mixture, the reaction temperature around 315 °C was quickly decreased to ∼275 °C for the growth of alloyed QDs.19This temperature decrease operation has been claimed to be crucial in order to separate nucleation and growth as the prerequisite of the formation of nanocrystals with narrow size distribution.26 Obviously, the classical hot-injection approach with temperature decrease operation is not
Received: November 10, 2015
Revised: December 23, 2015
pubs.acs.org/cm
© XXXX American Chemical Society A DOI: 10.1021/acs.chemmater.5b04380
suitable for large-scale production.21With injection and growth at 300 °C, alloyed CdSeS QDs were synthesized to exhibit PL peaking at 520 nm and a relative PLQY of ∼80%.22 With injection and growth at 220 °C in combination with more reactive precursors tri-n-butylphosphine selenide (TBPSe) and tri-n-butylphosphine sulfide (TBPS), alloyed CdSeS QDs with PL emission at 592 nm and a relative PLQY of ∼74% were synthesized.23 It seems, accordingly, that lower reaction temperatures could be applied when Se and S precursors have higher reactivity. Meanwhile, the use of additives such as 2,2′-dithiobisbenzothiazole (MBTS) could improve the optical quality of the resulting alloyed QDs.21 However, it is still challenging to obtain bright CdSeS cyan emitters at relatively low temperature.
The discovery of secondary phosphines (such as di-n-octylphosphine (DOP or HP(C8H17)2)) as beneficial impurities
in commercial tertiary phosphines (such as tri-n-octylphosphine (TOP or P(C8H17)3)) has paved the way to use commercial
diphenyl phosphine (DPP or HPPh2) in the synthesis of metal
chalcogenide QDs.27−31 At low temperature, it is SePPh
2H
instead of TOPSe that reacts with metal precursors due to the existence of the Se exchange equilibrium of TOPSe + HPPh2
⇔TOP + SePPh2H.29,30With the strong TOP coordination to Cd, the formation of SePPh2H is favored by high Cd/Se
feed molar ratios.30,31The use of HPPh2together with a high
metal/chalcogen feed molar ratio significantly enhanced the reaction yield and synthetic reproducibility at low temperature; such improvement has been clearly demonstrated for CdSe30 and PbSe31QD systems.
Here, we report our synthesis of gradient-alloyed CdSeS QDs which emit at 490 nm with absolute PLQY of 79%. On the basis of our characterization including 113Cd solid-state
NMR, the bright cyan-blue CdSeS QDs should have a three-domain structure formed at 180 °C from our non-hot-injection approach with the mixture of Cd(OA)2 + TOPSe + TOPS +
HPPh2in ODE. The feed molar ratios were 4Cd/0.25Se/0.75S.
The high Cd/(Se + S) feed molar ratio was designed to assist the consumption of TOP (existing in the TOPSe and TOPS solutions used and resulting from the E exchange from TOP to HPPh2, by forming a TOP−Cd coordinative complex), and
thus to benefit the formation of reactive SePPh2H and S
PPh2H. The low Se/S feed molar ratio is supported by our
DFT study suggesting that the formation of SePPh2H is
much easier with smaller activation energy than that required for SPPh2H. The present study on the synthesis of highly
emissive cyan-blue CdSeS alloyed QDs introduces a general strategy upon the use of a secondary phosphine with optimized feed molar ratios to high-quality alloyed QDs at relatively low temperature but with enhanced particle yield and synthetic reproducibility.
■
RESULTS AND DISCUSSIONOur alloyed CdSeS QDs were synthesized from Cd(OA)2,
TOPSe, TOPS, and HPPh2at 180 °C in ODE via a
non-hot-injection approach. The key innovation of our synthetic strategy is the use of HPPh2 combined with high Cd/E and
high S/Se feed molar ratios, for the formation of the gradient-alloyed structure comprising of a Se-rich inner core, a Se−S equivalent middle layer, and a S-rich outer region (as shown by Scheme S1). Basically, the activation at low temperature by HPPh2proceeds through chalcogen exchange leading to more
reactive EPPh2H, as illustrated byeq 1. High Cd/(Se + S)
feed molar ratios move the equilibrium effectively to the right via the coordination of TOP to Cd(OA)2.30
+ ⇔ +
TOPE HPPh2 TOP E PPh H2 (1)
Figure 1 shows the optical property of our CdSeS QDs synthesized at 180 °C for 90 min from batch 4HPPh2−4Cd−
8.8OA−0.25Se−0.75S (with the total of 5 g and [Se + S] = 30 mmol/kg and without sampling). The QDs exhibit sharp absorption and emission peaking at 473 and 490 nm, respectively, with narrow full-width-at-half-maximum (fwhm) of 28 nm. The absolute PLQY was measured to be 79% in toluene with the excitation wavelength of 430 nm (Figure S1A-1) with an averaged PL lifetime of 19 ns (Figure S1A-2). To the best of our knowledge, this absolute PLQY is the highest for cyan-blue CdSeS QDs ever reported. The inset in Figure 1 shows an image of the CdSeS QD sample dispersed in toluene under UV light (360 nm). Importantly, our novel approach to the bright cyan-blue CdSeS alloyed QDs is reproducible and suitable for large-scale production. The bandgap of our CdSeS QDs obtained is around 475 nm (±10 nm). Another two examples are given inFigure S1B,C, with the 90 min growth ensembles at 180 °C from 5- and 30-fold scale-up syntheses, respectively. The crude and purified products obtained from the 30-fold scale-up synthesis exhibit similar optical properties and long-term stability.
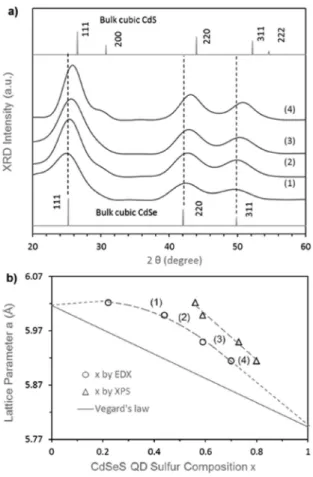
The feed molar ratio of 4HPPh2−4Cd−8.8OA−0.25Se− 0.75S together with the injection and growth temperature of 180 °C was found to be suitable to synthesize highly emissive cyan-blue CdSeS alloyed QDs. Compositional and structural characterization was carried out with our optimized CdSeS QD samples.Figure 2shows the evolution of XRD patterns (a) and of sulfur compositions versus lattice parameter a (b) of the 180 °C samples (from anotherFigure 1batch but 5-fold scale-up) with the growth periods of 3 min (1), 15 min (2), 30 min (3), and 90 min (4). The four CdSeS samples exhibit a zinc blende cubic structure, with the diffraction peaks located at Bragg angles (2θ) of about 25°, 42°, and 50°, which are indexed as (111), (220) and (311), respectively (Figure 2a). These diffraction peaks systematically shift to larger Bragg angles from samples 1−4. Such larger-angle shifts clearly indicate the decrease of lattice parameters with the possible incorporation of
Figure 1.Absorption (dashed line) and emission (solid line) spectra of CdSeS QDs synthesized at 180 °C for 90 min. The QDs exhibit absolute QY of 79% in toluene with the excitation wavelength of 430 nm. The inset shows an image of the ensemble in toluene under 360 nm UV light.
Chemistry of Materials Article
DOI: 10.1021/acs.chemmater.5b04380 Chem. Mater. XXXX, XXX, XXX−XXX
S into the QDs. In addition, the appearance of the small shoulder, located at the larger-angle side of the (111) diffraction peak which may represent CdS-related (200) diffraction in sample 4, indicates that the outer region is S-enriched.
The optical characterization of the four CdSeS QD samples, together with XRD (to get the lattice parameter a from the (220) diffraction peak), EDX, TEM, and XPS, is presented in Figure S2and summarized inTable S2. Both the EDX and XPS results demonstrate the formation of gradient-alloyed CdSeS QDs with the S concentration [x = S/(S + Se)] increasing from the inner core to the outer region of one nanocrystal. It is reasonable that the S content values obtained from XPS (surface-sensitive technique) are higher than those from EDX (bulk-sensitive technique).
The increase of size from samples 1−4 is demonstrated by XRD and TEM. For the 90 min CdSeS QDs, the TEM analysis reveals that the QDs are spherical in shape with a mean diameter of 2.7 nm and a standard deviation of 11% which is in good agreement with a value of 2.6 nm estimated from XRD line broadening by the Scherrer equation (Table S2). Without shell coating, our alloyed QDs are small and highly emissive; usually, CdS shell coating promotes the PLQY of binary CdSe.32
The experimental x−a correlation displayed in Figure 2b (with circular symbols from EDX and triangular symbols from XPS) is nonlinear. Homogeneous ternary alloys are
acknowl-edged to obey Vegard’s law with a linear relationship between their compositions and lattice parameters.33−35 Thus, our CdSeS alloyed QDs do not comply with Vegard’s law; they are inhomogeneous alloys.
Furthermore, the chemical environments of Cd and Se of one 180 °C 90 min growth ensemble (from anotherFigure 1 batch but 30-fold scale-up) are identified by solid-state NMR, giving deeper insights into the inhomogeneous multidomain structure. The bottom trace in Figure 3a shows three 113Cd
NMR signals [obtained from the magic angle spinning (MAS) spectrum with 1H high-power decoupling (HPDEC)], as
indicated by three arrows, with isotropic chemical shifts at 701, 745, and 792 ppm (based on Gaussian function fitting). For comparison, the isotropic chemical shifts of non-surface-related Cd of 3.2 nm CdSe and 4.2 nm CdS QDs are 676 and 808 ppm, respectively.36,37Therefore, our alloyed CdSeS QDs could possess a three-domain structure with a Se-rich inner core region (701 ppm), a Se/S equivalent middle region (745 ppm), and a S-rich outer region (792 ppm). With the deconvolution of the Cd nonsurface area, the compositions are estimated to be 81Se/19S for the inner, 48Se/52S for the middle, and 12Se/88S for the outer region (Scheme S1). The calculation is based on the assumption that the S composition changes linearly with the Cd chemical shift. Consequently, the lattice mismatches of the two interfaces, between the inner core
Figure 2.(a) Evolution of the powder XRD patterns (with CdSe and CdS bulk references) and (b) of sulfur compositions x = S/(S + Se) versus lattice parameter a of the four CdSeS QD samples synthesized at 180 °C with the growth of (1) 3 min, (2) 15 min, (3) 30 min, and (4) 90 min. The dashed lines are for eye guidance. The optical properties of the four samples are shown inFigure S2.
Figure 3.Solid-state NMR spectra of alloyed CdSeS QDs synthesized at 180 °C for 90 min (shown inFigure S1C). (a)113Cd magic angle spinning (MAS) spectrum with1H high-power decoupling (HPDEC) provides the total Cd signals located at 701 ppm (inner core region), 745 ppm (middle region), and 792 ppm (outer region) labeled by arrows (bottom trace), and113Cd cross-polarization (CP) and MAS NMR spectrum emphasizes the surface Cd signal at 455 ppm, with spinning side-bands (ssbs) labeled by asterisks (top trace). (b)77Se MAS spectrum with 1H HPDEC (where the sharp spike on the shoulder at −503 ppm is an artifact).
DOI: 10.1021/acs.chemmater.5b04380 Chem. Mater. XXXX, XXX, XXX−XXX
and the middle region, and between the middle and outer regions, could be estimated to be 1.2% and 1.3%, respectively. Note that these values are only about 1/
3 of the lattice
mismatch between CdSe and CdS (a = 6.050 and 5.835 Å for cubic CdSe and CdS, respectively) which is 3.7%.10,11
Interestingly, for the nonsurface Cd regions, there are no significant spinning side bands (ssbs) observed suggesting small chemical shift anisotropy (CSA). The absence of ssbs likely results from the fact that Cd has a roughly tetrahedral coordination with four chalcogenide atoms. For the surface Cd region, multiple prominent ssbs are visible from the top trace in Figure 3a [a cross-polarization (CP)/MAS NMR spectrum], which can be attributed to large CSA resulting from an asymmetric coordination of Cd to the carboxylate oxygens of the oleate surface ligand and to the chalcogenide atoms from the crystal. The main resonance is centered at 455 ppm. Note that, for surface Cd, the chemical shift of 422 ppm was reported for ∼2.0 nm CdSe magic-size NCs and that of 457 ppm for 4.2
nm CdS NCs.36,37So, it is reasonable to assume that S atoms
rather than Se atoms dominate the chalcogenide coordination with the surface Cd.
The 77Se HPDEC MAS spectrum (Figure 3b) shows two
peaks centered at about −525 ppm and about −629 ppm, which probably represent only the core and middle regions, respectively. The Se concentration is much reduced in the outer region, as mentioned above. Such experimental observation is in line with our previous work on pure bulk CdSe (shift −474 ppm, halfwidth 177 Hz) and a bulk CdSeS (60:40) alloy (shift −481 ppm, halfwidth 1617 Hz) which showed that introducing S causes a shift to more negative values and a broadening of the line.38Further negative shifting relative to the bulk seems to be a feature of the NCs. Furthermore, a77Se CP signal could not
be found, which might be expected if there are very few Se atoms in the surface region for 1H to cross-polarize to. In
addition, the13C CP MAS spectra suggest that the oleate ligand
is tethered to the surface Cd (Figure S3).37
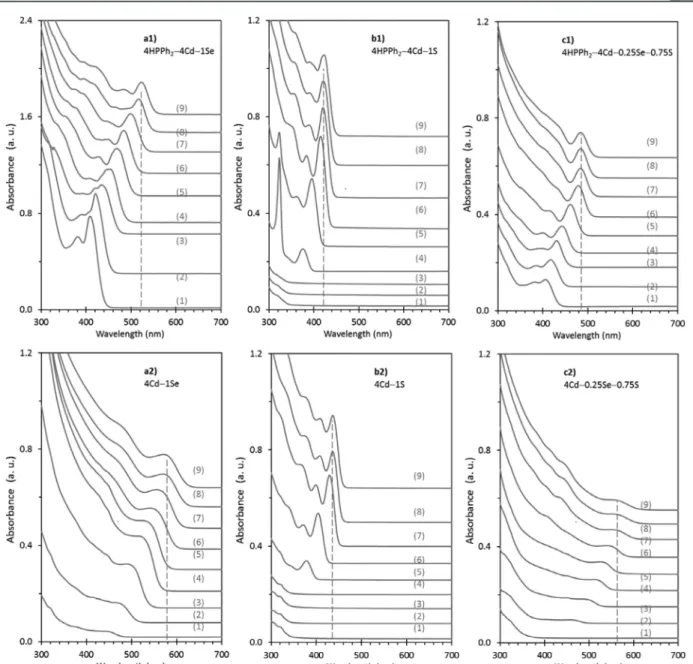
Figure 4.Temporal evolution of absorption of the growing (a) CdSe, (b) CdS, and (c) CdSeS QDs from the batches with a stepwise heating up procedure. The feed molar ratios are indicated, and nine ensembles were sampled from each batch collected from 100 to 240 °C [with (1) 15 min/ 100 °C, (2) 15 min/120 °C, (3) 15 min/140 °C, (4) 15 min/160 °C, (5) 15 min/180 °C, (6) 15 min/200 °C, (7) 15 min/220 °C, (8) 15 min/240 °C, and (9) 30 min/240 °C]. HPPh2was used for the top three batches only.
Chemistry of Materials Article
DOI: 10.1021/acs.chemmater.5b04380 Chem. Mater. XXXX, XXX, XXX−XXX
Overall, our solid-state NMR exploration together with XRD, EDX, and XPS strongly suggests that our alloyed CdSeS QDs feature a mainly three-domain structure, with an inner core region dominated by Se, a middle region containing nearly equivalent amounts of Se and S, and an outer region enriched by S (Scheme S1). The progressive increase of S from the core to the surface ensures a minimized lattice mismatch between each domain, which can strongly reduce the appearance of defects. Additionally, in such a multidomain alloyed structure, the bandgap gradually increases from the inner core to the outer region. Such a passivation by wider bandgap inorganic materials can efficiently confine the excitons to the core and facilitate their radiative recombination within the QD particles.32,39,40 In particular, for gradient-alloyed QDs, the holes are strongly confined to the core region and decoupled from the surface leading to increased recombination rates and thus higher PLQYs.8 We believe that these factors, the minimized lattice mismatch, and the gradual passivation by wider bandgap shell-like structures or domains, are responsible for the negligible appearance of trap states and for the extremely high absolute PLQY measured.
The use of HPPh2is critically combined with high Cd/E and
S/Se feed molar ratios, for the synthesis of the bright cyan-blue QDs. The rational synthetic condition, including HPPh2
amount (Figure S4B), reactant feed molar ratios (Figure S4C,D), concentration of oleic acid (OA) (Figure S4E), and growth temperature and period (Figure S4F) had been carefully evaluated (such as shown inFigure S4).Table S3summarizes our optimization study on synthetic parameters.Figure 4shows the temporal evolution of the absorption spectra of CdSe, CdS, and CdSeS QDs synthesized from batches with the feed molar ratio of (a1) 4HPPh2−4Cd−1Se, (a2) 4Cd−1Se, (b1) 4HPPh2−4Cd−1S, (b2) 4Cd−1S, (c1) 4HPPh2−4Cd− 0.25Se−0.75S, and (c2) 4Cd−0.25Se−0.75S. For each batch, nine samples were collected from 100 to 240 °C and presented from bottom to top in each of the six subfigures.
As compared with batch c2 samples, batch c1 samples exhibit relatively sharp absorption peaks indicating relatively narrow size distribution. Furthermore, the higher absorbance, especially for the low-temperature samples, supports that HPPh2
promotes precursor reactivity at low temperature with enhanced precursor conversion to monomers and thus more
efficient nucleation. Such a picture can be seen directly via the comparison of the CdSe samples from batches a1 and a2 as well as the CdS samples from batches b1 and b2. According to the absorption peak position, the CdSe and CdS samples from batches a1 and b1 are smaller in size than those from batches a2 and b2, respectively. Such difference in size is in agreement with the consumption of monomers for nucleation at the cost of growth in size. The appearance of CdSe and CdS magic-size clusters (MSCs) peaking at 415 and 321 nm inFigure 4a1,b1, respectively, indicates a high degree of supersaturation of monomers.41−43 It is noteworthy that inhomogeneous nucleation of CdSe and CdS QDs took place in batch c2 without HPPh2(Figure S4A). Therefore, the use of HPPh2also
prevents the occurrence of the binary byproducts for the synthesis of the ternary CdSeS QDs.
The presence of HPPh2 on the consumption of TOPE is
investigated by in situ 31P NMR (Figure 5) and density
functional theory (DFT) calculations (Table S4). Figure 5 shows the31P NMR spectra collected from the two reaction
mixtures of (a) 2.3Cd(OA)2−0.5TOPSe−0.5TOPS and (b) 2.3HPPh2−2.3Cd(OA)2−0.5TOPSe−0.5TOPS. The spectra were collected at temperatures between 25 and 120 °C as indicated. The spectra labeled with 25 °C* were collected after the reaction mixtures were heated up to 140 °C and were cooled down to 25 °C again. Figure 5a shows NMR signals located at −10 ppm [(A) Cd(OA)2−TOP complex], 36.8 ppm (TOPSe), and 48 ppm (TOPS).27−30Since the ratio between the TOPSe and TOPS signal does not significantly change during the heating procedure, it is reasonable to assume a rather slow precursor conversion in the absence of HPPh2.
Note that the position and shape of signal A depends on temperature.30Figure 5b shows several noticeable NMR signals
at −40 ppm (HPPh2), −10 ppm (A), −14 ppm
[tetraphe-nyldiphosphine (Ph2P−PPh2), (B)], 36.8 ppm (TOPSe), 48
ppm (TOPS), and 98 ppm [Ph2P−OOCC1 7H3 3,
(C)].27−30,44,45 The signal located at 17 ppm, which appears at 120 °C, might be Cd(Se2PPh2)2.45The reaction mechanism
for the formation of the phosphorus-containing compounds A, B, and C has been documented for the reaction of HPPh2 +
Cd(OA)2+ TOPSe, in which SePPh2H reacts with Cd(OA)2
instead of TOPSe.30,45 Our high Cd(OA)
2 to TOPSe feed
molar ratios facilitate TOPSe + HPPh2⇔TOP + SePPh2H
Figure 5.31P NMR spectra with1H decoupling collected from two reaction mixtures (a) 2.3Cd(OA)
2−0.5TOPSe−0.5TOPS and (b) 2.3HPPh2− 2.3Cd(OA)2−0.5TOPSe−0.5TOPS. The spectra were collected at the temperatures indicated. Compounds labeled A−C are Cd(OA)2−TOP complex, Ph2P−PPh2, and Ph2P−OOCC17H33, respectively.27−30,44,45
DOI: 10.1021/acs.chemmater.5b04380 Chem. Mater. XXXX, XXX, XXX−XXX
toward the right assisted by the TOP−Cd coordination which leads to compound A.30,45Clearly, the TOPSe signal at 36.8
ppm quickly disappears whereas the TOPS signal at 48 ppm remains nearly unaffected. Therefore, it is obvious that HPPh2
promotes the precursor conversion into CdSe monomers; however, 120 °C is not high enough to move TOPS + HPPh2
⇔TOP + SPPh2H to the right and to result in the formation of CdS monomers. Such experimental observation is consistent with our DFT calculations (Table S4) which suggest that the activation energies Ea’s for the Se and S exchange reactions,
TOPE + HPPh2⇔TOP + EPPh2H, are 53 and 100 kJ/mol,
respectively. Due to the extremely high reactivity, NMR has difficulty detecting SePPh2H obtained from the Se exchange
reaction.29,30Note that our synthetic results suggest that higher
reaction temperatures such as 180 °C (together with the high S/Se feed molar ratio) are able to lead to efficient S exchange and thus sufficient CdS monomers to supply the formation of gradient-alloyed CdSeS QDs. The 31P NMR spectra of the
corresponding CdSe and CdS binary reaction mixtures can be found inFigure S5.
■
CONCLUSIONSIn summary, a novel non-hot-injection approach to gradient-alloyed CdSeS QDs exhibiting absolute PLQY of 79% peaking at 490 nm was developed with the use of a secondary phosphine, HPPh2. The presence of HPPh2 as a beneficial
additive can significantly increase the precursor reactivity via chalcogen exchange, TOPE + HPPh2⇔ TOP + EPPh2H.
High cation/anion feed molar ratios facilitate the equilibrium moving toward the right, via the ready coordination of TOP with Cd(OA)2. Meanwhile, our DFT suggests that the
formation of SePPh2H proceeds much easier with a lower
activation energy than that of SPPh2H. EPPh2H is more
reactive than TOPE. Therefore, high Cd/(Se + S) and high S/ Se feed molar ratios are beneficial for the reproducible synthesis of bright cyan-blue CdSeS alloyed QDs. Their high PLQY is attributed mainly to a three-domain structure consisting of a Se-rich inner core, a Se/S equivalent middle layer, and a S-Se-rich outer region. This structure minimizes lattice mismatch inside the QDs. Our study brings the insight into a general strategy upon the use of a secondary phosphine together with optimized feed molar ratios for the rational design and synthesis of highly luminescent alloyed QDs at relatively low temperature but with enhanced particle yield and synthetic reproducibility.
■
EXPERIMENTAL SECTIONMaterials.All chemicals are commercially available and were used as received. They are cadmium oxide (CdO, 99.999%, Alfa Aesar), selenium (Se, 99.99%, 100 mesh, Sigma-Aldrich), sulfur (S, precipitated, Anachemia), tri-n-octylphosphine (TOP, 90%, Sigma-Aldrich), diphenyl phosphine (HPPh2 or DPP, 99%, Strem Chemicals), oleic acid (OA, tech. 90%, Sigma-Aldrich), and 1-octadecene (ODE, tech. 90%, Sigma-Aldrich). Solvents used for optical characterization and purification are toluene (99.5%, ACS reagent, ACP in Montreal), hexane (98.5%, GR ACS, EMD), methanol (absolute, ACP in Montreal), and acetone (99.5%, ACS reagent).
Synthesis.Stock solutions of TOPSe (1Se: 2.2TOP in molar ratio) and TOPS (1S: 2.2TOP in molar ratio) were made in a glovebox filled with nitrogen by stirring Se and S with TOP overnight to get a clear solution. In a typical regular-scale synthesis (of ∼5 g in total mass or ∼6 mL in total volume), the feed molar ratios are 4HPPh2− 4Cd(OA)2−0.25TOPSe−0.75TOPS with a [Se + S] concentration of ∼30 mmol kg−1. CdO (77 mg, 0.6 mmol), OA (0.373 g, 1.32 mmol),
and ODE (4.4214 g) were loaded into a 50 mL three-necked round-bottom flask at room temperature, which was then heated up to ∼80 °C with stirring under vacuum (∼50 mTorr) and allowed to stay at this temperature for 40 min, followed by heating up to 240 °C under purified nitrogen to get a clear colorless solution. The resulting solution was cooled down to 100 °C for 60 min under vacuum and then under nitrogen to 80 °C. A 0.10 mL portion of HPPh2was added (via a 0.5 mL syringe) into the flask; in 5 min, a mixture of TOPSe (33.5 mg, 0.0375 mmol) and TOPS (95.4 mg, 0.1125 mmol) was added. Then, the mixture was heated up to 240 °C in a stepwise manner under a flow of purified nitrogen. Such a growth mode is named “method 80 °C−240 °C” with samples taken at (1) 15 min/ 100 °C, (2) 15 min/120 °C, (3) 15 min/140 °C, (4) 15 min/160 °C, (5) 15 min/180 °C, (6) 15 min/200 °C, (7) 15 min/220 °C, (8) 15 min/240 °C, and (9) 30 min/240 °C. In an alternative growth mode, the solution of Cd(OA)2in ODE was heated to 180 °C from 100 °C, and HPPh2was added into the flask; after 3 min, a mixture of TOPSe and TOPS was quickly added, and 180 °C was maintained for 2 h. Such a growth mode is named “method 180 °C−180 °C” with samples taken at (1) 1 min, (2) 5 min, (3) 10 min, (4) 20 min, (5) 30 min, (6) 45 min, (7) 60 min, (8) 90 min, and (9) 120 min. All scale-up syntheses were performed using method 180 °C−180 °C, and two scales were used, namely, 5-fold scale (with a total mass of ∼25 g or a total volume of ∼30 mL and a [Se + S] concentration of ∼30 mmol kg−1), and 30-fold scale (with a total mass ∼75 g or a total volume of ∼90 mL and a [Se + S] concentration of ∼60 mmol kg−1).
Optical Characterization.In order to monitor the nucleation and growth of the nanocrystals, small aliquots (∼0.01 mL) of the reaction mixture were taken quickly at different growth periods/temperature; each aliquot was then dispersed in toluene with a concentration of 10 μL/1.0 mL. Optical absorption spectra were collected with a PerkinElmer Lambda 45 ultraviolet−visible (UV−vis) spectrometer using a 1 nm data collection interval. Photoluminescent (PL) emission experiments were performed on a Fluoromax-3 spectrometer (Jobin Yvon Horiba, Instruments SA), with a 150 W Xe lamp as the excitation source, an excitation wavelength of 350 nm, an increment of data collection of 1 nm, and the slits for excitation and emission of 3 or 2 nm. For the emission peak, baseline-subtracted and Gaussian-fitted integration was performed with built-in DataMax software, to yield the peak position, full width at half-maximum (fwhm), and peak area for the calculation of quantum yield (QY). Relative PL QY was determined by comparing the integrated emission of a given QD sample in dilute toluene dispersion (∼0.1 absorbance at the excitation wavelength of 430 nm) with that of coumarin 334 in ethanol (lit. QY ∼ 0.69,46 seeFigure S1B). Corrections were made for the refractive indices of the difference solvents.
For absolute quantum yield (QY) measurement, fluorescence spectra were collected on a Horiba Jobin Yvon−Edison Fluoromax-4 fluorescence spectrometer with a slit width of 3.0 nm for solution and 5.0 nm in the solid state, and absolute quantum yield was collected with a calibrated integrating sphere system. The original data sheet obtained from the measurement is provided inFigure S1A1.
Structural and Compositional Characterization. Crystal structures, sizes and size distribution, and chemical compositions were characterized by powder X-ray diffraction (PXRD), transmission electron microscopy (TEM), energy dispersive X-ray spectroscopy (EDX), X-ray photoelectron spectroscopy (XPS), and solid state nuclear magnetic resonance (NMR). Sample purification was performed and presented in Supporting Informationpage S10.
31P NMR with 1H Decoupling. The measurements were performed on a Bruker AV-III 400 spectrometer operating at 161.98 MHz for31P. An external standard 85% H
3PO4was used. The NMR samples were prepared and loaded in NMR tubes and properly sealed in a glovebox.
To make a Cd(OA)2stock solution (0.246 mmol g−1) for the NMR study shown inFigure 5andFigure S5, CdO (770.2 mg, 6.0 mmol), oleic acid (OA, 3.729 g, 13.2 mmol, without the consideration of 90% purity), and ODE (20.003 g) were placed in a 3-necked 100 mL round-bottom flask equipped with an air-condenser and a thermocouple. The mixture with a feed molar ratio of 2.2OA−
Chemistry of Materials Article
DOI: 10.1021/acs.chemmater.5b04380 Chem. Mater. XXXX, XXX, XXX−XXX
1CdO was degassed under vacuum at room temperature until there was no vigorous bubbling, and then heated up to ∼240 °C under purified nitrogen until all CdO was dissolved and a clear solution was obtained. Afterward, the mixture was degassed (at ∼50 mTorr and ∼110 °C) for 1 h. This reaction flask was protected under N2and then cooled down to room temperature and transferred into the glovebox. For Figure 5and Figure S5, the TOPSe stock solution of 1Se− 2.2TOP (TOP 90%) was made, where corrected amounts of the Se powder and TOP (without consideration of the TOP purity) were added into 20 mL vials in a N2-filled glovebox. The mixtures were then stirred overnight at room temperature. The stock solution became clear and was ready for use. TOPS stock solution of 1S−2.2TOP (TOP 90%) was made similarly.
Dry ODE was obtained by being degassed (at ∼50 mTorr and ∼100 °C) and purged with purified N2three times during a period of 2 h.
For the NMR study shown inFigure 5a, 0.2515 g (0.062 mmol) of Cd(OA)2 stock solution was mixed with 0.2267 g of ODE. Diluted Cd(OA)2 (0.45 mL = 0.046 mmol), ODE (0.2 mL), 1Se−2.2TOP (0.01 mL), and 1S−2.2TOP (0.01 mL) were mixed and loaded into a 5 mm NMR tube. The feed molar ratios were 2.3Cd(OA)2− 0.5TOPSe−0.5TOPS with [Se + S] of ∼38 mmol/kg. For the NMR study shown inFigure 5b, 1.2381 g (0.30 mmol) of Cd(OA)2stock solution was mixed with 53 μL (0.30 mmol) of HPPh2and 1.1071 g of ODE. A 0.45 mL portion of a HPPh2-added Cd(OA)2solution (with 0.045 mmol Cd and 0.045 mmol HPPh2), ODE (0.2 mL), 1Se− 2.2TOP (0.01 mL), and 1S−2.2TOP (0.01 mL) were mixed and loaded into a 5 mm NMR tube. So, the feed molar ratios were 2.3HPPh2−2.3Cd(OA)2−0.5TOPSe−0.5TOPS with [Se + S] of ∼38 mmol/kg. The NMR spectra was collected at 25 °C, 80 °C/10 min, and 120 °C/10 min, and then cooled down to 25 °C from 140 °C.
■
ASSOCIATED CONTENT*
S Supporting InformationThe Supporting Information is available free of charge on the ACS Publications website at DOI: 10.1021/acs.chemma-ter.5b04380.
Absolute and relative QY measurements; PL lifetime; large-scale synthesis; experimental parameter optimiza-tion; and PXRD, TEM, XPS, and NMR measurements (PDF)
■
AUTHOR INFORMATION Corresponding Authors *E-mail: [email protected]. *E-mail: [email protected]. NotesThe authors declare no competing financial interest.
■
ACKNOWLEDGMENTSThe authors thank Dr. M. Yang and Dr. Q. Zhen for the DFT calculations, as well as Dr. J. You, Mr. L. Yan, and Mr. Y. Chen for their support on the measurement of PL absolute QY and PL lifetime. Also, Q.Y.C. acknowledges National Research Council of Canada’s summer student program. K.Y. thanks Dr. Diana Wilkinson for the financial support from Defence Research and Development Canada Centre (DRDC). K.Y. acknowledges the National Natural Science Foundation of China (NSFC) 21573155 and the Changjiang Scholar Award Program of P. R. China.
■
REFERENCES(1) Aubert, T.; Cirillo, M.; Flamee, S.; Van Deun, R.; Lange, H.; Thomsen, C.; Hens, Z. Homogeneously Alloyed CdSe1‑xSxQuantum
Dots (0⩽x⩽1): An Efficient Synthesis for Full Optical Tunability. Chem. Mater. 2013, 25, 2388−2390.
(2) Ruberu, T. P. A.; Albright, H. R.; Callis, B.; Ward, B.; Cisneros, J.; Fan, H.-J.; Vela, J. Molecular Control of the Nanoscale: Effect of Phosphine−Chalcogenide Reactivity on CdS−CdSe Nanocrystal Composition and Morphology. ACS Nano 2012, 6, 5348−5359.
(3) Jang, E.; Jun, S.; Pu, L. High Quality CdSeS Nanocrystals Synthesized by Facile Single Injection Process and Their Electro-luminescence. Chem. Commun. 2003, 2964−2965.
(4) Jiang, W.; Singhal, A.; Zheng, J.; Wang, C.; Chan, W. C. Optimizing the Synthesis of Red-to Near-IR-Emitting CdS-Capped CdTexSe1‑x Alloyed Quantum Dots for Biomedical Imaging. Chem. Mater. 2006, 18, 4845−4854.
(5) Pan, Z.; Zhao, K.; Wang, J.; Zhang, H.; Feng, Y.; Zhong, X. Near Infrared Absorption of CdSexTe1−xAlloyed Quantum Dot Sensitized Solar Cells with More than 6% Efficiency and High Stability. ACS Nano 2013, 7, 5215−5222.
(6) Lee, K.-H.; Lee, J.-H.; Kang, H.-D.; Park, B.; Kwon, Y.; Ko, H.; Lee, C.; Lee, J.; Yang, H. Over 40 cd/A Efficient Green Quantum Dot Electroluminescent Device Comprising Uniquely Large-Sized Quan-tum Dots. ACS Nano 2014, 8, 4893−4901.
(7) Bailey, R. E.; Nie, S. Alloyed Semiconductor Quantum Dots: Tuning the Optical Properties without Changing the Particle Size. J. Am. Chem. Soc. 2003, 125, 7100−7106.
(8) Keene, J. D.; McBride, J. R.; Orfield, N. J.; Rosenthal, S. J. Elimination of Hole−Surface Overlap in Graded CdSxSe1−x Nano-crystals Revealed by Ultrafast Fluorescence Upconversion Spectros-copy. ACS Nano 2014, 8, 10665−10673.
(9) Qin, W.; Shah, R. A.; Guyot-Sionnest, P. CdSeS/ZnS Alloyed Nanocrystal Lifetime and Blinking Studies under Electrochemical Control. ACS Nano 2012, 6, 912−918.
(10) Tamargo, M. C. II-VI Semiconductor Materials and Their Applications; CRC Press, 2002; Vol. 12.
(11) Krishna, M. R.; Friesner, R. Quantum Confinement Effects in Semiconductor Clusters. J. Chem. Phys. 1991, 95, 8309−8322.
(12) Yu, D.; Du, K.; Zhang, J.; Wang, F.; Chen, L.; Zhao, M.; Bian, J.; Feng, Y.; Jiao, Y. Composition-Tunable Nonlinear Optical Properties of Ternary CdSexS1−x(x = 0 − 1) Alloy Quantum Dots. New J. Chem. 2014, 38, 5081−5086.
(13) Kim, H.-H.; Goins, G. D.; Wheeler, R. M.; Sager, J. C. Green-Light Supplementation for Enhanced Lettuce Growth under Red-and Blue-Light-Emitting Diodes. HortScience 2004, 39, 1617−1622.
(14) Morrow, R. C. LED Lighting in Horticulture. HortScience 2008, 43, 1947−1950.
(15) Peng, Z. A.; Peng, X. Formation of High-Quality CdTe, CdSe, and CdS Nanocrystals Using CdO as Precursor. J. Am. Chem. Soc. 2001, 123, 183−184.
(16) Qu, L.; Peng, X. Control of Photoluminescence Properties of CdSe Nanocrystals in Growth. J. Am. Chem. Soc. 2002, 124, 2049− 2055.
(17) Yu, W. W.; Peng, X. Formation of High-Quality CdS and Other II−VI Semiconductor Nanocrystals in Noncoordinating Solvents: Tunable Reactivity of Monomers. Angew. Chem., Int. Ed. 2002, 41, 2368−2371.
(18) Ouyang, J.; Kuijper, J.; Brot, S.; Kingston, D.; Wu, X.; Leek, D. M.; Hu, M. Z.; Ripmeester, J. A.; Yu, K. Photoluminescent Colloidal CdS Nanocrystals with High Quality via Noninjection One-pot Synthesis in 1-Octadecene. J. Phys. Chem. C 2009, 113, 7579−7593.
(19) Swafford, L. A.; Weigand, L. A.; Bowers, M. J.; McBride, J. R.; Rapaport, J. L.; Watt, T. L.; Dixit, S. K.; Feldman, L. C.; Rosenthal, S. J. Homogeneously Alloyed CdSxSe1‑x Nanocrystals: Synthesis, Characterization, and Composition/Size-Dependent Band Gap. J. Am. Chem. Soc. 2006, 128, 12299−12306.
(20) Al-Salim, N.; Young, A. G.; Tilley, R. D.; McQuillan, A. J.; Xia, J. Synthesis of CdSeS Nanocrystals in Coordinating and Noncoordinat-ing Solvents: Solvent’s Role in Evolution of the Optical and Structural Properties. Chem. Mater. 2007, 19, 5185−5193.
(21) Ouyang, J.; Vincent, M.; Kingston, D.; Descours, P.; Boivineau, T.; Zaman, M. B.; Wu, X.; Yu, K. Noninjection, One-pot Synthesis of DOI: 10.1021/acs.chemmater.5b04380 Chem. Mater. XXXX, XXX, XXX−XXX
Photoluminescent Colloidal Homogeneously Alloyed CdSeS Quan-tum Dots. J. Phys. Chem. C 2009, 113, 5193−5200.
(22) Kim, Y. K.; Chung, K.; Choi, C. J.; Shin, P. W. Synthesis of Highly Luminescent Cd (Se, S) Nanocrystals. Res. Chem. Intermed. 2010, 36, 875−880.
(23) Harrison, M. A.; Ng, A.; Hmelo, A. B.; Rosenthal, S. J. CdSSe Nanocrystals with Induced Chemical Composition Gradients. Isr. J. Chem. 2012, 52, 1063−1072.
(24) Chen, L.-Y.; Yang, P.-A.; Tseng, H.; Hwang, B.-J.; Chen, C.-H. Internal Structure of Tunable Ternary CdSexS1−xQuantum Dots Unraveled by X-ray Absorption Spectroscopy. Appl. Phys. Lett. 2012, 100, 163113.
(25) Wang, B.; Jiang, Y.; Liu, C.; Lan, X.; Wang, W.; Duan, H.; Zhang, Y.; Li, S.; Zhang, Z. One-pot Synthesis of Homogeneous CdSeS Alloyed Quantum Dots with Tunable Composition in a Green N-oleoylmorpholine Solvent. Phys. Status Solidi A 2012, 209, 306− 312.
(26) Murray, C.; Norris, D. J.; Bawendi, M. G. Synthesis and Characterization of Nearly Monodisperse CdE (E= Sulfur, Selenium, Tellurium) Semiconductor Nanocrystallites. J. Am. Chem. Soc. 1993, 115, 8706−8715.
(27) Steckel, J. S.; Yen, B. K.; Oertel, D. C.; Bawendi, M. G. On the Mechanism of Lead Chalcogenide Nanocrystal Formation. J. Am. Chem. Soc. 2006, 128, 13032−13033.
(28) Joo, J.; Pietryga, J. M.; McGuire, J. A.; Jeon, S.-H.; Williams, D. J.; Wang, H.-L.; Klimov, V. I. A Reduction Pathway in the Synthesis of PbSe Nanocrystal Quantum Dots. J. Am. Chem. Soc. 2009, 131, 10620−10628.
(29) Evans, C. M.; Evans, M. E.; Krauss, T. D. Mysteries of TOPSe Revealed: Insights into Quantum Dot Nucleation. J. Am. Chem. Soc. 2010, 132, 10973−10975.
(30) Yu, K.; Liu, X.; Zeng, Q.; Leek, D. M.; Ouyang, J.; Whitmore, K. M.; Ripmeester, J. A.; Tao, Y.; Yang, M. Effect of Tertiary and Secondary Phosphines on Low-Temperature Formation of Quantum Dots. Angew. Chem. 2013, 125, 4923−4928.
(31) Ouyang, J.; Schuurmans, C.; Zhang, Y.; Nagelkerke, R.; Wu, X.; Kingston, D.; Wang, Z. Y.; Wilkinson, D.; Li, C.; Leek, D. M. Low-Temperature Approach to High-Yield and Reproducible Syntheses of High-Quality Small-Sized PbSe Colloidal Nanocrystals for Photo-voltaic Applications. ACS Appl. Mater. Interfaces 2011, 3, 553−565.
(32) Peng, X.; Schlamp, M. C.; Kadavanich, A. V.; Alivisatos, A. P. Epitaxial Growth of Highly Luminescent CdSe/CdS Core/Shell Nanocrystals with Photostability and Electronic Accessibility. J. Am. Chem. Soc. 1997, 119, 7019−7029.
(33) Vegard, L. Die Konstitution der Mischkristalle und die Raumfüllung der Atome. Eur. Phys. J. A 1921, 5, 17−26.
(34) Vegard, L. Die Röntgenstrahlen im Dienste der Erforschung der Materie. Z. Kristallogr. - Cryst. Mater. 1928, 67, 239.
(35) Furdyna, J. K. Diluted Magnetic Semiconductors. J. Appl. Phys. 1988, 64, R29−R64.
(36) Wang, R.; Calvignanello, O.; Ratcliffe, C. I.; Wu, X.; Leek, D. M.; Zaman, M. B.; Kingston, D.; Ripmeester, J. A.; Yu, K. HomoGeneously-Alloyed CdTeSe Single-Sized Nanocrystals with Bandgap Photoluminescence. J. Phys. Chem. C 2009, 113, 3402−3408. (37) Li, M.; Ouyang, J.; Ratcliffe, C. I.; Pietri, L.; Wu, X.; Leek, D. M.; Moudrakovski, I.; Lin, Q.; Yang, B.; Yu, K. CdS Magic-Sized Nanocrystals Exhibiting Bright Band Gap Photoemission via Thermodynamically Driven Formation. ACS Nano 2009, 3, 3832− 3838.
(38) Ratcliffe, C. I.; Yu, K.; Ripmeester, J. A.; Zaman, Md. B.; Badarau, C.; Singh, S. Solid State NMR Studies of Photoluminescent Cadmium Chalcogenide Nanoparticles. Phys. Chem. Chem. Phys. 2006, 8, 3510−3519.
(39) Dabbousi, B. O.; Rodriguez-Viejo, J.; Mikulec, F. V.; Heine, J. R.; Mattoussi, H.; Ober, R.; Jensen, F. K.; Bawendi, M. G. (CdSe)ZnS Core−Shell Quantum Dots: Synthesis and Characterization of a Size Series of Highly Luminescent Nanocrystallites. J. Phys. Chem. B 1997, 101, 9463−9475.
(40) Tan, R.; Shen, Y.; Roberts, S. K.; Gee, M. Y.; Blom, D. A.; Greytak, A. B. Reducing Competition by Coordinating Solvent Promotes Morphological Control in Alternating Layer Growth of CdSe/CdS Core/Shell Quantum Dots. Chem. Mater. 2015, 27, 7468. (41) Yu, K.; Hrdina, A.; Ouyang, J.; Kingston, D.; Wu, X.; Leek, D. M.; Liu, X.; Li, C. Observation of Nucleation and Growth of Pbse Magic-Sized Nanoclusters and Regular Nanocrystals. Small 2011, 7, 2250−2262.
(42) Yu, K. CdSe Magic-Sized Nuclei, Magic-Sized Nanoclusters and Regular Nanocrystals: Monomer Effects on Nucleation and Growth. Adv. Mater. 2012, 24, 1123−1132.
(43) García-Rodríguez, R.; Hendricks, M. P.; Cossairt, B. M.; Liu, H.; Owen, J. S. Conversion Reactions of Cadmium Chalcogenide Nanocrystal Precursors. Chem. Mater. 2013, 25, 1233−1249.
(44) Yu, K.; Ouyang, J.; Leek, D. M.; et al. Ultraviolet ZnSe1−xSx Gradient-Alloyed Nanocrystals via a Noninjection Approach. ACS Appl. Mater. Interfaces 2012, 4, 4302−4311.
(45) Yu, K.; Liu, X.; Zeng, Q.; Yang, M.; Ouyang, J.; Wang, X.; Tao, Y. The Formation Mechanism of Binary Semiconductor Nanomateri-als: Shared by Single-Source and Dual-Source Precursor Approaches. Angew. Chem. 2013, 125, 11240−11245.
(46) Reynolds, G.; Drexhage, K. New Coumarin Dyes with Rigidized Structure for Flashlamp-Pumped Dye Lasers. Opt. Commun. 1975, 13, 222−225.
Chemistry of Materials Article
DOI: 10.1021/acs.chemmater.5b04380 Chem. Mater. XXXX, XXX, XXX−XXX