Publisher’s version / Version de l'éditeur:
Questions? Contact the NRC Publications Archive team at
PublicationsArchive-ArchivesPublications@nrc-cnrc.gc.ca. If you wish to email the authors directly, please see the first page of the publication for their contact information.
https://publications-cnrc.canada.ca/fra/droits
L’accès à ce site Web et l’utilisation de son contenu sont assujettis aux conditions présentées dans le site
LISEZ CES CONDITIONS ATTENTIVEMENT AVANT D’UTILISER CE SITE WEB.
Journal of Applied Genetics, 57, 1, pp. 27-36, 2015-07-05
READ THESE TERMS AND CONDITIONS CAREFULLY BEFORE USING THIS WEBSITE.
https://nrc-publications.canada.ca/eng/copyright
NRC Publications Archive Record / Notice des Archives des publications du CNRC :
https://nrc-publications.canada.ca/eng/view/object/?id=4378133c-5247-4618-8787-852cd5e5cc00 https://publications-cnrc.canada.ca/fra/voir/objet/?id=4378133c-5247-4618-8787-852cd5e5cc00
NRC Publications Archive
Archives des publications du CNRC
This publication could be one of several versions: author’s original, accepted manuscript or the publisher’s version. / La version de cette publication peut être l’une des suivantes : la version prépublication de l’auteur, la version acceptée du manuscrit ou la version de l’éditeur.
For the publisher’s version, please access the DOI link below./ Pour consulter la version de l’éditeur, utilisez le lien DOI ci-dessous.
https://doi.org/10.1007/s13353-015-0302-9
Access and use of this website and the material on it are subject to the Terms and Conditions set forth at
Genetic analysis of seedling resistance to crown rust in five diploid oat (Avena strigosa) accessions
Genetic analysis of seedling resistance to crown rust in five diploid oat
(Avena strigosa) accessions
A. L. Cabral1,2, R. F. Park1
1University of Sydney, Plant Breeding Institute Cobbitty, Private Bag 4011, Narellan NSW, 2567, Australia
2National Research Council of Canada, 110 Gymnasium Place Saskatoon, SK S7N 0W9 Canada
Corresponding author E-mail: adrian.cabral@nrc-cnrc.gc.ca
Abstract
Crown rust, caused by Puccinia coronata Corda f. sp. avenae Eriks., is a serious menace in oats, for which resistance is an effective means of control. Wild diploid oat accessions are a source of novel resistances that first need to be characterized prior to introgression into locally adapted oat cultivars. A genetic analysis of resistance to crown rust was carried out in three diverse diploid oat accessions (CIav6956, CIav9020, PI292226) and two cultivars (Saia and Glabrota) of A. strigosa. A single major gene conditioning resistance to Australian crown rust pathotype (Pt) 0000-2 was identified in each of the three accessions. Allelism tests suggested that these genes are either the same, allelic, or tightly linked with less than 1% recombination. Similarly, a single gene was identified in Glabrota, and possibly two genes in Saia; both cultivars previously reported to carry two and three crown rust resistance genes, respectively. The identified seedling resistance genes could be deployed in combination with other resistance gene(s) to enhance durability of resistance to crown rust in hexaploid oat. Current diploid and hexaploid linkage maps and molecular anchor markers (simple sequence repeat [SSR] and diversity array technology [DArT] markers) should facilitate their mapping and introgression into hexaploid oat.
Keywords: allelism, genetic analyses, Puccinia coronata, seedling resistance
Introduction
Crown rust, caused by Puccinia coronata Corda f. sp. avenae Eriks., is a major disease of oat, occurring across nearly all oat growing areas of the world (Simons, 1970). In Australia, the pathogen is restricted to reproducing asexually due to the absence of its alternate host, Rhamnus spp. The year-round presence of wild oat, particularly in northern parts of New South Wales and in Queensland (Brouwer & Oates, 1986), where prevailing summer-dominant rainfall patterns favour their growth, enables continuous survival of the pathogen (Park, 2008). In wheat, this continuity in the life cycle of the leaf rust pathogen increases the chance of new pathotypes evolving through rare events including mutation (Watson 1981; Park et al. 1995; Brake et al., 2001) and somatic hybridisation (Park et al., 1999). Cultivars with major gene resistances that remain effective for only a few years (Carson, 2009) have not been successful in controlling crown rust in Australia (R.F Park, unpublished). However, single major gene resistances are more effective when deployed in areas where inoculum levels are low (Park, 2008). Of the 97 Pc genes identified thus far, 91 are effective at all growth stages, whereas six condition adult plant resistance (APR) (CDL, 2006). While a majority of the all stage resistance genes were identified in the wild hexaploid oat species A. sterilis (Simons et al., 1978), some have come from the diploid species A. strigosa, which was also reported as a potential source of stem rust resistance (Steinberg et al., 2005).
Genetic analyses of rust resistance involve studies on the inheritance of resistance in progeny resulting from crosses between resistant and susceptible genotypes. Further, crosses between resistant varieties will determine if the resistance genes thus identified are allelic or different. To be successful, a genetic study to identify the number of
that can be determined from any genetic hypothesis. For this, Hanson (1959) described formulae to determine minimum family sizes in terms of numbers of progeny required to carry out a genetic analysis of crosses in which different numbers of genes are segregating.
The present study involved a genetic analyses of resistance to crown rust Pt. 0000-2 in three accessions from diverse geographical regions (CIav6956, CIav9020, PI292226) and the cultivars Saia and Glabrota, all belonging to the diploid species A. strigosa. Pathotype 0000-2 was chosen for its broader virulence on diploids, when compared to other pathotypes of our collection. The objective of the experiment was to determine the number of genes present in each genotype. The three accessions were shown previously to be resistant to eight Australian crown rust pathotypes (Cabral & Park, 2014). While virulence to Saia exists in Australia, no isolate with virulence for Glabrota has been detected (R.F Park, unpublished). Genetic analyses of Saia and Glabrota were conducted to verify earlier reports of the presence of the resistance genes Pc15, Pc16 and Pc17 in the former and Pc18 and Pc29 in the latter (CDL, 2006). Because these earlier studies did not generate single gene stocks for each of these genes, it was hoped that this could also be achieved in the present work.
Materials and Methods
Plant materialsA genetic analysis of resistance to crown rust was carried out in three diploid Avena
strigosa accessions CIav6956, CIav9020 and PI292226, from a USDA National Small
Grains Collection, and in two diploid Avena strigosa cultivars Saia and Glabrota, maintained at the Plant Breeding Institute Cobbitty (PBIC). Each of these five genotypes was crossed separately to a susceptible accession CIav9112, also taken from the same USDA National Small Grains Collection.
Experimental design
The four accessions used in Experiment 1 were chosen from among an initial set of 20 accessions, which were first tested as seedlings with crown rust Pt. 0000-2 (PBI rust isolate accession no. 982774) and Pt. 4473-4,6,10 (PBI rust isolate accession no. 013535) (Cabral and Park 2014) and later categorised as either resistant or susceptible to both pathotypes. This resulted in the identification of 10 resistant and 10 susceptible accessions, which were crossed in various combinations. Florets on panicles of the female parent were emasculated and bagged to prevent contamination from foreign/undesired pollen. The following season, genotypes were selected based on flowering synchrony, pollen production and plant height/crossing-suitability. Three resistant pollen parents CIav6956, CIav9020 and PI292226 and a single susceptible female parent, CIav9112, were thus selected for Experiment 1. In Experiment 2, cultivars Saia and Glabrota, both resistant to the above two pathotypes, were used as pollen parents and accession CIav9112 was used as the susceptible female parent.
The F2 populations for all five crosses were each derived from two F1 plants (Fig1.). Seedling-progeny from all crosses were tested with Pt. 0000-2 in the F2 and F3 generations. For the CIav9112/Saia cross, a third Pt. 0207-5,6,10 (PBI rust isolate accession no. 962510) was tested on F4 seedlings (as F2 and F3 seed was used up) in order to confirm/determine the number of resistance genes effective against Pt. 0207-5,6,10 in cultivar Saia. Approximately 80–100 seeds of a single plant were taken from among the 20–30 F3plants previously phenotyped at the seedling stage with Pt. 0000-2.
Although the parental genotypes used in the two crossing experiments belonged to the same species, A. strigosa, their diverse origins and difficulty in crossing prompted the use of embryo rescue to hasten the recovery of healthy F1 seedlings. Immature F1 seeds harvested 15–18 days after crossing were subjected to the rescue procedure described by Sidhu et al. (2006). The caryopsis was washed initially in 95% ethanol for 30 seconds and then in 10–15 ml of bleach for five minutes, followed by a final rinse (2–3 times) in sterile water. Rescued embryos were placed in test tubes containing Gamborg’s medium, stored in darkness for two days at 4˚C, and later kept at room temperature for the next two days before being placed in a culture room. Two weeks later, seedlings were transplanted into potting mix and left to harden in an illuminated cold room maintained at 14˚C. Two to three weeks later, F1 plants were transferred to growth rooms, where they remained until maturity.
Seedling inoculation and disease scoring
The parental accessions were tested for response to crown rust pathotypes 0000-2 and 4473-4,6,10 obtained from the PBI culture collection. A third pathotype, 0207-5,6,10 was also used to test F4 progeny from the cross CIav9112/Saia. Fourteen day-old F2 and F3 seedlings from each of the five crosses were inoculated separately with Pt. 0000-2, as described in Cabral & Park (2014). Urediniospores suspended in a light mineral oil were sprayed over the seedlings using an atomiser. The seedlings were then placed in a misting chamber at room temperature for 24 hours, and later transferred to a growth room maintained at 23˚C. Two weeks later, seedlings were scored for crown rust response using an IT scale of “0”–“4” described by Murphy (1935), with minor modifications (refer Cabral and Park, 2014). While IT scores between “0” and “2” were considered resistant, those between “2–3” and “3” were indicative of moderate resistance, and scores of “3–3+” and “3+” indicated susceptibility. The letters “c” and “n”denote chlorosis and necrosis respectively, while ‘‘+’’ or ‘‘-’’ signs following an
IT score indicate the level of intensity of infection or an intermediate IT response. All F2 plants were selfed and grown to maturity for F3 seed. At harvest, 20–30 F3 seeds from each plant were planted separately, inoculated with Pt. 0000-2, and scored two weeks later.
Tests of allelism
The F2 and F3 progenies from each of the three resistant parent intercrosses (CIav6956/PI292226, CIav6956/CIav9020, PI292226/CIav9020) were used to study allelism between the resistance genes detected in the resistant by susceptible crosses. One hundred and fifty F2 seedlings from each cross were inoculated with Pt. 0000-2.
Statistical analyses
Chi-squared (2) analyses of the data from F
2 and F3 progeny were conducted for all crosses, in order to test the goodness-of-fit of observed to expected segregation ratios. The 2 statistic was calculated using the formula 2 = (O - E)2/ E, where O and E represent the respective observed and expected frequencies of resistant and susceptible F2 individuals, and homozygous or non-segregating resistant (NSR), segregating (SEG) and homozygous or non-segregating susceptible (NSS) F3 families. The maximum recombination value (p) was calculated using the formula given by Hanson (1959): PRC = [1- n√P]; where ‘PRC’ (probability of observing recombinant types) = 2p - p2 (for complete F2& F3data), ‘n’ is the number of F2 individuals and P = 0.05. The p value is determined from the quadratic formula: p = - b ± √ b2– 4ac / 2a, given ap2+ bp + c =
0 (Kramer & Burnham, 1947; Adhikari, 1996).
Results
A total of 128 F2 seedlings were tested with Pt. 0000-2 (Suppl Table S1). Of these, 46 F2 seedlings in Family 1 segregated 37 resistant and 9 susceptible, fitting a 3:1 segregation ratio (χ2
(1df) = 0.72; P = 0.5 – 0.3), and 82 F2 seedlings in Family 2 segregated 62 resistant and 20 susceptible, also fitting a 3:1 ratio (χ2
(1df) = 0.02; P = 0.9 – 0.5). A Chi-squared test for heterogeneity involving Families 1 and 2 returned a non-significant value (χ2
(1df) = 0.45; P = 0.9 – 0.5), and thus data from both families were pooled i.e. 99 resistant (ITs ranging between “;cn” & “1–2cn”) and 29 susceptible F2 seedlings (Table 1), fitting a 3:1 segregation ratio (χ2
(1df) = 0.29; P = 0.9 – 0.5).
Of the 128 F2 seedlings that were transplanted for subsequent seed production, 94 survived. The 94 F3 families generated were tested with Pt. 0000-2 and segregated 51 non-segregating resistant (NSR): 23 segregating (SEG): 20 non-segregating susceptible (NSS) (Suppl Table S2), which did not fit a 1:2:1 ratio (χ2
(2df) = 45.30; P < 0.05). However, on grouping the NSR and SEG classes, an F3 ratio of 74:20 (resistant: susceptible) was obtained (Table 1), in agreement with a 3:1 ratio (χ2
(1df)= 0.69; P = 0.5 – 0.3) for segregation of a single dominant locus. Individual Chi-squared values of the 23 segregating families are given in Suppl Table S3.
CIav9112/PI292226
A total of 131 F2 seedlings were tested with Pt. 0000-2 (Suppl Table S4). Of these, 71 seedlings (Family 1) segregated 57 resistant and 14 susceptible, (χ2
(3:1) (1df) = 1.05; P = 0.5 – 0.3), and 60 seedlings (Family 2) segregated as 48 resistant and 12 susceptible (χ2
(3:1) (1df) = 0.80; P = 0.5 – 0.3). A Chi-squared test for heterogeneity involving Families 1 and 2 returned a non-significant value (χ2
(1df) = 0.0; P = 1.0) (Table 2). Of the 131 F2 seedlings transplanted, 87 survived and their corresponding 87 F3 families segregated 46 NSR: 27 SEG: 14 NSS (Suppl Table S5), which did not fit a 1:2:1 ratio (χ2
of 73R:14S was obtained in agreement with a 3:1 ratio (χ2
(1df)= 3.68; P = 0.1 – 0.05) for segregation at a single dominant locus (Table 2). Individual chi-squared values of the 27 segregating families are given in Suppl Table S6.
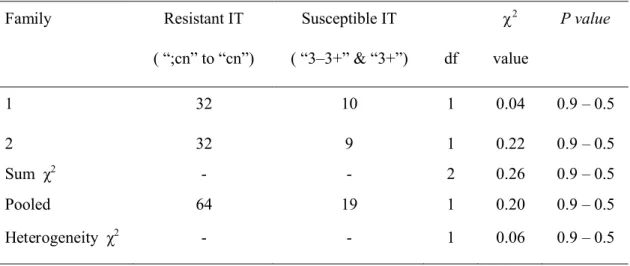
CIav9112/CIav9020
A total of 83 F2 seedlings were tested with Pt. 0000-2 (Suppl Table S7). A Chi-squared test for heterogeneity involving Families 1 and 2 returned a non-significant value (χ2
(1df) = 0.06; P = 0.9 – 0.5), and thus data from both families were pooled i.e. 64 resistant (ITs ranging between “;cn” & “1–2cn”) and 19 susceptible F2 seedlings (Table 3), fitting a 3:1 segregation ratio (χ2
(1df) = 0.20; P = 0.9 – 0.5). Due to poor recovery of seed, F3tests were not carried out using Pt. 0000-2.
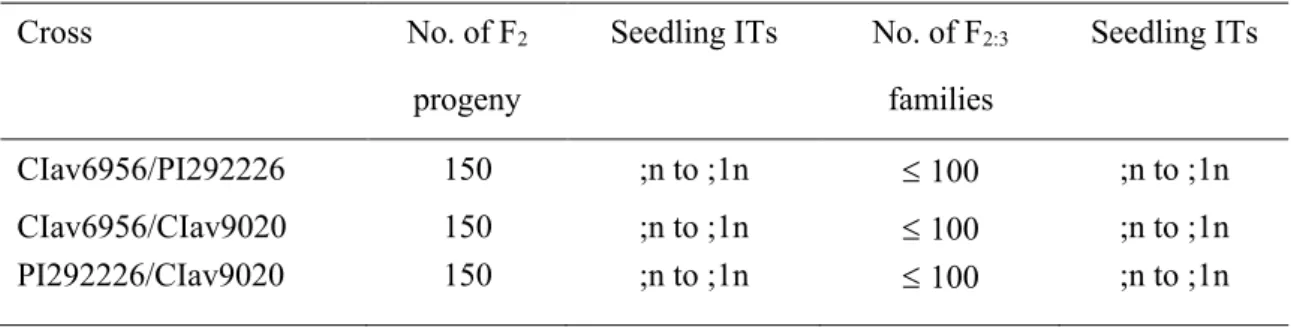
Tests of allelism
One hundred and fifty F2 seedlings from each of the three resistant parent intercrosses were inoculated with Pt. 0000-2. All F2 seedling populations failed to segregate, producing ITs of “;n” to “;1n”. Further, 100 F2 seedlings from each cross were transplanted and grown to maturity to generate F3 seed. Twenty F3 seeds from each of the 100 F2 plants were inoculated with Pt. 0000-2. No segregation was observed among or within the F3 progeny (Table 4). Further, taking into consideration complete numbers of F2 individuals and F3 families, and assuming the genes for resistance in any two parents were different, the probability of observing recombinant types was calculated using the maximum recombination value (p) between two loci. The p value was found to be less than 0.01, at P = 0.05, suggesting less than 1% recombination, or that fewer than 10 of 1,000 F3 lines would be segregating or homozygous susceptible.
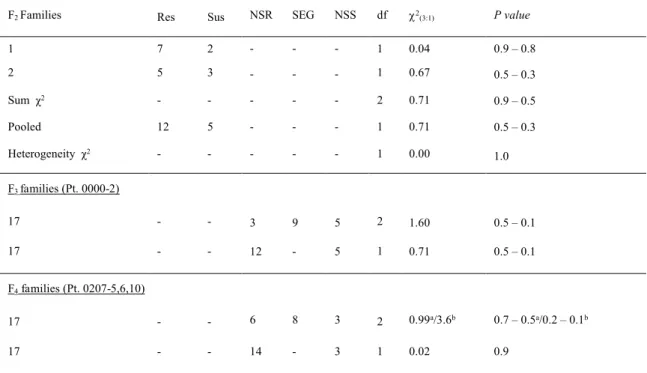
Tests with Pt. 0000-2: Due to a severe aphid infestation of the bagged F1 panicles, only 17 viable F2 seeds were recovered from two F1 plants. The resultant F2 ITs, reactions of F3 families, with Chi-squared values for individual segregating families, and a heterogeneity Chi-squared value, are given in Table 6.
Tests of the 17 F2 seedlings (χ2(3:1)= 0.71; P = 0.5 – 0.3) fitted a 3:1 ratio implying segregation at a single locus (Table 5). For the F3 tests, 20–30 seedlings from each of the 17 F2 plants were tested with Pt. 0000-2. The 17 F3 families segregated as 3 NSR: 9 SEG: 5 NSS, which fitted a 3:1 ratio (χ2 value of 0.2; P = 0.9 – 0.5) (Tables 5), on pooling the NSR and SEG families.
Tests with Pt. 0207-5,6,10: The above test with Pt. 0000-2 detected a single seedling
resistance gene in Saia, previously reported to carry three genes. Therefore, a second Pt. 0207-5,6,10 was tested on F4 seedlings (as F2 and F3 seed was used up) derived from selfed seed of a single plant taken from among the 20–30 F3 plants previously phenotyped at the seedling stage with Pt. 0000-2. Approximately 80–100 F4seedlings from each of these 17 families were tested with Pt. 0207-5,6,10, to determine the number of resistance genes effective against Pt. 0207-5,6,10 in cultivar Saia.
The 17 F4 families segregated 6 NSR: 8 SEG: 3 NSS (2 (1:2:1) = 0.99; P = 0.7 – 0.5). On grouping NSR and SEG classes, a 3:1 segregation ratio (2 = 0.02; P = 0.9), suggesting resistance to Pt. 0207-5,6,10 was also conditioned by a single dominant gene. However, the eight SEG families showed significant deviations from a 3:1 ratio (data not shown). Further, the observed ratios of the 17 F4 families (6 NSR: 8 SEG: 3 NSS) were also a good fit for a two-gene model (2
(7:8:1) = 3.6; P = 0.2 – 0.1) (Table 5). Of the eight SEG families, comprising a total of 651 plants, four were a fit for a 9:7 ratio suggestive of complimentary gene action, with one family (#8) returning a
significant P value of < 0.05. Three families (#3,4,13) were a fit for a 7:9 ratio, of which one (#3) had a significant P value of < 0.01. Finally, a 15:1 segregation was observed for a single family (#2; Table 6). The resistant ITs of “;1” to “2–3” observed in response to Pt. 0207-5,6,10 (in F4populations) were slightly higher than those of “;” to “1–2” with Pt. 0000-2 (in F3 populations). Additionally, tests with Pt. 0000-2 identified three families to be NSR, while only two of these three families were confirmed to be NSR when tested with Pt. 0207-5,6,10. This suggests that the gene conditioning resistance to Pt. 0000-2 in Saia is different from the genes conditioning resistance to Pt. 0207-5,6,10.
CIav9112/Glabrota
A test of 77 F2 seedlings (Suppl Table S8) with Pt. 0000-2 confirmed segregation at a single locus (Table 7). Due to a poor recovery of seed, testing of the F3 generation with Pt. 0000-2 could not be carried out.
Discussion
Genetic analyses of resistance to crown rust Pt. 0000-2 in F2 and F3 seedling progenies crosses CIav9112/CIav6956, CIav9112/PI292226 and CIav9112/CIav9020 established that the respective resistant parental lines each carried a single dominant gene. Allelism tests suggested that these accessions carried the same gene, or if different, the genes were linked at less than 1 cM. Cross CIav9112/Glabrota was tested with Pt. 0000-2, and resistance was conferred by a single dominant gene. Tests of CIav9112/Saia with Pt. 0000-2 also implicated a single dominant gene in cultivar Saia effective against Pt. 0000-2, with the possibility of two genes segregating in response to Pt. 0207-5,6,10.
In annual cereal rust surveys conducted by the PBI, Pt. 0000-2 was first reported to be prevalent in Western Australia and South Australia during 2003-2004, and was found
to be avirulent on all genotypes in the crown rust differential set except the genotype carrying Pc46 (Park & Kavanagh, 2004). The same pathotype was collected in New South Wales and Queensland during 2005–06, and has steadily prevailed since, in eastern and Western Australia (Park & Kavanagh, 2008). The broad avirulence and continued prevalence of Pt. 0000-2 in Australia were factors that prompted its use in the genetic analyses reported here. The detection of a single resistance gene in Saia with this pathotype and possibly two with Pt. 0207-5,6,10 was therefore unexpected, as was the detection of a single resistance gene in Glabrota, previously reported to carry resistance genes Pc18 and Pc29.
The susceptible parent CIav9112, collected in Ontario Canada (GRIN, 2009), is less vigorous, weedy and shorter in stature compared to the three resistant parental accessions. It was susceptible to all eight crown rust pathotypes tested by Cabral & Park (2014). The resistant accessions CIav6956, PI292226 and CIav9020, collected from Canada, Israel and Argentina, respectively, were all very similar in morphology and had identical ITs to the eight pathotypes used despite the large distances between their origins (Cabral & Park, 2014). This could suggest that all three resistant accessions might actually be identical or derivatives of a common parental accession. Comparative tests of the genotypes using molecular markers could help resolve this.
In Experiment 1, the F2 progeny resulting from each of the three crosses CIav9112/CIav6956, CIav9112/PI292226 and CIav9112/CIav9020 were tested with Pt. 0000-2. The resistant: susceptible F2 data fitted an expected 3:1 segregation ratio (Tables 1, 2 & 3), indicating a single gene segregation in each cross. These results suggested that seedling resistance to Pt. 0000-2 in each wild oat accession was governed by a single dominant gene. Further, Chi-squared tests of data from F3 progeny of crosses CIav9112/CIav6956 and CIav9112/PI292226, with the above
pathotype returned significant values for an expected 1:2:1 segregation ratio. However, on grouping NSR and SEG classes, non-significant chi-squared values were observed, consistent with the presence of a single dominant gene (Tables 1 & 2). The deviation from a 1:2:1 segregation ratio among F3 progeny of the crosses CIav9112/CIav6956 and CIav9112/PI292226 appeared to be due to an excess of NSR families. A possible explanation for the comparatively lower number of SEG families might be that the resistance genes displayed partial dominance, which coupled with temperature sensitivity (Bonnett et al., 2002), could have led to the misclassification of at least some heterozygous resistant plants as susceptible. However, this might not explain the lower numbers of NSS F3 familes observed for both crosses. Therefore, an alternative explanation for an excess of NSR families, and a relatively fewer number of SEG families might be cooler night-time temperatures at testing, resulting in heterozygous resistant plants being misclassified as resistant.
Tests of allelism were conducted among the three resistant parental accessions (CIav6956, PI292226, CIav9020). All F2 and F3 populations from the resistant intercrosses failed to segregate (Table 4), indicating that the resistance gene in each of the three parents was the same, allelic, or tightly linked. Given that similar disease ITs of “;n” and “;1n” were obtained for the three parental accessions and all their respective F2 and F3 progeny populations, it would appear that the genotypes carry a common gene. If the genes for resistance in any two parents were different, the maximum recombination value (for complete F2 and F3 data) at P = 0.05 would be less than 0.01 (Hanson, 1959). In this case, the probability of observing double recessive recombinants among F2 progeny populations of the respective three crosses or the PRC value was 0.000625, and the corresponding F2 population size thus required, was calculated to be approximately 7,380 plants. Given the difficulties in making crosses
population sizes would have been beyond the resources of the present study. In
Experiment 2, results of separate tests of progeny from the cross CIav9112/Saia
confirmed the presence of a single resistance gene in response to Pt. 0000-2, and possibly two genes in response to Pt. 0207-5,6,10, in Saia. The resistance gene(s) detected with each pathotype are probably different, based upon differences in the respective low ITs and numbers of NSR families identified in tests with the two pathotypes. In a genetic analysis of crown rust resistance in F2 progeny of reciprocal crosses between accessions CI 4748 and CD 3820 to two North American races, Murphy et al. (1958) postulated three resistance genes in accession CD 3820 and further reported that this accession was identical to cultivar Saia based on similar responses to a series of North American pathotypes. However, in the current literature (CDL, 2006), the three genes Pc15, Pc16 and Pc17 are reported in Saia but not in CD 3820. While the origin of this discrepancy is unknown, it is possible that the tentative system of gene nomenclature proposed by the Committee of Genetic Nomenclature in Oats (Dyck & Zillinsky, 1963) may have contributed. Although there are currently 97 designations for Pc genes, Park (2008) mentioned the difficulty in identifying many of the genes due to a lack of single gene reference stocks. The present studies provide good examples to illustrate this difficulty as only one or at most two genes could be detected in Saia, and it is not known if these genes represent Pc15, Pc16, Pc17 or a different undescribed gene. Also, the fact that resistance gene characterization in oat is solely dependent on pathotypes known to undergo shifts in virulence should highlight an urgent need for the development and maintenance of single gene reference stocks.
Because the cultivar Saia was reported to carry three genes, Pc15, Pc16 and Pc17 (Murphy et al., 1958) for resistance to crown rust, selected F4 lines from CIav9112/Saia were tested with a second pathotype (Pt. 0207-5,6,10) which produced a different infection type on Saia (“;++n”) compared to Pt. 0000-2 (“;n”). Results of
this test gave no unambiguous gene numbers for resistance to Pt. 0207-5,6,10 in Saia. The genes conferring resistance to both these pathotypes were apparently different because one of the three NSR F3 families homozygous to Pt. 0000-2, segregated in response to Pt. 0207-5,6,10 in the F4 generation (Table 6). Therefore, neither can the possibility of additional resistance genes in Saia, against other pathotypes be ruled out, nor can the hypothesis of the presence of three resistance genes in Saia be rejected.
A pooled Chi-squared analysis of data from tests of F2 progeny of cross CIav9112/Glabrota with Pt. 0000-2 supported the presence of a single dominant resistance gene. Individual Chi-squared values for Families 1 and 2 were also non-significant, hence strengthening the conclusion of segregation at a single locus (Table 7). Because confirmation tests of the F3 progeny could not be carried out due to a lack of seed, the assumption of a single gene for resistance to Pt. 0000-2 in Glabrota, based only on F2 seedling data and a single isolate, is not entirely conclusive. Cultivar Glabrota is reported to carry genes Pc18 and Pc29 (CDL, 2006). Upon tests of F2 progeny of crosses CI2630/CI3214 and CI2630/CI7010 with races 205 and 264, and further tests of F2 and F3 progeny of the cross CI2630/CI1994 with races 216 and 264, Simons et al. (1959) concluded that a single dominant gene was present in accession CI2630 (Glabrota). In studies involving two accessions of A. strigosa glabrescence, Marshall & Myers (1961) reported a single partially dominant gene for resistance in accession CI2835, and two independent dominant genes in CI2524, either or both conditioning resistance to crown rust. In the present study, the resistant ITs of cultivar Glabrota (“0” & “1–2”), and those of accessions CI2835 (“0;” & “1”) and CI2630 (“I”-no macroscopic evidence of infection), were nearly identical. This strongly suggests the possibility of a single gene for resistance to crown rust in cultivar Glabrota, or more likely that Pt. 0000-2 was only able to detect a single resistance gene in this
Based on results of the allelism tests and multi-pathotype seedling tests (Cabral & Park, 2014), the three resistant parental accessions CIav6956, CIav9020 and PI292226 might be assumed to carry an identical crown rust resistance gene. Studies reported in Cabral et al. (2013) showed that accessions CIav6956 and CIav9020 were identical and accession PI292226 distinct when tested with 11 SSR markers. It is hence possible that accessions CIav6956 and CIav9020 are selections of a single parental accession, despite their distant collection sites. This is possible because oat accessions have often been distributed around the world in nursery sets and hence the country of collection might not necessarily be the place from which a given accession originated (G. J Scoles, personal communication).
The use of F2 derived populations for studies of allelism in wild oat was found to be unsuitable, given the difficulties involved in hybridisation, and subsequent generation of large progeny populations. Although future experiments of a similar nature should ideally involve backcross populations derived from each of the three accessions, obtaining the required number of progeny will likely remain a challenge, besides the complicated task of introgression of resistance from A. strigosa to A. sativa. A single gene or possibly two genes for resistance to crown rust was identified in Saia, whereas an earlier report (Murphy et al., 1958) suggested the presence of three genes. As the current results are based on an analysis of a mere 17 F2individuals and their derived F3 families, further confirmation should be made. However, it is unlikely that more than two genes were effective against the pathotypes used, because the number of susceptible F2 plants was greater than a third of the total of 17 plants. Additionally, a single gene was detected in cultivar Glabrota, which was reported to carry two genes for resistance to crown rust. Because only a small F2 population from CIav9112/Glabrota was tested with Pt. 0000-2, the experiment should be repeated in
order to obtain a correct estimate of the number of genes present in Glabrota. The fact that a different set of crown rust pathotypes was used in the earlier study might account for the discrepancies in the number of genes in Saia, an explanation that could also be extended to results for Glabrota.
The current system of nomenclature for Pc genes is not based on single gene reference stocks or rigorous tests of allelism with previously designated loci, making it next to impossible to accurately identify them or to discriminate new resistance genes from them. The value of these current Pc gene designations is therefore questionable and needs to be revisited. This might involve replacing the entire resistance gene nomenclature system with a new one in which resistance genes are designated strictly on the basis of single gene reference stocks, a defined set of pathogen isolates and mapped chromosomal positions.
The development of increasing numbers of molecular markers in oat such as genomic SSRs (Li et al., 2000; Pal et al., 2002), EST-derived SSRs (Becher, 2007) and DArTs (Tinker et al., 2009) should aid in characterising such genes more fully. Furthermore, the difficulties associated with generating large populations to identify and characterise resistance genes accurately in diploid genotypes could be reduced by using doubled haploid (DH) populations (Rines, 1983; Rines & Dahleen, 1990; Kiviharju et al., 2000; Kiviharju, 2009). However, currently, DH populations are only available for hexaploid oat (Tanhuanpää et al., 2008 & 2012).
The current availability of diploid oat linkage maps (O'Donoughue et al., 1992; Rayapati, et al., 1994; Yu et al., 2000; Kremer et al., 2001) and molecular anchor markers (DArTs, SSRs) might enable tagging of the genes identified in our study.
highly effective in combating crown rust. Therefore, the seedling resistance genes identified in our study are significant and could also be novel given their wild diploid sources. However, these single seedling resistances might only be useful if deployed in combination with other resistance gene(s).
Acknowledgements
The author thanks Prof. Robert McIntosh for his comments on the manuscript, and acknowledges funding from the Sir Alexander Hugh Thurburn Faculty Scholarship, University of Sydney and the Grains Research and Development Corporation (GRDC), Australia.
References
Adhikari KN (1996) Genetic studies of stem rust resistance in oat and triticale. Sydney, Australia: University of Sydney, PhD Thesis
Becher R (2007) EST- derived microsatellites as a rich source of molecular markers for oats. Plant Breeding 126:274–278
Bonnett DG, Park RF, McIntosh RA, Oates JD (2002) The effects of temperature and light on interactions between Puccinia coronata f. sp. avenae and Avena spp. Australas Plant Path 31:185–192
Brake VM, Irwin JAG, Park RF (2001) Genetic variation in Australian isolates of
Puccinia coronata f. sp. avenae using molecular and pathogenicity markers. Australas
Plant Path 30:259–266
Brouwer JB, Oates JD (1986) Regional variation of Puccinia coronata avenae in Australia and its implication for oat breeding. Ann Appl Biol 109:269–277
Cabral AL, Karaoglu H, Park RF (2013) The use of microsatellite polymorphisms to
characterise and compare genetic variability in Avena strigosa and A. barbata.Genet
Cabral AL, Park RF (2014) Seedling resistance to Puccinia coronata f. sp. avenae in
Avena strigosa, A. barbata and A. sativa. Euphytica 196:385–395
Carson ML (2009) Crown rust development and selection for virulence in Puccinia
coronata f. sp. avenae in an oat multiline cultivar. Plant Dis 93:347–353
CDL (2006) Oat crown rust resistance genes. USDA, ARS, Cereal Disease Laboratory. [http://www.cdl.umn.edu/res-gene/ocr.html]. Accessed 12 December 2006
O'Donoughue LS, Wang Z, Röder M, Kneen B, Leggett M, Sorrells ME, Tanksley SD (1992) An RFLP-based linkage map of oats based on a cross between two diploid taxa
(Avena atlantica × A. hirtula). Genome 35:765–771
Dyck PL, Zillinsky FJ (1963) Inheritance of crown rust resistance transferred from diploid to hexaploid oats. Can J Genet Cytol 5:398
GRIN (2009) Germplasm Resources Information Network. USDA, ARS, National Genetic Resources Program. [http://www.ars-grin.gov/]. Accessed 14 January 2009 Hanson WD (1959) Minimum family sizes for the planning of genetic experiments. Agron J 51:711–715
Kiviharju EM, Puolimatka M, Saastamoinen M (2000) Extension of anther culture to several genotypes of cultivated oats. Plant Cell Rep 19:674–679
Kiviharju EM (2009) Anther culture derived doubled haploids in oat. In: Touraev A et al (ed) Advances in Haploid Production in Higher Plants. Springer, Netherlands, pp
171–178
Kramer HH, Burnham CR (1947) Methods of combining linkage intensity values from backcross, F2and F3 genetic data. Genetics 32:379–390
Kremer CA, Lee M, Holland JB (2001) A restriction fragment length polymorphism
based linkage map of a diploid Avena recombinant inbred line
Li CD, Rossnagel BG, Scoles GJ (2000) The development of oat microsatellite markers and their use in identifying relationships among Avena species and oat cultivars. Theor Appl Genet 101:1259–1268
Marshall HG, Myers WM (1961) A cytogenetic study of certain Avena hybrids, and the inheritance of resistance in diploid and tetraploid varieties to races of crown rust. Crop Sci 1:29–34
Murphy HC (1935) Physiologic specialization in Puccinia coronata avenae. USDA Technical Bulletin No. 433, Washington, D.C
Murphy HC, Zillinsky FJ, Simons MD, Grindeland R (1958) Inheritance of seed color and resistance to races of stem and crown rust in Avena strigosa. Agron J 50:539–541 Pal N, Sandhu JS, Domier LL, Kolb FL (2002) Development and characterization of microsatellite and RFLP derived PCR markers in oat. Crop Sci 42:912–918
Park RF, Burdon JJ, McIntosh RA (1995) Studies on the origin, spread, and evolution
of an important group of Puccinia recondita f. sp. tritici pathotypes in Australasia.Eur
J Plant Pathol101:613–622
Park RF, Burdon JJ, Jahoor A (1999) Evidence for somatic hybridization in the leaf rust pathogen of wheat (Puccinia recondita f. sp. tritici). Mycol Res 103:715–723 Park RF, Kavanagh P (2004) Cereal rust survey–Annual report 2003–2004. University of Sydney, Plant Breeding Institute, Cobbitty
Park RF (2008) Breeding cereals for rust resistance in Australia. Plant Pathol 57:591– 602
Park RF, Kavanagh P (2008) Cereal rust survey–Annual report 2007–2008. University of Sydney, Plant Breeding Institute, Cobbitty
Rayapati PJ, Gregory JW, Lee M, Wise RP (1994) A linkage map of diploid Avena based on RFLP loci and a locus conferring resistance to nine isolates of Puccinia
Rines HW (1983) Oat anther culture: genotype effect on callus initiation and the production of a haploid plant. Crop Sci 23:268–272
Rines HW, Dahleen LS (1990) Haploid oat plants produced by application of maize pollen to emasculated oat florets. Crop Sci 30:1073–1078
Sidhu PK, Howes NK, Aung T, Zwer PK, Davies PA (2006) Factors affecting oat
haploid production following oat × maize hybridization. Plant Breeding 125:243–247
Simons MD, Sadanaga K, Murphy HC (1959) Inheritance of resistance of strains of diploid and tetraploid species of oats to races of the crown rust fungus. Phytopathology 49:257–259
Simons MD (1970) Crown Rust of Oats and Grasses. The American Phytopathological Society, Monograph No. 5
Simons MD, Martens JW, McKenzie RIH, Nishiyama I, Sadanaga K, Sebesta J, Thomas H (1978) Oats: A standardized system of nomenclature for genes and chromosomes and catalogue of genes governing characters. USDA Agriculture Handbook No. 509
Steinberg GJ, Fetch MJ, Fetch TG Jr (2005) Evaluation of Avena spp. accessions for resistance to oat stem rust. Plant Dis 89:521–525
Tinker NA, Kilian A, Wight CP, Uszynska KH, Wenzl P, Rines HW, Bjørnstad A, Howarth CJ, Jannink JL, Anderson JM, Rossnagel BG, Stuthman DD, Sorrells ME, Jackson EW, Tuvesson S, Kolb FL, Olsson O, Federizzi LC, Carson ML, Ohm HW, Molnar SJ, Scoles GJ, Eckstein PE, Bonman JM, Ceplitis A, Langdon T (2009) New DArT markers for oat provide enhanced map coverage and global germplasm characterization. BMC Genomics 10:39
Tanhuanpää P, Kalendar R, Schulman AH, Kiviharju E (2008) The first doubled
Tanhuanpää P, Manninen O, Beattie A, Eckstein P, Scoles G, Rossnagel B, Kiviharju E (2012) An updated doubled haploid oat linkage map and QTL mapping of agronomic and grain quality traits from Canadian field trials. Genome 55:289-301
Yu GX, Wise RP (2000) An anchored AFLP-and retrotransposon-based map of diploid Avena. Genome 43:736-749
Watson IA (1981) Wheat and its rust parasites in Australia. In: Evans LT, WJ Peacock (eds) Wheat science today and tomorrow. Cambridge University Press, United
Table 1 Segregation of response to Puccinia coronata f. sp. avenae pathotype 0000-2 among F2seedlings, and segregating resistant (NSR), segregating (SEG) and non-segregating susceptible (NSS) F3families from the cross CIav9112/CIav6956
a-2
(1:2:1) (2df); *Chi-squared values significant at P < 0.05
F2 families Res ITs Sus ITs NS SEG NS df 2
(3:1) P value “;cn” to “1–2” “3–3+”&“3+” 1 37 9 - - - 1 0.72 0.5 – 0.3 2 62 20 - - - 1 0.02 0.9 – 0.5 Sum χ2 - - - - - 2 0.74 0.9 – 0.5 Pooled 99 29 - - - 1 0.29 0.9 – 0.5 Heterogeneity χ2 - - - - - 1 0.45 0.9 – 0.5 F3 families 94 - - 51 23 20 2 44.95a < 0.01* 94 - - 74 - 20 1 0.69 0.5–0.3
Table 2 Segregation for response to Puccinia coronata f. sp. avenae pathotype 0000-2 among F2seedlings, and segregating resistant (NSR), segregating (SEG) and non-segregating susceptible (NSS) F3families from the cross CIav9112/PI292226
a-2 (1:2:1) (2df); *Chi-squared values significant at P < 0.05
F2 families Res ITs Sus ITs N SEG NS df 2
(3:1) P value “;cn” to “1–2” “3–3+”&“3” 1 57 14 - - - 1 1.05 0.5 – 0.3 2 48 12 - - - 1 0.80 0.5 – 0.3 Sum χ2 - - - - - 2 1.85 0.5 – 0.3 Pooled 105 26 - - - 1 1.85 0.5 – 0.3 Heterogeneity χ2 - - - - - 1 0.00 1.0 F3 families 87 - - 4 6 27 14 2 37.13 a < 0.05* 87 - - 7 3 - 14 1 3.68 0.1 – 0.05
Table 3 Segregation for response to Puccinia coronata f. sp. avenae pathotype 0000-2 among F2seedlings from the cross CIav9112/CIav9020
Family Resistant IT Susceptible IT 2 P value
( “;cn” to “cn”) ( “3–3+” & “3+”) df value 1 32 10 1 0.04 0.9 – 0.5 2 32 9 1 0.22 0.9 – 0.5 Sum χ2 - - 2 0.26 0.9 – 0.5 Pooled 64 19 1 0.20 0.9 – 0.5 Heterogeneity χ2 - - 1 0.06 0.9 – 0.5
Table 4 Segregation for infection type (IT) response to Puccinia coronata f. sp. avenae pathotype 0000-2 of F2seedlings and F2:3families of resistant parent intercrosses between three wild oat accessions
Cross No. of F2 Seedling ITs No. of F2:3 Seedling ITs
progeny families
CIav6956/PI292226 150 ;n to ;1n 100 ;n to ;1n
CIav6956/CIav9020 150 ;n to ;1n 100 ;n to ;1n
Table 5 Segregation of response to Puccinia coronata f. sp. avenae pathotypes 0000-2 and 0207-5,6,10 among F2, non-segregating resistant (NSR), segregating (SEG) and non-segregating susceptible (NSS) F3 and F4families derived from the cross CIav9112/Saia
a-2 (1:2:1) (2df); b-2 (7:8:1) (2df)*Chi-squared values significant at P < 0.05
F2 Families Res Sus NSR SEG NSS df 2(3:1) P value
1 7 2 - - - 1 0.04 0.9 – 0.8 2 5 3 - - - 1 0.67 0.5 – 0.3 Sum χ2 - - - - - 2 0.71 0.9 – 0.5 Pooled 12 5 - - - 1 0.71 0.5 – 0.3 Heterogeneity χ2 - - - - - 1 0.00 1.0 F3 families (Pt. 0000-2) 17 - - 3 9 5 2 1.60 0.5 – 0.1 17 - - 12 - 5 1 0.71 0.5 – 0.1 F4families (Pt. 0207-5,6,10) 17 - - 6 8 3 2 0.99a/3.6b 0.7 – 0.5a/0.2 – 0.1b 17 - - 14 - 3 1 0.02 0.9
Table 6 Infection types (ITs) of 17 F2 plants and their respective F3 and F4families from the cross CIav9112/Saia tested with Puccinia coronata f. sp. avenae pathotypes (Pts.) 0000-2 and 0207-5,6,10 along with the heterogeneity Chi- squared values for eight segregating (SEG) families
Plant F2 IT Reaction of F3 families df 2(3:1) P value Reaction of F4 families df 2(9:7) P value
No. (Pt. 0000-2) SEG families (Pt. 0207-5,6,10) SEG families
IT “;” to “1–2” IT “3+” IT “;1” to “2–3” IT “3+” 1 3+ - NSS2 - - - 0 NSS - - -2 ;1–2n 14 5 1 0.02 0.9 – 0.5 81 5 1 0.25a 0.7 – 0.5 3 ;1cn 15 5 1 0.00 > 0.95 28 83 1 15.4b < 0.01* 4 ;1n 15 5 1 0.00 > 0.95 31 50 1 0.8b 0.5 – 0.3 5 3+ - NSS - - - 0 NSS - -6 ;1–2n 14 2 1 1.33 0.5 – 0.1 NSR 0 - -7 ;n+ 7 8 1 6.41 < 0.05* 40 37 1 0.68 0.5 – 0.3 8 ;1-n NSR1 0 - - - 26 5 1 5.36 0.05 – 0.01* 9 ;1-n NSR 0 - - - NSR 0 - -10 3+ - NSS - - - NSR 0 - -11 ;1-n 15 6 1 0.15 0.9 – 0.5 60 44 1 0.09 0.8 – 0.7 12 ;1-n 14 9 1 2.45 0.5 – 0.1 0 NSS - -13 ;1n 19 8 1 0.31 0.9 – 0.5 31 50 1 0.8b 0.5 – 0.3 14 ;n NSR 0 - - - NSR 0 - -15 3+ - NSS - - - NSR 0 - -16 3+ - NSS - - - NSR 0 - -17 ;1cn 15 5 1 0.00 > 0.95 44 36 1 0.05 0.9 – 0.8 Pooled 128 53 1 1.76 0.5 – 0.1 341 310 1 3.96 0.05 – 0.01* Heterogeneity 2 8 8.91 0.5 – 0.1 Heterogeneity 2 8 19.47 0.05 – 0.01*
Table 7 Segregation for response to Puccinia coronata f. sp. avenae pathotype 0000-2 among F2 individuals derived from the cross CIav9112/Glabrota
F2
Family Resistant Susceptible df 2
(3:1) P value 1 28 8 1 0.15 0.9 – 0.5 2 33 8 1 0.65 0.5 – 0.3 Sum χ2 - - 2 0.80 0.9 – 0.5 Pooled 61 16 1 0.73 0.5 – 0.3 Heterogeneity χ2 - - 1 0.07 0.9 – 0.5