Publisher’s version / Version de l'éditeur:
Vous avez des questions? Nous pouvons vous aider. Pour communiquer directement avec un auteur, consultez la première page de la revue dans laquelle son article a été publié afin de trouver ses coordonnées. Si vous n’arrivez Questions? Contact the NRC Publications Archive team at
[email protected]. If you wish to email the authors directly, please see the first page of the publication for their contact information.
https://publications-cnrc.canada.ca/fra/droits
L’accès à ce site Web et l’utilisation de son contenu sont assujettis aux conditions présentées dans le site LISEZ CES CONDITIONS ATTENTIVEMENT AVANT D’UTILISER CE SITE WEB.
Student Report; no. SR-2010-08, 2010-04-26
READ THESE TERMS AND CONDITIONS CAREFULLY BEFORE USING THIS WEBSITE.
https://nrc-publications.canada.ca/eng/copyright
NRC Publications Archive Record / Notice des Archives des publications du CNRC :
https://nrc-publications.canada.ca/eng/view/object/?id=935e3615-626b-493e-9524-072680067a22 https://publications-cnrc.canada.ca/fra/voir/objet/?id=935e3615-626b-493e-9524-072680067a22
NRC Publications Archive
Archives des publications du CNRC
For the publisher’s version, please access the DOI link below./ Pour consulter la version de l’éditeur, utilisez le lien DOI ci-dessous.
https://doi.org/10.4224/17506227
Access and use of this website and the material on it are subject to the Terms and Conditions set forth at
Structural Integrity of Lifeboats-Field Trials Analysis Hogan, Dayna
DOCUMENTATION PAGE REPORT NUMBER
SR-2010-08
NRC REPORT NUMBER DATE
April 2010
REPORT SECURITY CLASSIFICATION
Unclassified
DISTRIBUTION
Unlimited
TITLE
STRUCTURAL INTEGRITY OF LIFEBOATS Field Trials Analysis
AUTHOR (S)
Dayna Hogan
CORPORATE AUTHOR (S)/PERFORMING AGENCY (S)
Institute for Ocean Technology, National Research Council, St. John’s, NL
PUBLICATION
SPONSORING AGENCY(S)
IOT PROJECT NUMBER NRC FILE NUMBER
KEY WORDS
Full-scale lifeboat, field trials, TEMPSC, dynamometer, impacts, acrylic impact panel
PAGES iii, 12 FIGS. 10 TABLES 1 SUMMARY
This report looks at some of the data analysis for the project undertaken by IOT pertaining to a conventional lifeboat operating in ice. More specifically, it discusses the analysis of field trials that used to validate a mathematical model of the structural integrity of a lifeboat operating in ice. The field trials for this analysis took place in Triton, Newfoundland from in April 2009. The trials included collisions with both pack and level ice and when the lifeboat was being operated by a coxswain and remotely. The data from these trials was analysed in a program called Igor. Videos from several different cameras located on the lifeboat were also analysed. After the raw data was analysed, several graphs were plotted and the results were compared to predictions from the mathematical model.
ADDRESS National Research Council
Institute for Ocean Technology Arctic Avenue, P. O. Box 12093 St. John's, NL A1B 3T5
National Research Council Conseil national de recherches Canada Canada Institute for Ocean Institut des technologies
Technology océaniques
STRUCTURAL INTEGRITY OF LIFEBOATS
Field Trials Analysis
SR-2010-08
Dayna Hogan
TABLE OF CONTENTS
List of Tables... iii
List of Figures...iv 1.0 SUMMARY ... 1 2.0 INTRODUCTION ... 1 3.0 DISCUSSIONS... 1 3.1 Field Trials ... 1 3.2 Instrumentation ... 1 3.2.1 Dynamometer ... 1
3.2.2 Differential Global Positioning System ... 3
3.2.3 Cameras ... 3
3.2.4 Data Acquisition System ... 4
3.3 Data Analysis ... 4 3.3.1 Impact Force... 4 3.3.2 Impact Speed... 5 3.3.3 Video Analysis ... 6 3.3.4 Impact Position ... 6 3.3.5 Ice Type ... 6 3.3.6 Ice Mass ... 6 3.4 Results ... 7 3.4.1 Summary ... 7 3.4.2 Comparison ... 10 4.0 RECOMMENDATIONS ... 10 5.0 CONCLUSIONS ... 11 6.0 REFERENCES ... 12 LIST OF TABLES Table 1: Portion of Analysed Trial Data... 8
LIST OF FIGURES
Figure 1: Impact Panel ... 2
Figure 2: Dynamometer... 2
Figure 3: DGPS Receiver... 3
Figure 4: DaqBoard/3000USB Series... 4
Figure 5: Impact Force Graph ... 5
Figure 6: Speed Over Ground Graph ... 5
Figure 7: Front Impact, Broken Level Ice, Ice Dimensions of 2m x 2.5m ... 7
Figure 8: Ice Thickness of 13 cm ... 7
Figure 9: Field Trials Measurements - Impact Speed Vs. Impact Force... 9
STRUCTURAL INTEGRITY OF LIFEBOATS FIELD TRIALS ANALYSIS
1.0 SUMMARY
In this report the field trials analysis of both data and video, the results, and some recommendations for the future will be discussed.
2.0 INTRODUCTION
Over the course of my work term I worked on a project undertaken by Institute for Ocean Technology, Memorial University of Newfoundland and several other partners pertaining to the operation of a conventional lifeboat in an ice environment. More specifically, I completed research that looked at the structural integrity of a lifeboat hull in pack and level ice. My contribution to the research project involved analyzing data from field trials of April 2009. This research went towards validating a mathematical model representing the operation of a lifeboat in ice.
3.0 DISCUSSIONS
3.1 Field Trials
The field trials for this project took place from April 22 to April 25, 2009. They were conducted in bays containing both pack ice and level ice near Triton, Newfoundland. A full-scale lifeboat was used in the field trials, a totally-enclosed motor-propelled survival craft (TEMPSC). The boat was 5.28 m in length and had a breadth of 2.20 m. It had a total displacement of 3900 kg, 2400 kg empty and a ballast of 45 sand bags weighing 1500 kg.
3.2 Instrumentation 3.2.1 Dynamometer
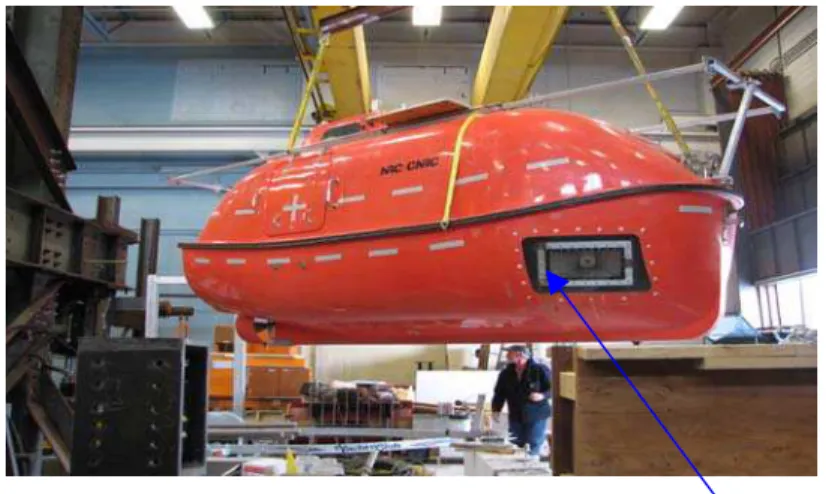
The dynamometer was what measured the force of impacts on the hull of the lifeboat and it was located behind an acrylic impact panel on the port side of the lifeboat (see Figure 1). It had a sample rate of 8000 Hz and an analog filter rate of 800 Hz. This meant that anything higher than 800 Hz was trimmed out helping to reduce noise in the data. The dynamometer consisted of six load cells (see Figure 2), three measuring forces in the y-direction, two measuring forces in the x-direction, and one measuring forces in the z-direction. The dynamometer load cells are aligned according to a right hand conventional coordinate system with the positive x along the length of the lifeboat, the positive y across the beam pointing towards port and the positive z vertically through the lifeboat pointing towards the canopy.
Figure 1: Impact Panel
Acrylic Impact Panel
Figure 2: Dynamometer
The three load cells measuring forces in the y-direction had a 5000 kg, or 5 tonne, capacity, while the remaining three load cells had a 1000 kg, or 1 tonne, capacity. For example, the maximum displacement of the 5 tonne load cells (i.e. when a force of 5 tonnes is applied) is 3/1000 of an inch. There is a bridge of resistors across the surface of the load cell that is flexed, or displaced, with a voltage of 5.000 V. When the resistors
flex or are displaced, this voltage varies. The output voltage is then amplified by 1000 and calibrated to find the force on the load cell.
3.2.2 Differential Global Positioning System
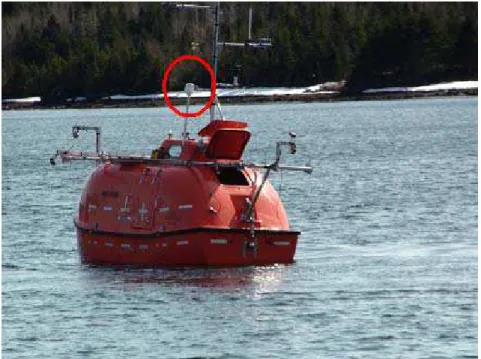
A differential global positioning system (DGPS) was used to obtain the position of the lifeboat and calculate the speed over the course of the trials. The DGPS differs from a regular GPS by using satellites and radio beacons to find its position as opposed to just satellites. It is also much more accurate than regular GPS systems, which are generally within a 30m radius of their given position. The DGPS used in the field trials had a differential position accuracy of less than 1m and a differential velocity accuracy of 0.1knt or 5.14cm/s. It obtained the position of the lifeboat at a rate of 10 Hz and recorded the latitude, longitude and time. These values were later used to calculate speed. The receiver for the DGPS was located on the outside of the lifeboat (see Figure 3).
Figure 3: DGPS Receiver
3.2.3 Cameras
The lifeboat was also equipped with eight video cameras, one looking down over the bow of the boat, one looking forward from the coxswain’s view, one looking down over the stern of the boat, one looking straight back, one looking over each of the shoulders and two internal views. The 6 cameras on the outside of the lifeboat were all waterproof. For the internal views the cameras were placed behind the acrylic impact panels located
on each side of the hull in waterproof housings. These video cameras were used to analyze the ice in each impact.
3.2.4 Data Acquisition System
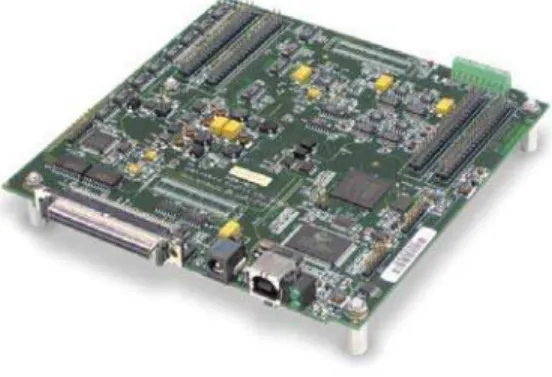
Several data acquisition systems were used to record information throughout the trials. Aside from force and speed, the trials also looked at things like temperature, CO levels, CO2 levels, wind, noise and acceleration so there were many channels used to keep track of all information. The high speed and the medium speed acquisition systems both used a 1 MHz DaqBoard/3000USB Series (see Figure 4) and the FRC and Raft acquisition systems used boards made by the electronics team themselves. All four boards had 16 channels used for recording data. The computer used on board the lifeboat to record the data was a Panasonic Toughbook CF 51, which has a hard drive that is suspended in a gel-like material to protect it from any vibrations, shocks or impacts. This suited its purpose very well, as the lifeboat endured many impacts, some as strong as 15000 N.
Figure 4: DaqBoard/3000USB Series
3.3 Data Analysis
The analysis of the data from these field trials involved using a program called Igor to create graphs from the data obtained in from both the dynamometer and the DGPS. Igor is a program that can be used for extensive programming, image processing, data analysis and scientific graphing.
3.3.1 Impact Force
The forces recorded by the dynamometer were later uploaded into Igor where graphs representing these forces over time were created (see Figure 5). Each load cell had a separate graph representing its forces required. Only the load cells in the y-direction were used in analysis of the force however. The graphs from all three of these load cells were zeroed and then summed to get the resultant force in the y-direction. Peaks on
these graphs represented impacts on the hull of the lifeboat. Generally, forces of over 1000 N were analysed and added to the results.
Figure 5: Impact Force Graph
3.3.2 Impact Speed
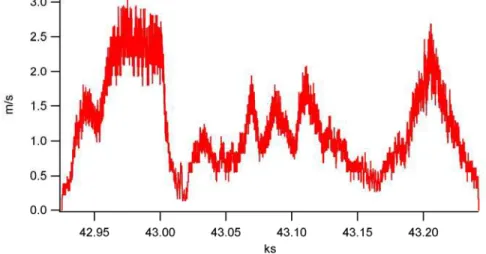
The speed of the lifeboat at the time of the collisions was also analysed through Igor. The latitude, longitude and time recorded by the DGPS allowed Igor to calculate the speed of the lifeboat over time. This time corresponded to the time of the resultant force graph and the speed at the time of each impact could be found from the Speed Over Ground graph (see Figure 6).
3.3.3 Video Analysis
Another part of this research included analysis of the video records taken during the trials. The videos were used to find several things about the impacts such as impact position, ice type, ice size, and ice thickness.
3.3.4 Impact Position
The camera that was used to find the impact position was, for the most part, the camera that looked down over the bow of the lifeboat (see Figure 7). Each impact was recorded as being a front impact, side impact, or both. This was important to the results because of the location of the dynamometer mentioned previously. Because the only dynamometer was located behind the port impact panel, side impacts could have higher impact forces than front impacts.
3.3.5 Ice Type
This part of the analysis used the same camera angle as impact position. The ice involved in each collision was classified as level ice, broken level ice, pack ice and equivalent to pack ice (see Figure 7). The last three, broken level, pack, and equivalent to pack, were all put into the category of pack ice. This was necessary because there were two mathematical models being developed, one for level ice and one for pack ice.
3.3.6 Ice Mass
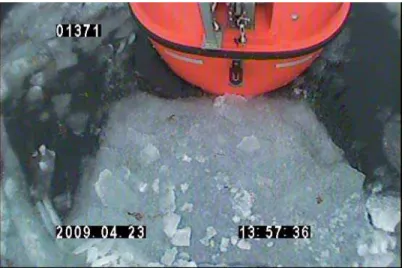
Both the ice dimensions and the ice thickness were approximated to help find the limits on the ice mass. The ice dimensions were estimated by using multiple camera views and looking at the size of the ice piece relative to the size of the lifeboat (see Figure 7). The thickness was also estimated to help find the approximate mass (see Figure 8). This was done using the internal views from the cameras located behind the impact panels. There was a 10 cm x 10 cm grid placed on the acrylic impact panel and the ice in the videos could then be measured against this grid. Most of the thicknesses ranged from 0.05m to 0.20m.
Figure 7: Front Impact, Broken Level Ice, Ice Dimensions of 2m x 2.5m
Figure 8: Ice Thickness of 13 cm
3.4 Results 3.4.1 Summary
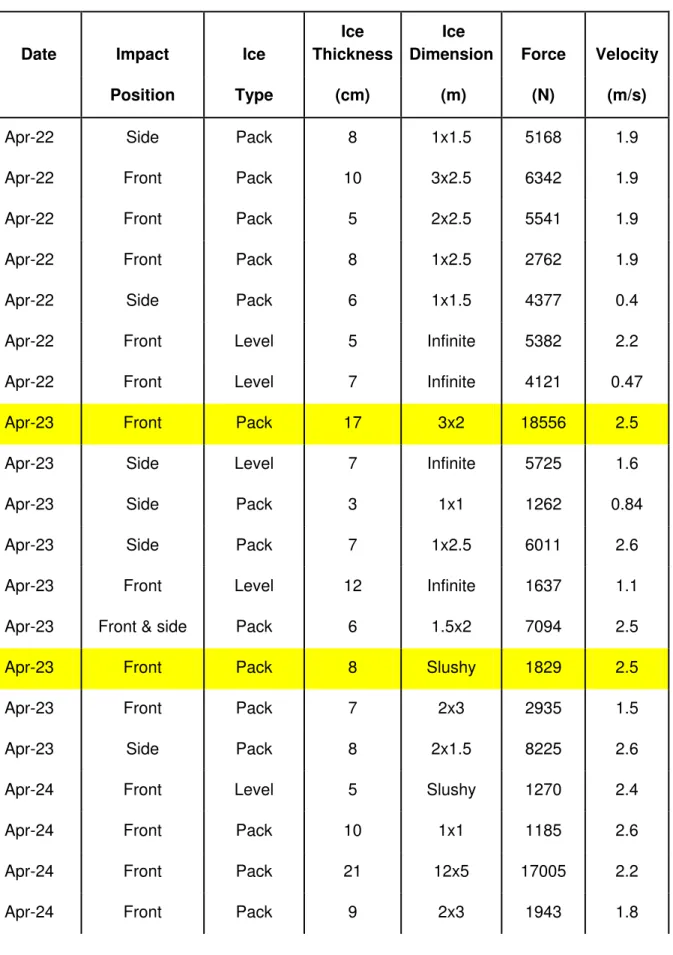
All the information from the analyzed data, including date, impact position, ice type, ice thickness, ice dimensions, force and velocity was kept in an Excel spreadsheet (see Table 1).
Table 1: Portion of Analysed Trial Data
Date Impact Ice
Ice Thickness
Ice
Dimension Force Velocity
Position Type (cm) (m) (N) (m/s)
Apr-22 Side Pack 8 1x1.5 5168 1.9
Apr-22 Front Pack 10 3x2.5 6342 1.9
Apr-22 Front Pack 5 2x2.5 5541 1.9
Apr-22 Front Pack 8 1x2.5 2762 1.9
Apr-22 Side Pack 6 1x1.5 4377 0.4
Apr-22 Front Level 5 Infinite 5382 2.2
Apr-22 Front Level 7 Infinite 4121 0.47
Apr-23 Front Pack 17 3x2 18556 2.5
Apr-23 Side Level 7 Infinite 5725 1.6
Apr-23 Side Pack 3 1x1 1262 0.84
Apr-23 Side Pack 7 1x2.5 6011 2.6
Apr-23 Front Level 12 Infinite 1637 1.1
Apr-23 Front & side Pack 6 1.5x2 7094 2.5
Apr-23 Front Pack 8 Slushy 1829 2.5
Apr-23 Front Pack 7 2x3 2935 1.5
Apr-23 Side Pack 8 2x1.5 8225 2.6
Apr-24 Front Level 5 Slushy 1270 2.4
Apr-24 Front Pack 10 1x1 1185 2.6
Apr-24 Front Pack 21 12x5 17005 2.2
Apr-24 Front Pack 9 2x4 2622 1.8
Apr-24 Side Pack 12 1x2 4840 1.6
Apr-24 Side Pack 9 10x15 3802 1.7
The results from this analysis were plotted as Impact Speed versus Impact Force (see Figure 9). This graph showed several things about the collisions. In general, the pack ice impact forces were higher that the level ice impact forces at the same speed. It also showed that the impact forces tended to get larger as the speed increased. One other point seen in the summary of the results was that a wide variety of impact forces could be seen at the same speed. Points 1 and 2 (also highlighted in Table 1) for example, both have an impact speed of 2.5m/s but point 1 has a force of about 19000 N while point 2 is only a 2000 N force. This was due to the fact that there were many other factors involved in the impacts than just speed. Some of these factors were ice strength, ice mass, and ice thickness.
Field Trials Measurements
0 2000 4000 6000 8000 10000 12000 14000 16000 18000 20000 0 0.5 1 1.5 2 2.5 3 Impact Speed (m/s) Im p a ct F o rc e (N ) Level Ice Pack Ice Point #1 Point #2
3.4.2 Comparison
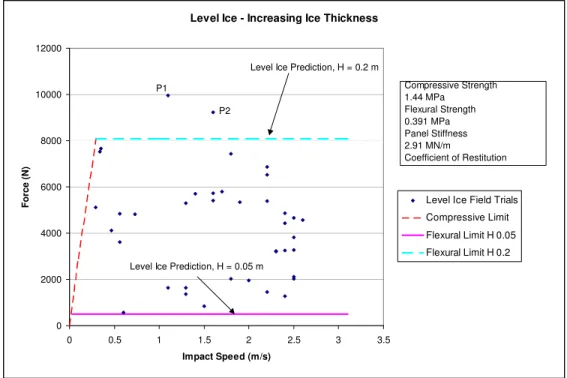
One of the comparisons made from the results was the comparison of the results of the level ice from the field trials to the predictions for level ice from the mathematical model, shown in the graph in Figure 10. The upper limit was found using the highest ice thickness and the lower limit using the lowest ice thickness in the model to get the corresponding forces. Most of the points from the field trials are encapsulated in these two limits but there are a few outliers. P1 and P2 in Figure 10, for example, lie above the upper limit. The prediction of the limits was based on one single ice strength, the average strength recorded from the field trials. P1 and P2 could both have much higher strengths than average.
Level Ice - Increasing Ice Thickness
0 2000 4000 6000 8000 10000 12000 0 0.5 1 1.5 2 2.5 3 3.5 Impact Speed (m/s) Force (N)
Level Ice Field Trials Compressive Limit Flexural Limit H 0.05 Flexural Limit H 0.2 Level Ice Prediction, H = 0.2 m
Level Ice Prediction, H = 0.05 m P1 P2 Compressive Strength 1.44 MPa Flexural Strength 0.391 MPa Panel Stiffness 2.91 MN/m Coefficient of Restitution
Figure 10: Level Ice - Increasing Ice Thickness
4.0 RECOMMENDATIONS
Throughout this analysis, one main issue was time synchronization. The times on the computers recording the data and on the cameras recording the video were not synchronized. Each of the eight video cameras had a different time stamp in the video and a different time on the file. These times were also different from the time on the corresponding data files. This made if difficult to find the impact from a data file in a video when looking for impact type, ice type and ice size. For trials occurring in the future a simple way to improve this issue would just be to make sure that all cameras were synchronized at the beginning of each day. A more in depth solution would be to
have a light, visible in each camera view, controlled by a sensor that turns the light on when it detects a force over a certain threshold value. Not only would this help to synchronize the cameras but it would also help to find a more exact time of impact in each video.
Another recommendation for these trials would be to have the dynamometer in the bow. As was previously mentioned, the dynamometer is currently located behind the port impact panel of the lifeboat. This means that front impacts are sometimes measured as less than side impacts. IOT has put forward a proposal for a ‘skirt’ around the bow that measures impact of head on collisions more accurately. The dynamometer in the bow would be made up of a 6-component balance, which measures the global load in the x-, y-, and z-directions and the moment about all three of these axes. This would help improve the field trials because front, head on impacts are easier to control than side or glancing impacts.
5.0 CONCLUSIONS
As the offshore oil and gas industry continues to expand, it is bound to move into more northerly and arctic climates. It is suggested by the US Geological Survey Circum-Arctic
Resource Appraisal that the area above the Arctic Circle contains about 22% of the
world’s undiscovered, technically recoverable resources. This includes approximately 90 billion barrels of oil, 1670 trillion cubic feet of natural gas, and 44 billion barrels of natural gas liquids. As the industry moves into these more remote and hazardous climates, safety is going to become an increasingly prominent issue. This is not just an issue for the actual oilrigs and platforms in these climates, but also for supply and support vessels. The means of evacuation on all of these must be able to operate in a wide variety of arctic conditions. Evacuating in ice environments is a main factor in the safety of northerly and Arctic exploration and production. The research pertaining to lifeboats operating in ice involved in this project is very relevant in today’s offshore industry. The research can be used to improve the safety of the operation of current lifeboats in today’s industry and, in the future, can go towards developing a new design for a lifeboat operating in an ice environment.
6.0 REFERENCES
1) Kennedy, A. (2010). Limitations of Lifeboats Operating in Ice Environments. A thesis submitted to the School of Graduate Studies at Memorial University of Newfoundland for the degree of Master of Engineering. (Draft)
2) McBarnet, A. (2010, Feb. 10) Circling Around Arctic Prospects. Offshore Engineer,
February 2010 Issue. Retrieved from: http://www.oilonline.com/Magazines/OffshoreEngineer/articleType/ArticleView/article
Id/28111/Circling-around-Arctic-prospects.aspx
3) Simoes Re, A., Kuczora, A., & Veitch, B. (2007). Field Trials of an Instrumented Lifeboat in Ice Conditions.
4) Trimble Navigation Limited. (1998). DSM 12/212 Product Family: Integrated, cost-effective, and reliable submeter positioning for your marine application. Retrieved April 2010 from Trimble Navigation Limited website: http://www.trimble.com/products/pdf/dsm12.pdf