IdEP Economic Papers
2018 / 01
G. Masiero, F. Mazzonna, O. Verbeek
What drives the rise of antidepressant consumption?
Evidence from Switzerland
What drives the rise of antidepressant consumption? Evidence
from Switzerland
Giuliano Masiero* Fabrizio Mazzonna† Olaf Verbeek‡ 4 June 2018 Draft version AbstractAntidepressant (AD) consumption has been steadily increasing in the last decade in most coun-tries. The explanations suggested by researchers for this increment are still under scrutiny. This study attempts to identify the determinants of AD consumption by exploiting small area variations from Switzerland between 2003 and 2014. We observe that two specific drugs - Citalopram and Escitalo-pram - within the Selective Serotonin Re-uptake Inhibitors (SSRI) category are mainly responsible for the increasing trend in AD consumption. Socio-economic, demographic, cultural, and geographical characteristics of the area are included in multiple regression models with random and fixed effects of AD consumption per capita. While most of these factors contribute to explain cross-area variations in AD use, they provide little explanation for the temporal trend in overall AD consumption. Con-versely, we find that the time trend in AD consumption is explained at least partially by the density of prescribing physicians. More precisely, generic AD turn out to be positively associated with adverse local economic conditions, while branded AD are negatively associated with adverse economic con-ditions and positively related to the presence of neurologists and psychiatrists in the area. This may suggest that generic AD drugs are more likely prescribed in accordance to need, whereas branded AD are more likely to respond to preferences and financial incentives affecting suppliers.
Keywords: Antidepressant Consumption, Healthcare Demand, Socio-economic Determinants JEL codes: C13, I11, I18
*Department of Management, Information and Production Engineering (DIGIP), University of Bergamo, Italy, and Institute
of Economics (IdEP), Università della Svizzera Italiana (USI), Switzerland.
†Corresponding author: Institute of Economics (IdEP), Università della Svizzera Italiana (USI), via Buffi 13, 6904 Lugano,
Switzerland (fabrizio.mazzonna@usi.ch), and Munich Center for the Economics of Aging (MEA).
1 Introduction
Antidepressant (AD) consumption increased steeply over the past decade in all OECD countries, dou-bling between 2000 and 2013 (McCarthy,2013). The growth is mainly due to an increasing use of Se-lective Serotonin Re-uptake Inhibitors (SSRI), i.e. the most recent category of AD drugs (Mojtabai and Olfson,2014;Poluzzi et al.,2013;Guaiana et al.,2005;Barbui et al.,1999).
Several factors contributed to the increasing use of AD, but evidence is far from being conclusive (Moore et al.,2009). Firstly, the increase in consumption might be partially explained by the growing incidence of depression (Meijer et al.,2004). The World Health Organization (WHO) ranks depression as the prime contributor to global disability and the major contributor to suicide deaths (estimated up to 800.000 annually) (WHO,2017;Whiteford et al.,2013). According to the WHO, the prevalence of depres-sion is highest among older adults (55-74 years) and the total number of people living with depresdepres-sion increased by almost 20% between 2005 and 2015. Secondly, an explanation may be found in the recent economic crisis, that has posed a severe shock to many developed economies threatening living stan-dards and boosting unemployment and suicide rates (e.g.Barr et al.,2012;McInerney et al.,2013). Other factors, such as lower prescription thresholds, off-label use (e.g. sleeping- and eating disorders, and chronic conditions), and growing public acceptance of mental health treatments, may also have con-tributed to the steep increment of AD consumption (Mojtabai,2007). Lastly, recent US studies underline the role played by the expansion of insurance coverage for prescription drugs and promotional activi-ties by the pharmaceutical industry in stimulating AD consumption (Frank et al.,2005;Domino,2012; Shapiro,2018;Avery et al.,2012).
The importance of unravelling the determinants of AD consumption lies primarily in the cost of depression and its treatment for society.Stewart et al.(2003) estimate the cost of depression to employers in the US to be about USD 31 billion, with total costs adding up to as much as USD 44 billion in 1990 and USD 81 billion in 2000 (Greenberg et al.,1993,2003). Similarly,Sobocki et al.(2006) estimate the cost of depression in Europe to be EUR 118 billion in 2004.
Some authors argue that these estimates severely underestimate the true costs of depression since many individuals go untreated or undiagnosed, and because it is difficult to estimate the costs of e.g. depression-related absenteeism, presenteeism, and reduced lifetime earnings (Hirschfeld et al.,1997). However, the persistence of high morbidity despite the increasing use of antidepressants suggests either that AD treatment is ineffective or that a large share of depressed people goes untreated. To this end, recent medical literature has questioned the efficacy of treating depression (only) with AD. Effective de-pression treatments may reduce mortality by decreasing the risk of suicide and other dede-pression-related causes of death, such as accidents, heart diseases or strokes. Some researchers argue that the basis of
treating depression with AD, the so-called chemical imbalance theory, is incorrect and treatment there-fore inefficacious (Kirsch et al.,2002;Healy,2004). Others argue that psychotherapy is at least as good as pharmacotherapy and should perhaps be preferred since it comes with less side-effects and more sta-ble long-term effects; or they argue that at least the combination therapy should be favoured (Cuijpers et al.,2014a;Steinert et al.,2014;Cuijpers et al.,2014b;Kamenov et al.,2017). The most recent studies comparing AD and placebo in the acute treatment of major depressive disorder in children and ado-lescents fail to provide clear evidence on the advantages of AD as compared to placebo (Cipriani et al., 2016;Kirsch et al.,2008;Jakobsen et al.,2017;Fournier et al.,2010). Conversely, the review of economic evaluations of depression treatment shows favourable evidence in terms of cost-effectiveness for newer AD as compared to tricyclic AD (Barrett et al.,2005). However, given the pharmacological heterogeneity of the compared medicines, it is difficult to obtain a clear answer regarding the efficacy question (Hale, 2003).
This article seeks to contribute to the literature on the determinants of time- and spatial patterns in AD consumption. In particular, we exploit detailed information on product level wholesales of AD (active ingredients and brand names) for a panel of 106 very small regions covering the whole Swiss territory for 12 years, between 2003 and 2014. This allows us to exploit how time and geographical variation in AD consumption is related to changes in socio-economic conditions, cultural- and supply side factors such as the density of prescribing doctors. Moreover, our data allows us to exploit differences across molecules and types of product (generic vs. branded).
We believe that Switzerland provides an ideal setting to investigate the determinants of the stark in-crease in AD consumption. Switzerland is a federation with remarkable heterogeneity in terms of institu-tional, cultural and economic characteristics, and health care organization, which leads to considerable variation in the utilization of drugs across regions. AD consumption is close to the OECD average and has increased substantially in the last 15 years. Depression is the most common mental disorder, with an estimated cost of 9 billion CHF annually (Baer et al.,2013;Tomonaga et al.,2013). Furthermore, con-sumers virtually face no costs of healthcare, given complete obligatory insurance coverage, a relatively low mandatory deductible, and small (10%) co-payments. On the supply side, prescribing physicians are paid under a fee-for-service scheme and have practically no relevant restrictions on prescription prac-tices. Lastly, Switzerland is home to the headquarters of several large pharmaceutical companies. This implies that the country is at the forefront of developments in the drug industry but also potentially more exposed to industry marketing pressure.
We find evidence of large small area variation in AD consumption that is related to socio-demographic and geographical factors. However, none of these factors explains the sharp increase in AD consump-tion in the last decade. Furthermore, we do not find evidence of a correlaconsump-tion with the recent economic
crisis. Instead of increasing AD consumption with unemployment, as one might expect, we find a pos-itive relationship with income. Furthermore, the increasing time trend in consumption is apparently explained, at least partially, by the local health care supply. In particular, areas with higher physician density show higher AD consumption, especially for neurologists and psychiatrists, and to some extent general practitioners (GPs).
Some interesting differences arise also in our analysis at product level. More precisely, while con-sumption of generic AD shows a positive association with unemployment and prescribing GPs, branded AD consumption is positively associated with income and prescribing neurologists and psychiatrists. These findings are confirmed by the analysis at detailed product level on the two main active ingredients sold in Switzerland: Citalopram and Escitalopram. We find that generic Citalopram is positively associ-ated with GP density and unemployment rates, whereas branded Escitalopram is positively relassoci-ated with density of neurologists and psychiatrists.
Having excluded many alternative explanations for our results, a plausible explanation is that a high concentration of physicians in an area facilitates the marketing effort of pharmaceutical companies. AD producers concentrate their marketing efforts in these areas to exploit the network effects. Therefore, physicians in these areas are more likely to be visited by pharmaceutical sales representatives and po-tentially increase their prescription rate.
The remainder of the paper is structured as follows. The next section explains the institutional back-ground and provides some insights about the distribution of antidepressant drugs in Switzerland. Sec-tion3presents the data, while Section4describes the main determinants of AD consumption and set the empirical model. The results are discussed in Section5. Finally, Section6concludes.
2 The institutional setting
Switzerland is a confederation consisting of 26 cantons (states), each with considerable administrative competences, and an overall population of about 8 million people. Although public health is largely a responsibility of the individual cantons, certain aspects of health care are regulated at the federal level. For example, the health care system is chiefly funded through mandatory private health insurance. The community-rated insurance premium, decided by the insurer, has to be approved by the Federal Office of Public Health (FOPH). Competing insurers provide a homogeneous insurance package and individu-als can change insurance provider in November each year. Although the deductible can be voluntarily increased up to CHF 2,500, the minimum deductible of CHF 300 is relatively low. Any surplus that the in-surer may earn has to be paid back to their insured population. Moreover, risk-adjustment is ascertained through contributions to a risk fund by those insurers with a lower than average disease risk among their insured population. Supplementary insurance can complement the basic insurance to provide further
coverage, for instance for drugs not covered by the basic insurance package.
Market admission of medicines is assessed by Swissmedic, the Swiss federal agency for therapeutic products. After gaining access to the market, a medicine can be included in the so-called "Spezialitäten Liste" or Positive Drug List (SL) as drafted by the FOPH. Medicines that are on this list get reimbursed by the insurer.1 Virtually all active ingredients included in our analysis are on this list. This implies that patients consuming AD, after they have used their deductible, only face a 10% co-payment for their prescription, until the annual cap of 700 CHF is reached, after which the co-payment rate drops to zero.2 Antidepressant drugs in the ambulatory setting can be prescribed by GPs and specialists. Although in practice any physician in Switzerland could prescribe AD, we identify neurologists, psychiatrists, and GPs as the ones most likely to do so. Upon prescription, AD are distributed through community pharma-cies and dispensing physicians. Cantons decide on the settlement of pharmapharma-cies and on the possibility for physicians to dispense drugs directly to patients. Physicians are typically self-employed and insur-ance companies are obliged to contract with any licensed medical practitioner, with limited exceptions if patients subscribe to a HMO-type insurance plan. Physicians get remunerated based on a fee-for-service scheme according to rates established by insurers and service providers, and controlled by the FOPH. If fees are no longer considered to be appropriate ("sachgerecht"), the Federal Office can intervene and impose a change. Therefore, physicians have little control over the price of their services, and mainly influence their revenues through the supplied quantity of services.
The price of pharmaceutical drugs may differ depending on whether medicines are prescribed by dispensing physicians or pharmacists, and is based on the ex-factory price as set by the FOPH. The retail price is composed by the ex-factory price and a mark-up for the reimbursement of logistic and capital costs associated with drug distribution.
3 Data
Data for the analysis were obtained from IMS Health Switzerland and include annual wholesales of an-tidepressants at detailed geographical level (brick) for each product in the N06A class between 2003 and 2014.3 The brick is a geographical unit representing a pharmaceutical sales area. Typically, a brick ag-gregates small rural municipalities, while bigger urban municipalities are split into more than one brick.
1The only exception to this is the canton of Appenzell Ausserhoden that has its own Positive Drug List. In practice, this list
contains only herbal medication. However, one can obtain medication in the surrounding cantons of Appenzell-Innerrhoden and St. Gallen.
2Only if the prescription concerns a branded medicine for which a less expensive interchangeable generic is available the
co-payment rate is 20%, with a specific stop-loss amount of 933 CHF, after which the rate is again 0. The latter rule was introduced in 2006.
3The Anatomic Therapeutic Chemical (ATC) classes are defined by the World Health Organization (WHO) and the European
Pharmaceutical Market Research Association (EUphMRA) according to the chemical mechanism behind the main active ingre-dient of each substance. The N06A class is part of the anatomical group N, Nervous System, and comprises all antidepressants.
There are 227 bricks, each of them comprising at least 5 pharmacies and an average population of about 35,000 inhabitants. To exploit important socio-economic information provided at higher geographical level, we aggregate the brick level data to the Spatial Mobility Region (SMR) level. The SMR is a statistical subdivision of Switzerland based on economic activity around an agglomeration hub, that divides the country in 106 local labor markets.
AD consumption is measured in Defined Daily Doses (DDD) per 1,000 inhabitants per day (DID).4 This measure allows us to compare consumption data across different molecules, packages, and regions. Our DID measure is calculated using WHO standard doses for each pharmaceutical product and addi-tional demographic data from the Swiss Federal Statistical Office (FSO).5Herbal AD (class N06A2) are excluded from the analysis since standard doses for therapeutic purposes are not defined (seeTable 1for the list of molecules included in the analysis).
We obtained data on unemployment, mortality, and morbidity (measured by hospital admissions) from the Swiss Federal Statistical Office (FSO) for the years 2003–2014. Also, income data, based on tax reports, were delivered by the Federal Tax Administration and range from 2003 to 2013. Data on the number of physicians for different specializations were provided by the Swiss Medical Association (FMH) for the years 2003–2014. Unfortunately, not all these data are at the same geographical level. Unemployment and income data are defined at the municipality level, whereas mortality and morbidity data are aggregated at the MedStat region level. The latter spatial concept (MedStat region) does not directly match the SMR level. In order to aggregate all the information at the SMR level and thus allow for panel data analysis, we use a matching procedure based on population weights.6
To account for the skewness of the Swiss income distribution, we consider a log-transformation of income data. Furthermore, the detailed population data allow us to obtain the unemployed population as a share of the working age population as well as the mortality and morbidity (hospitalization) rates per 10,000 inhabitants per region. In particular, we consider the most relevant causes of hospital admissions related to AD consumption, i.e. F32 and F33.7The former category refers to depressive episodes, whereas the latter refers to recurrent depressive disorder.
4According to the definition of the WHO, a defined daily dose is the assumed average maintenance dose per day for a drug
used for its main indication in adults.
5We first calculate the number of daily doses contained in the packages (p) of each product or active ingredient (a). Then,
we multiply this number by the number of units sold (Qpai t) of each package and product, for each area (i ) and year (t ), to find
the number of total doses. Finally, we aggregate the total doses at product level and divide by 365 days and by the number of inhabitants times 1,000 as follows: D I Dai t=Pp
DDDpa×Qp ai t
popi t ×
1,000 365 .
6We consider census data available for the years 1990, 2000, and 2010 with a resolution of 100 meter per 100 meter (grid),
and interpolate the population data from 2000 to 2014. Then, a number of grid cells is uniquely assigned to each spatial con-cept (municipality, SMR, or MedStat), which allows us to compute spatial population weights and reassign information among spatial concepts.
3.1 Descriptive statistics
To provide some general descriptive information on overall AD consumption in Switzerland in com-parison to the international context, we combine our data with data previously published by theOECD (2015).Figure 1shows AD consumption measured in DID in Switzerland and other OECD countries. The average Swiss consumption increased markedly from 40 DID at the beginning of our period (2003) to 60 DID at the end of the period (2013). Although the consumption is still above the OECD average, there is an apparent convergence toward the mean.
InFigure 2we illustrate the geographical variability of AD consumption in Switzerland and the change over time, between 2003 (top map) and 2014 (bottom map). Darker colors on the map represent higher consumption. Consumption is generally more concentrated in Latin-language areas (French, Italian and Romansch) and around urbanised areas. While consumption around cities remains high over time, it shifted to northern and eastern German-speaking regions. The linguistic or cultural discrepancy be-comes even more apparent inFigure A.1. Both Latin- and German-language areas see an increase in AD consumption over time, but the magnitude of this change is bigger for German-speaking areas.
In order to get a deeper insight, we shortly explore antidepressant consumption by ATC classes. SSRI and SNRI are the main contributors to the increase in AD consumption over time (seeFigure 3). More-over, the former class stands out accounting for more than 50% of total AD consumption. More precisely, two active ingredients within the SSRI class are predominant: Citalopram and Escitalopram (Figure A.2). The latter ingredient appears to be the main responsible for the increase in SSRI over time. Both Citalo-pram and EscitaloCitalo-pram were originally marketed in Switzerland by Lundbeck under the brand names Seropram and Cipralex respectively. Citalopram is now mainly sold as a generic drug, whereas Escitalo-pram includes generics only from 2014, just after the expiration of the patent. EscitaloEscitalo-pram, a reformu-lation of Citalopram, was introduced in 2003, just before the expiration of Lundbeck’s patent on Citalo-pram. Looking more in detail at these two active ingredients we see that branded Citalopram has been gradually replaced by generic Citalopram (Figure 4). However, Escitalopram consumption has increased steeply. This may suggest that Lundbeck has successfully replaced the old branded drug (Citalopram) with the new active ingredient (Escitalopram), which has contributed substantially to the increase in overall AD consumption over the examined period.
Table 2shows summary statistics for the variables that we include in our analysis. It is worth not-ing that the Swiss unemployment rate is on average well below 3% over the period of interest. Most of the variation in unemployment as well as in income is between regions. As in almost all developed economies, unemployment shows a steady decline before 2008 and an increase in 2009-2010 because of the financial- and economic crisis that hit most of Europe and the Western world around that time ( Fig-ure A.3). However, even in the worst years the average unemployment rate only reached 4% with some
variation across areas, especially across different language regions.
Furthermore, there is on average a little more than 2 neurologists and psychiatrists per 10,000 inhab-itants, and a little less than 7 GPs.Table 2shows the change of AD prescribing physicians in Switzerland as a share of the general population. We see that neurologists and psychiatrists increase at a faster rate than the population, whereas the number of GPs as a share of the population is more or less constant. Even though, in principle, any physician in Switzerland could prescribe antidepressant drugs, neurolo-gists and psychiatrists are the most likely to use them in their practice.
Figure 5provides some evidence on the health status of the Swiss population with a focus on men-tal health. The mormen-tality rate is declining over time since the growth in the number of deaths is out-paced by an increase in the population (top-right graph). Also, the rate of suicides is on average decreas-ing, which may suggest that mental health is overall improving (top-left graph). However, we observe a stark reduction in the number of psychiatric beds (bottom-right graph), which can be attributed to de-institutionalisation of mental health care and to an increase in outpatient treatment through pharma-cological therapy. The German-speaking areas are the most affected by this change. This phenomenon could partially explain the remarkable increase in the rate of hospital admissions for depression (bottom-left graph), a possible adverse consequence of the reduction in psychiatric beds. Note, in particular, that only the most severe cases of depression get hospitalised. Hence, a sort of substitution effect between cases in psychiatric hospitals and cases in standard hospital wards can be hypothesized. Nevertheless, the general mental health status of the population has not deteriorated. Indeed, we observe a decline in the prevalence of depression (bottom-left graph).
4 Empirical strategy
We propose a consumption function of AD, where variation is related to socio-economic, demographic and cultural aspects, as well as the characteristics of local health care supply, and living conditions of the population in the geographical area (SMR). More precisely, we specify the following ad hoc econometric model of AD wholesales per capita in Spatial Mobility Region i at time t :
ADi t= β1Ei t+ β2Di t+ β3Ci+ β4Si t+ β5Gi+ δt+ γc+ αi+ ²i t, (1)
where Ei t are time-varying controls for local economic conditions (unemployment rate and the
nat-ural log of net median income), Di tare time-varying socio-demographic characteristics of the local area
(age structure, gender distribution, share of foreigners, population density), Ciare cultural aspects
(ap-proximated by the language spoken), Si t represents characteristics of local health care supply
altitude),δt is a time fixed effect,γc a canton fixed effect, and²i t an error term. Canton fixed effects
are included to take differences in mental health policy into account, which are set at cantonal level. Moreover, we control for population density and altitude to proxy for the level of access to health care services.8
Given the panel nature of our data, we estimate the parameters of interest using both fixed (FE) and random effects (RE) models. Unlike the RE model, the FE model treatsαi as a fixed effect that captures
all time-invariant characteristics. This should reduce the probability of omitted variable bias since the RE assumption that the regressors are uncorrelated with the unobservable characteristics in bothαiand ²i t might be too restrictive. However, the relatively high level of aggregation of some variables and their
measurement procedure may increase the chances of measurement error, particularly for physicians, hospital admissions, and mortality. Therefore, measurement error and lack of within variation in some of the explanatory variables might introduce downward bias in the estimates because of a low signal to noise ratio (Griliches and Hausman,1986). Moreover, our model always includes canton and year FE which capture much of the spatial variation in our data. Hence, it does not surprise that the Hausman test (Hausman,1978) often does not reject the null hypothesis that the preferred model is RE vs. the alternative FE model.
As a robustness check, we include health outcomes and stationary physicians (excluding neurolo-gists and psychiatrists) in the model. Stationary physicians are not expected to prescribe AD, since they lack specialisation for such prescriptions. We are fully aware that including health outcomes and ad-ditional physicians as explanatory variables leads to a higher degree of endogeneity (“bad controls” ac-cording toAngrist and Pischke,2008). However, these controls are only meant to verify whether the coef-ficients on specialists and GPs are also a proxy for the health status of the population in an area. Similarly, stationary specialists are added to the equation to verify whether the association between physicians and AD consumption in some areas is driven by hospital concentration rather than increased prescriptions.
5 Results
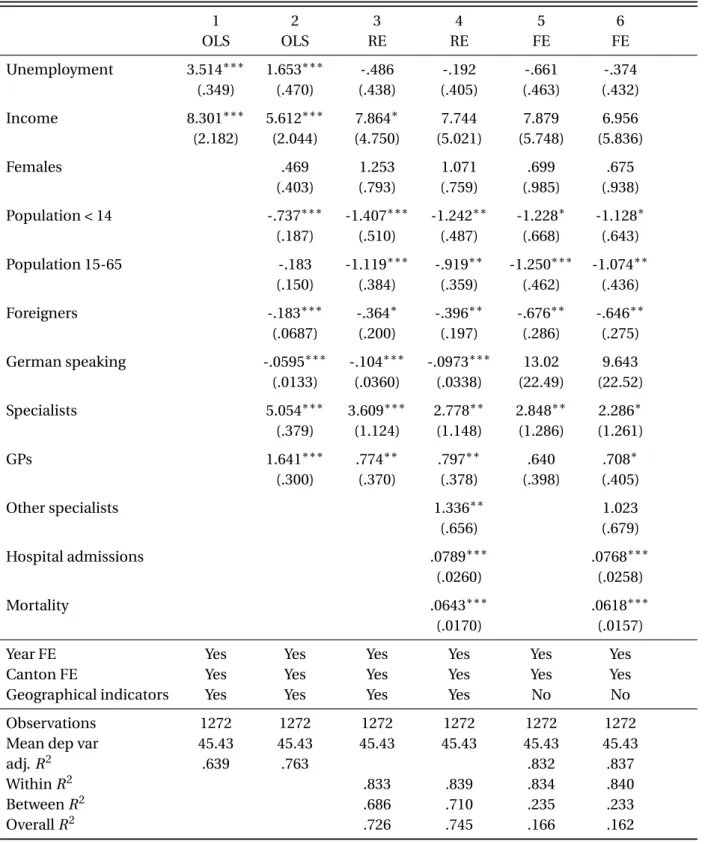
Our empirical investigation starts fromTable 3which shows the results of regressing the full sample of AD consumption on socio-economic, demographic, and health supply variables, as stated in Equation (1). For descriptive purposes, column 1 shows the results from an OLS regression of AD consumption on our economic variables (unemployment and income) and baseline controls (year and canton fixed effects and geographic controls). It appears that unemployment and income are both positively correlated with AD consumption. However, as we account for the other explanatory variables (column 2) much of this
8Some cantons allow direct dispensing of drugs by physicians in remote areas. Hence, geographical indicators should at
correlation disappears.
From column 3 onwards, taking the panel structure of our data into account, we show the results from RE and FE models. As already mentioned, RE and FE estimates are very similar. Therefore, so we avoid commenting differences that are small and not statically significant. Whereas OLS suggest a posi-tive association between unemployment rates and AD consumption, the RE and FE estimates show the opposite. The coefficient of unemployment is negative, although not statistically different from zero. Conversely, the coefficient of income indicates an increase of almost 0.07 DID for a one percent increase in income. All in all, our estimates do not show any relationship between adverse local economic condi-tions and AD consumpcondi-tions. If anything, it seems that AD consumption increases with income.
Regarding the socio-demographic variables, we observe a strong negative effect for both age cate-gories - below 15, and from 15 to 65 - as compared to the category 65 and over. Such a result does not match with the available information on depression incidence by age reported by the Swiss Health Ob-servatory based on the Swiss Health Survey (Schuler et al.,2016). Indeed, this shows opposite evidence, namely a lower incidence of depression among the elderly. AD consumption is also negatively related with the share of foreigners and the share of German speakers in a region.
Particularly interesting is the positive relationship between the density of prescribing doctors in a region (GPs and neurologists and psychiatrists) and AD consumption. In all models, the coefficient for neurologists and psychiatrists density is large and statistically significant at conventional levels. In par-ticular, an increase by one standard deviation in the number of neurologists is associated with an in-crease of about 3 DID in AD consumption (RE and FE models). The association for prescribing GPs is weaker but still positive with a coefficient of about 0.8. These results appear to be robust since the esti-mated coefficients do not alter qualitatively upon addition of health outcomes or other (non-prescribing) specialists (columns 4 and 6).
All estimates reported so far include year fixed effects, which capture a large share of the variation in AD consumption in the period of interest. However, given the sizeable increase in AD consumption over the years, it is particularly relevant to understand which of the variables included in Equation (1) can explain such an increase. For this reason, inTable 4we summarize the results from a series of RE estimates where we only report the coefficient of a linear time trend. In the first column, AD consump-tion is regressed only on time and canton fixed effects showing that consumpconsump-tion of AD in Switzerland grows steadily by 1.8 DID per year. In the following columns we sequentially add our set of controls, namely economic, socio-demographic, geographic and supply side variables (as previously specified). Except for the supply side variables, the table clearly shows that none of the regressors is able to explain the large increase in AD consumption over time. Indeed, only the inclusion of physicians in the regres-sion (column 5) significantly alters the time trend coefficient (-18%). The fixed effects estimates show a
similar pattern (not reported).
So far, we have considered the total AD consumption without distinguishing across products or molecules. For this reason, inFigure 6we separately investigate the determinants of AD consumption by type. Contrary to the total AD consumption estimates reported inTable 3, we find that an increase in the unemployment rate is associated with increasing consumption of generic AD. Moreover, the estimated coefficient of income indicates a negative association with consumption. The estimates for branded AD show the opposite: branded AD strongly increase with income and decrease when local economic conditions worsen (i.e., higher unemployment). These results suggest that generic AD respond to ad-verse economic conditions while the consumption of branded products is pro-cyclical and increases with people’s wealth. As shown before, the increasing density of neurologists and psychiatrists is associ-ated to increasing AD consumption, both for generics and branded AD. Regarding GPs, this relationship is observed only for generics.
Finally, inFigure 7we separately analyse the consumption of generic Citalopram and branded Esc-italopram, the most consumed active ingredients in Switzerland in the period under investigation (see Figure 4). The consumption of generic Citalopram is positively associated with unemployment and neg-atively associated with income, like the consumption of generics in general. Again, higher GP density goes hand in hand with a higher consumption of generic Citalopram, while neurologists and psychia-trists are not associated with the consumption of this molecule. Conversely, branded Escitalopram is strongly associated with the density of neurologists and psychiatrists in an area but does not show any significant association with local economic conditions.
6 Discussion
The results of our analysis indicate that changes over time in socio-demographic and economic condi-tions do not explain the increase in AD consumption, at least for AD in general. For generic AD, however, the results suggest that consumption is indeed related to higher need, since adverse local economic con-ditions go hand in hand with higher consumption. Conversely, the evidence on branded AD mirrors the findings on AD in general, which are negatively associated with unemployment and positively associated with income. This might suggest that generic AD are consumed on a need-basis, while branded AD are prescribed as so-called "happy pills". The analysis on the most relevant AD product (Citalopram) - that has gradually changed from mainly branded to predominantly generic - corroborates the finding that generics are correlated with adverse local economic conditions.
We find some evidence that local health care supply is correlated with increasing AD prescriptions in general, with heterogeneous effects according to drug categories. More precisely, the consumption of branded AD is strongly and positively associated with the density of neurologists and psychiatrists.
This evidence is confirmed when we focus on the consumption of a single product - the chiefly branded Escitalopram, introduced on the Swiss market just before 2003. Conversely, generics in general and spe-cific generic products (Citalopram) are associated with the density of prescribing GPs. This result can be attributed to several factors. Plausibly, we can exclude unobservable factors since we control for a large set of determinants, such as socio-economic characteristics of the regions, demographic and cultural aspects, local health care supply and geographical factors, as well as canton- and time fixed effects. Our results could be driven by competition in local health care supply. Since physicians are competing for pa-tients, they would be more inclined to prescribe medications in order to lock patients into their practice. Given the nature of the Swiss health care system this is not an unlikely scenario. Lastly, the concentra-tion of physicians in an area may accommodate marketing efforts by pharmaceutical companies. Highly concentrated areas may be more exposed to visits from sales representatives, gently inducing physicians to prescribe more AD.
The main limitation of our analysis is the level of aggregation of our data. In order to identify the causal effects one should preferably use individual data, but unfortunately such data are not available yet. The main advantage of using our geographical level of analysis (SMR) is that economic activity can be captured in a sensible way. This allows us, for example, to control for "cross-border-shopping" assum-ing that people do not go and obtain medication in another SMR. This is a very reasonable assumption because all AD get reimbursed by the compulsory basic health insurance. Therefore, it is plausible to assume that data aggregation at SMR level will capture all the consumption within the region with neg-ligible consumption externalities from other regions.9
In conclusion, we observe that AD consumption in Switzerland is strongly associated with local health care supply, suggesting that demand is at least partially induced by the supply. This could be due to the incentive structure of the Swiss Health Care system or ease of marketing effort towards physi-cians, but both claims would require more detailed analysis of the data. A closer investigation of the structure of incentives, in particular mark-ups and profit margins for both pharmaceutical companies and physicians, would contribute to refine our evidence.
9We realise that this assumption is satisfied in some cases - e.g. in Ticino where the geographical barrier of the St. Gotthard
excludes this kind of behaviour - while in other cases it may be too crude. This brings us to the potential acquisition of data on AD consumption across country borders. Note, however, that virtually all AD are included in the so-called "Spezialitätenliste" or positive drug list from the Federal Office of Public Health (FOPH). Hence, all AD get reimbursed by the compulsory basic health insurance. Unless someone opts for a very high deductible and hence incurs the costs for treatment out of pocket, it is unlikely that people cross SMR borders to purchase cheaper medication. Moreover, opting for the highest deductible is quite unlikely for people suffering from depression. Therefore, it is plausible to assume that data aggregation at SMR level will capture all the consumption within the region with negligible consumption externalities from other regions.
Figure 1: Antidepressant consumption in OECD countries and Switzerland in 2000 and 2013 (or nearest year available).
Notes - Adapted from:OECD(2015) (http://dx.doi.org/10.1787/888933281342). This graph shows the consumption of antidepressants in 28 OECD countries and Switzerland (the latter is not included in the OECD-28 average). Consumption is expressed in defined daily doses per 1,000 people per day (DID). A defined daily dose is a standard daily maintenance dose for an adult defined by the World Health Organisation (WHO). The OECD-28 average is 58 DID in 2013, and consumption varies between 13 DID in Chile and 118 DID in Iceland. Antidepressant consumption in Switzerland is 60 DID in 2014, just above the OECD-28 average.
Figure 2: Antidepressant consumption across Swiss areas (spatial mobility regions - SMR) in 2003 and 2014.
Notes - The maps are detailed at spatial mobility region level. Darker areas indicate higher antidepressant consumption per
1,000 inhabitants per day. Highly urbanized areas and French- and Italian speaking regions (West and South respectively) show higher levels of AD consumption in 2003 (upper map). Compared to 2003, urbanized areas and German-speaking regions (North and East) show the highest increase in AD consumption in 2014 (lower map).
Figure 3: Antidepressant consumption in Switzerland between 2003 and 2014 - Total and by ATC classes.
Notes - This graph illustrates average antidepressant consumption in Defined Daily Doses (DDD) per 1,000 inhabitants per day
(DID) over time. Details are provided by Anatomical Therapeutical Class (ATC). Overall consumption increases by 20 DID, from 40 to 60, between 2003 and 2014. The main share consists of Selective Serotonin Reuptake Inhibitors (SSRI), a relatively new ATC class (about 25% of total consumption in 2014). The other relatively new ATC class, Serotonin and Neurotonin Reuptake Inhibitors (SNRI), represents a smaller share of total consumption. Other antidepressants, among which are the Tricyclic An-tidepressants (TCA), account for about 17% in 2014. The increase in total consumption is mainly driven by the increase in consumption of SSRI. Herbal AD (N06A2) have been excluded from the analysis since daily doses for this class are not defined.
Figure 4: Consumption of generic and branded SSRI drugs (Citalopram and Escitalopram) over time (2003-2014).
Notes - This graph shows trends in the consumption of generic and branded SSRI drugs (Citalopram and Escitalopram)
orig-inally introduced by Lundbeck. The decline in branded Citalopram mirrors to a large extent the increase in branded Esci-talopram and generic CiEsci-talopram. In 2013, Lundbeck’s patent for EsciEsci-talopram expired and a generic version of EsciEsci-talopram entered the market.
Figure 5: Trends in suicides, mortality, depression hospitalisation, and beds in psychiatric hospitals (2003-2014).
Notes - This figure summarises the mental health situation in Switzerland. In the top-left graph we see suicides (ICD10
cate-gories X60-X84) per 10,000 inhabitants, which are declining over time. Assisted suicides are excluded from the figure since FSO has stopped recording these data from 2009. The top-right graph shows the trend in general mortality (excluding suidides). Although the mortality rate shows a decreasing trend, mortality in absolute numbers shows a slightly increasing trend. A net increase in the population due to the influx of migrants is responsible for this discrepancy. The bottom-right graph depicts hos-pitalisations for depression and its prevalence (ICD10 categories F32 and F33, respectively Depressive episodes and Recurrent depressive disorders). Although the prevalence of depression has decreased over time, hospital admissions have increased. This is probably a consequence of the reduction of beds in psychiatric hospitals, as suggested by bottom-left picture.
Figure 6: Coefficients plot from random effects estimates for branded and generic AD.
Notes - This figure shows estimated coefficients from a random effects regression of generic and branded AD on the full set of
regressors specified in Eq. (1). The estimates indicate that generic AD consumption is positively related with unemployment and negatively with income, which contrasts the results for general AD consumption. This indicates that worse socio-economic conditions may be a predictor of generic AD consumption. Conversely, branded AD consumption is negatively related to un-employment and positively related to income. Also, the consumption of branded AD is positively related to some demographic aspects such as the share of females, and negatively related to the share of young individuals (below 15 years) and adults (be-tween 15 and 65). The estimates also show a positive relation be(be-tween generic AD consumption and prescribing physicians. Branded consumption on the other hand is strongly and positively associated with neurologists/psychiatrists. This evidence may suggest that generics are more likely to be prescribed on need basis (worse economic conditions), whereas the demand for branded AD is more prone to the influence of supply side factors, which points in the direction of supply-induced demand. Reported confidence intervals are 95% using robust standard errors.
Figure 7: Coefficients plot from random effects estimates for branded Escitalopram and generic Citalo-pram.
This figure shows estimated coefficients from random effects regressions on the full set of regressors specified in Eq. (1) for the most important generic (Citalopram) and branded (Escitalopram) AD products. Citalopram is mostly generic, whereas Escitalopram is virtually only branded. We see that Citalopram consumption is positively related to unemployment and negatively related to income. This is similar to the estimates for generic AD in gen-eral (seeFigure 6) and indicates that Citalopram is mainly prescribed in regions with worse economic outcomes. Furthermore, the coefficient for GPs is positive and significant. The estimates for Escitalopram on the other hand only show a positive and strongly significant effect for prescribing neurologists and psychiatrists and a significant effect for females and those below 15. This is in accordance with the estimates previously reported for branded AD (seeFigure 6).
Reported confidence intervals are 95% using robust standard errors. aData have been normalised to 0 mean 0 and 1 standard deviation.
Table 1: Molecules included in the analysis by antidepressant class (EphMRA ATC code).
N06A4 - SSRI CITALOPRAM ESCITALOPRAM FLUOXETINE FLUVOXAMINE PAROXE-TINE SERTRALINE
N06A5 - SNRI DULOXETINE VENLAFAXINE N06A9 - TCA
and others
AGOMELATINE AMITRIPTYLINE BUPROPION CLOMIPRAMINE DIBEN-ZEPIN DOSULEPIN DOXEPIN IMIPRAMINE LOFEPRAMINE MAPROTI-LINE MIANSERIN MIRTAZAPINE MOCLOBEMIDE NEFAZODONE NOR-TRIPTYLINE OPIPRAMOL REBOXETINE TRAZODONE TRIMIPRAMINE
Notes - This table reports the molecules included in our analysis. The ATC classes N06A4 (Selective serotonin
re-uptake inhibitors - SSRI) and N06A5 (Serotonin norepinephrine re-uptake inhibitors - SNRI) represent the two newest classes of AD, whereas N06A9 (tricyclic AD and others) mainly represents older antidepressants. The N06A2 class (herbal AD) is excluded since defined daily doses are not calculated.
Table 2: Summary statistics.
Dependent variables Mean St. dev. ∆(2003 − 2014) Minimum Maximum
DID 45.43 13.05 20.03 19.58 101.38 DID branded 26.49 7.77 -4.09 12.01 56.62 DID generic 18.94 8.97 24.12 1.16 58.60 DID Escitalopram 6.07 3.82 10.13 0.52 23.24 DID Citalopram 9.51 3.10 -0.18 3.76 33.46 Control variables Unemployment 2.68 1.17 -0.23 0.51 6.86 Income 41,605.96 6,986.36 2,845.31 17,419.59 60,479.66 Females 50.46 0.85 -0.50 47.92 52.83 Population < 14 15.72 1.77 -2.32 10.03 20.82 Population 15-65 67.25 1.74 -0.11 60.69 71.55 Foreigners 18.70 7.18 3.69 3.65 40.95 German speaking 64.30 37.25 -0.00 1.58 96.77 Specialists 2.36 2.38 1.08 0.00 14.98 GPs 6.72 1.52 0.22 2.63 11.99 Hospital admissions 20.63 7.15 6.12 2.89 56.07 Mortality 80.36 15.08 -7.82 40.00 167.92 Altitude 871.69 502.40 -1.94 268.34 2,348.13 Population density 381.89 683.02 46.65 7.77 5,114.61
Notes - This table reports summary statistics for the variables included in our analysis. We see that the average
daily consumption of AD over the period 2003-2014 is 45 defined daily doses per 1,000 inhabitants. In some region consumption amounts to more than 100 DID. Consumption of branded AD represents the largest share of total consumption with 26 DID on average. Generics consumption is 19 DID on average and shows a rela-tively higher within-area variation as compared to branded AD. Citalopram is the most important generic AD with 9.5 DID on average, while branded Escitalopram accounts for 6 DID and exhibits higher within variation. This is probably due to the relatively recent entrance of Escitalopram into the market (just before 2003) with regional disparities in the speed of adoption of the new medication. Unemployment is on average below 3% in the whole period (2003-2014). Most of unemployment and income variation is between regions. On aver-age, median income is about 41,600 Swiss francs. The gender share is roughly the same between females and males. About 16% of people are below 15 years of age, while the working age population (15-64) constitutes the large majority of the population (about 67%). On average, almost 20% of the population is foreign, varying from 4% to 41%, mostly between regions. The share of German speaking population is on average 64%, with very little variation within regions over time. There is a little more than 2 neurologists and psychiatrists per 10,000 inhabitants, and a little less than 7 GPs. More than 20 inhabitants out of 10,000 is hospitalised for de-pression, while 80 people out of 10,000 inhabitants die for any cause. Lastly, 15% of regions have an altitude above 1,500 meters, and nearly 20% of regions has a population density of less than 50 inhabitants per km2.
Table 3: Estimates from OLS and panel regressions of total AD consumption per capita at spatial mobility region level. 1 2 3 4 5 6 OLS OLS RE RE FE FE Unemployment 3.514∗∗∗ 1.653∗∗∗ -.486 -.192 -.661 -.374 (.349) (.470) (.438) (.405) (.463) (.432) Income 8.301∗∗∗ 5.612∗∗∗ 7.864∗ 7.744 7.879 6.956 (2.182) (2.044) (4.750) (5.021) (5.748) (5.836) Females .469 1.253 1.071 .699 .675 (.403) (.793) (.759) (.985) (.938) Population < 14 -.737∗∗∗ -1.407∗∗∗ -1.242∗∗ -1.228∗ -1.128∗ (.187) (.510) (.487) (.668) (.643) Population 15-65 -.183 -1.119∗∗∗ -.919∗∗ -1.250∗∗∗ -1.074∗∗ (.150) (.384) (.359) (.462) (.436) Foreigners -.183∗∗∗ -.364∗ -.396∗∗ -.676∗∗ -.646∗∗ (.0687) (.200) (.197) (.286) (.275) German speaking -.0595∗∗∗ -.104∗∗∗ -.0973∗∗∗ 13.02 9.643 (.0133) (.0360) (.0338) (22.49) (22.52) Specialists 5.054∗∗∗ 3.609∗∗∗ 2.778∗∗ 2.848∗∗ 2.286∗ (.379) (1.124) (1.148) (1.286) (1.261) GPs 1.641∗∗∗ .774∗∗ .797∗∗ .640 .708∗ (.300) (.370) (.378) (.398) (.405) Other specialists 1.336∗∗ 1.023 (.656) (.679) Hospital admissions .0789∗∗∗ .0768∗∗∗ (.0260) (.0258) Mortality .0643∗∗∗ .0618∗∗∗ (.0170) (.0157)
Year FE Yes Yes Yes Yes Yes Yes
Canton FE Yes Yes Yes Yes Yes Yes
Geographical indicators Yes Yes Yes Yes No No
Observations 1272 1272 1272 1272 1272 1272
Mean dep var 45.43 45.43 45.43 45.43 45.43 45.43
adj. R2 .639 .763 .832 .837
Within R2 .833 .839 .834 .840
Between R2 .686 .710 .235 .233
Overall R2 .726 .745 .166 .162
Notes - Estimates of the determinants of antidepressant consumption using data from IMS Health Switzerland. Estimates
are obtained using data aggregated at SMR level on total AD consumption. Although the OLS estimates in the first two columns indicate a positive association between unemployment and AD consumption, this is not confirmed by the RE and FE estimates (columns 3-5). Moreover, income is generally positively related to antidepressant consumption. There is evidence that regions with a relatively higher share of young age categories and a higher share of foreigners or German speakers consume a lower amount of AD. Neurologists and psychiatrists are positively associated with AD consumption. The RE estimates in columns 3-5, and the FE estimates in columns 5-6 indicate that this is not due to a worse health status of the population, nor to hospital concentration in these regions. A similar result is found for prescribing GPs.
Table 4: Time trend coefficients from RE regressions of AD consumption on an increasing number of regressors
1 2 3 4 5
Time trend 1.769∗∗∗ 1.677∗∗∗ 1.720∗∗∗ 1.715∗∗∗ 1.442∗∗∗ (.0669) (.0833) (.177) (.178) (.153)
E _i t No Yes Yes Yes Yes
D_i t No No Yes Yes Yes
G_i No No No Yes Yes
S_i t No No No No Yes
Canton FE Yes Yes Yes Yes Yes
Observations 1272 1272 1272 1272 1272
Within R2 .801 .808 .818 .818 .825
Between R2 .529 .511 .520 .527 .683
Overall R2 .603 .592 .601 .606 .722
Notes - This table shows random effects (RE) estimates of antidepressant
consump-tion in DID. In each column, a new group of regressors, as specified in Eq. (1), is included. In the first column, AD consumption in regressed on time only to reveal the linear time trend. The consumption of AD grows steadily by 1.8 DID per year. In column 2, socio-economic determinants (Ei t) are added to the regression. The
time trend proves to be very persistent, although it lowers slightly to 1.7 DID. Simi-larly, adding demographic characteristics (Di t) in column 3 does not alter the linear
time trend. Geographical controls (Gi t) do not seem to explain the increase of AD consumption over time neither (column 4). Instead the addition of physicians (Si t)
to the regression does alter the time trend, which decreases to 1.4 DID. This suggests that prescribing physicians at least partially explain the increase in AD consumption over time, which may in turn indicate that demand is at least to some extent by the supply.
Significance levels:∗p < 0.10,∗∗p < 0.05,∗∗∗p < 0.01. Standard errors (in
A Appendix
Figure A.1: AD consumption by predominant language in the region.
Notes - This graph shows AD consumption distinguished by predominant language in the region. The time trend in
German-speaking regions is steeper than the time trend in Latin-German-speaking regions (French and Italian), although the level of consump-tion in the latter regions is generally higher throughout the whole time period.
Figure A.2: Consumption of SSRI drugs (therapeutic category N06A4) by active ingredient over time (2003-2014).
Notes - This graph shows the consumption of SSRI antidepressant drugs by active ingredient over time. Citalopram accounts
for the largest share of SSRI consumption, and Escitalopram shows the highest increase over time. Both active ingredients are originally marketed by the same pharmaceutical company (Lundbeck).
Figure A.3: Unemployment by gender.
Notes - This graph shows the development of unemployment in Switzerland over time by gender. There is a surge in
unem-ployment from 2008 to 2009. This can be attributed to the economic and financial crisis. Before the crisis, the unemunem-ployment rate for females is relatively higher than the rate for males. These figures have apparently swapped after the crisis since female unemployment is generally lower than male unemployment.
References
Angrist, J. D. and Pischke, J.-S. (2008). Mostly harmless econometrics: An empiricist’s companion. Prince-ton university press.
Avery, R. J., Eisenberg, M. D., and Simon, K. I. (2012). The impact of direct-to-consumer television and magazine advertising on antidepressant use. Journal of health economics, 31(5):705–718.
Baer, N., Schuler, D., Füglister-Dousse, S., and Moreau-Gruet, F. (2013). Depressionen in der Schweizer Bevölkerung. Daten zur Epidemiologie, Behandlung und sozial-beruflichen Integration (Obsan Bericht
56), Schweizerisches Gesundheitsobservatorium, Neuchâtel.
Barbui, C., Campomori, A., D’avanzo, B., Negri, E., and Garattini, S. (1999). Antidepressant drug use in Italy since the introduction of SSRIs: national trends, regional differences and impact on suicide rates.
Social psychiatry and psychiatric epidemiology, 34(3):152–156.
Barr, B., Taylor-Robinson, D., Scott-Samuel, A., McKee, M., and Stuckler, D. (2012). Suicides associated with the 2008-10 economic recession in England: time trend analysis. BMJ (Clinical research ed.), 345:e5142.
Barrett, B., Byford, S., and Knapp, M. (2005). Evidence of cost-effective treatments for depression: a systematic review. Journal of affective disorders, 84(1):1–13.
Cipriani, A., Zhou, X., Giovane, C. D., Hetrick, S. E., Qin, B., Whittington, C., Coghill, D., Zhang, Y., Hazell, P., and Leucht, S. (2016). Comparative efficacy and tolerability of antidepressants for major depressive disorder in children and adolescents: a network meta-analysis. The Lancet, 388(10047):881–890.
Cuijpers, P., Karyotaki, E., Weitz, E., Andersson, G., Hollon, S. D., and van Straten, A. (2014a). The effects of psychotherapies for major depression in adults on remission, recovery and improvement: a meta-analysis. Journal of affective disorders, 159:118–126.
Cuijpers, P., Turner, E., Mohr, D., Hofmann, S., Andersson, G., Berking, M., and Coyne, J. (2014b). Com-parison of psychotherapies for adult depression to pill placebo control groups: a meta-analysis.
Psy-chological medicine, 44(04):685–695.
Domino, M. E. (2012). Does managed care affect the diffusion of psychotropic medications? Health
economics, 21(4):428–443.
Fournier, J. C., DeRubeis, R. J., Hollon, S. D., Dimidjian, S., Amsterdam, J. D., Shelton, R. C., and Fawcett, J. (2010). Antidepressant drug effects and depression severity: a patient-level meta-analysis. Jama, 303(1):47–53.
Frank, R. G., Conti, R. M., and Goldman, H. H. (2005). Mental health policy and psychotropic drugs. The
Milbank Quarterly, 83(2):271–298.
Greenberg, P. E., Kessler, R. C., Birnbaum, H. G., Leong, S. A., Lowe, S. W., Berglund, P. A., and Corey-Lisle, P. K. (2003). The economic burden of depression in the united states: how did it change between 1990 and 2000? Journal of clinical psychiatry, 64(12):1465–1475.
Greenberg, P. E., Stiglin, L. E., Finkelstein, S. N., and Berndt, E. R. (1993). The economic burden of de-pression in 1990. The Journal of clinical psychiatry.
Griliches, Z. and Hausman, J. A. (1986). Errors in variables in panel data. Journal of Econometrics, 31(1):93–118.
Guaiana, G., Andretta, M., Corbari, L., Mirandola, M., Sorio, A., D’Avanzo, B., and Barbui, C. (2005). Antidepressant drug consumption and public health indicators in Italy, 1955 to 2000. The Journal of
Clinical Psychiatry, 66(6):750–755.
Hale, A. S. (2003). Pharmacological heterogeneity limits antidepressant study. BMJ (Clinical research
ed.), 327(7409):289.
Hausman, J. A. (1978). Specification tests in econometrics. Econometrica: Journal of the Econometric
Society, pages 1251–1271.
Healy, D. (2004). Let them eat Prozac: The unhealthy relationship between the pharmaceutical industry
and depression. nyu Press.
Hirschfeld, R. M., Keller, M. B., Panico, S., Arons, B. S., Barlow, D., Davidoff, F., Endicott, J., Froom, J., Goldstein, M., Gorman, J. M., et al. (1997). The national depressive and manic-depressive association consensus statement on the undertreatment of depression. Jama, 277(4):333–340.
Jakobsen, J. C., Katakam, K. K., Schou, A., Hellmuth, S. G., Stallknecht, S. E., Leth-Møller, K., Iversen, M., Banke, M. B., Petersen, I. J., Klingenberg, S. L., et al. (2017). Selective serotonin reuptake inhibitors versus placebo in patients with major depressive disorder. a systematic review with meta-analysis and trial sequential analysis. BMC psychiatry, 17(1):58.
Kamenov, K., Twomey, C., Cabello, M., Prina, A., and Ayuso-Mateos, J. (2017). The efficacy of psychother-apy, pharmacotherapy and their combination on functioning and quality of life in depression: a meta-analysis. Psychological medicine, 47(3):414–425.
Kirsch, I., Deacon, B. J., Huedo-Medina, T. B., Scoboria, A., Moore, T. J., and Johnson, B. T. (2008). Initial severity and antidepressant benefits: a meta-analysis of data submitted to the food and drug admin-istration. PLoS medicine, 5(2):e45.
Kirsch, I., Moore, T. J., Scoboria, A., and Nicholls, S. S. (2002). The emperor’s new drugs: an analysis of antidepressant medication data submitted to the US Food and Drug Administration. Prevention &
Treatment, 5(1):23a.
McCarthy, M. (2013). Antidepressant use has doubled in rich nations in past 10 years. BMJ (Clinical
research ed.), 347:f7261.
McInerney, M., Mellor, J. M., and Nicholas, L. H. (2013). Recession depression: Mental health effects of the 2008 stock market crash. Journal of health economics, 32(6):1090–1104.
Meijer, W. E., Heerdink, E., Leufkens, H. G., Herings, R. M., Egberts, A. C., and Nolen, W. A. (2004). In-cidence and determinants of long-term use of antidepressants. European journal of clinical
pharma-cology, 60(1):57–61.
Mojtabai, R. (2007). Americans’ attitudes toward mental health treatment seeking: 1990–2003.
Psychi-atric Services, 58(5):642–651.
Mojtabai, R. and Olfson, M. (2014). National trends in long-term use of antidepressant medications: results from the us national health and nutrition examination survey. The Journal of clinical psychiatry, 75(2):169–177.
Moore, M., Yuen, H. M., Dunn, N., Mullee, M. A., Maskell, J., and Kendrick, T. (2009). Explaining the rise in antidepressant prescribing: a descriptive study using the general practice research database. BMJ
(Clinical research ed.), 339:b3999.
OECD (2015). Health at a Glance 2015: OECD Indicators. OECD Publishing, Paris.
Poluzzi, E., Piccinni, C., Sangiorgi, E., Clo, M., Tarricone, I., Menchetti, M., and De Ponti, F. (2013). Trend in ssri-snri antidepressants prescription over a 6-year period and predictors of poor adherence.
Euro-pean journal of clinical pharmacology, 69(12):2095–2101.
Schuler, D., Tuch, A., Buscher, N., and Camenzind, P. (2016). Psychische gesundheit in der schweiz.
Monitoring. Schweizerisches Gesundheitsobservatorium. Neuchâtel. www. obsan. ch.
Shapiro, B. T. (2018). Positive spillovers and free riding in advertising of prescription pharmaceuticals: The case of antidepressants. Journal of political economy, 126(1):000–000.
Sobocki, P., Jönsson, B., Angst, J., and Rehnberg, C. (2006). Cost of depression in europe. The journal of
mental health policy and economics, 9(2):87–98.
Steinert, C., Hofmann, M., Kruse, J., and Leichsenring, F. (2014). Relapse rates after psychotherapy for depression-stable long-term effects? A meta-analysis. Journal of affective disorders, 168:107–118.
Stewart, W. F., Ricci, J. A., Chee, E., Hahn, S. R., and Morganstein, D. (2003). Cost of lost productive work time among us workers with depression. Jama, 289(23):3135–3144.
Tomonaga, Y., Haettenschwiler, J., Hatzinger, M., Holsboer-Trachsler, E., Rufer, M., Hepp, U., and Szucs, T. D. (2013). The economic burden of depression in Switzerland. PharmacoEconomics, 31(3):237–250.
Whiteford, H. A., Degenhardt, L., Rehm, J., Baxter, A. J., Ferrari, A. J., Erskine, H. E., Charlson, F. J., Nor-man, R. E., FlaxNor-man, A. D., and Johns, N. (2013). Global burden of disease attributable to mental and substance use disorders: findings from the Global Burden of Disease Study 2010. The Lancet, 382(9904):1575–1586.
IdEP Economic Papers
2014: No. 01
F. Mazzonna, F. Peracchi, Unhealthy retirement? Evidence of occupation heterogeneity No. 02
L. Di Giorgio, M. Filippini, G. Masiero, The relationship between costs and quality in nonprofit nursing homes
No. 03
F.C. Billari, V. Galasso, Fertility decisions and pension reforms : evidence from natural experiments in Italy
No. 04
M. Jametti, M. Joanis, Elections and de facto expenditure decentralization in Canada No. 05
M. Jametti, Weathering the global financial crisis : is direct democracy of any help? No. 06
U. Pagano, M. Vatiero, Costly institutions as substitutes : novelty and limits of the Coasian approach
No. 07
R. Parchet, Are local tax rates strategic complements or strategic substitutes? No. 08
R. Ippoliti, M. Vatiero, An analysis of how 2002 judicial reorganization has impacted on the performance of the First Instance Courts (Preture) in Ticino
No. 09
F. Mazzonna, P. Salari, Short term effects of public smoking bans on health
The series IdEP Economic Papers, ideally continues the work of the “Quaderni della Facoltà” the publication of which began in 1998 and ended in 2013.
For a complete list of the Quaderni see: http://econpapers.repec.org/paper/lugwpaper/
IdEP Economic Papers also gathers the legacy of the CEPRA Working Papers, published from 2012 to 2013.
2015: No. 01
S. Galletta, Direct democracy, partial decentralization and voter information : evidence from Swiss municipalities
No. 02
I. Sarman, Second homeowners’ intention to move : an integrated ordered logit model with latent variable
No. 03
M.J. Roe, M. Vatiero, Corporate governance and its political economy No. 04
M. Filippini, M. Koller, G. Masiero, Competitive tendering versus performance-based negotiation in Swiss public transport
No. 05
O. Giuntella, F. Mazzonna, If you don’t snooze you lose health and gain weight : evidence from a regression discontinuity design
No. 06
M. Filippini, B. Hirl, G. Masiero, Rational habits in residential electricity demand
2016: No. 01
S. Galletta, Law enforcement, municipal budgets and spillover effects : evidence from a quasi-experiment in Italy
No. 02
S. Galletta, A. Redonda, Corporate flat tax reforms and businesses’ location choices. Evidence from Switzerland
No. 03
M. Filippini, W. Greene, G. Masiero, Persistent and transient productive inefficiency in a regulated industry : electricity distribution in New Zealand
No. 04
M. Vatiero, On the (political) origin of “corporate governance” species No. 05
E. Gentili, G. Masiero, F. Mazzonna, The role of culture in long-term care No. 06
M. Vatiero, Learning from the Swiss corporate governance exception No. 07
2017: No. 01
P. Bello, Exchange rate fluctuations and border crossings : evidence from the Swiss-Italian border
No. 02
E. Gentili, F. Mazzonna, What drives the substitutability between native and foreign workers? Evidence about the role of language
No. 03
G. Daniele, S. Galletta, B. Geys, Abandon ship? Party brands and politicians’ responses to a political scandal
2018: No. 01
G. Masiero, F. Mazzonna, O. Verbeek, What drives the rise of antidepressant consumption? Evidence from Switzerland