HAL Id: tel-01398358
https://tel.archives-ouvertes.fr/tel-01398358
Submitted on 17 Nov 2016
HAL is a multi-disciplinary open access
archive for the deposit and dissemination of sci-entific research documents, whether they are pub-lished or not. The documents may come from teaching and research institutions in France or abroad, or from public or private research centers.
L’archive ouverte pluridisciplinaire HAL, est destinée au dépôt et à la diffusion de documents scientifiques de niveau recherche, publiés ou non, émanant des établissements d’enseignement et de recherche français ou étrangers, des laboratoires publics ou privés.
Identification and functional characterization of gene
defects underlying congenital stationary night blindness
(csnb)
Marion Neuille
To cite this version:
Marion Neuille. Identification and functional characterization of gene defects underlying congenital stationary night blindness (csnb). Neurons and Cognition [q-bio.NC]. Université Pierre et Marie Curie - Paris VI, 2016. English. �NNT : 2016PA066139�. �tel-01398358�
Université Pierre et Marie Curie
Ecole doctorale Physiologie, Physiopathologie et Thérapeutique (ED394)
Institut de la Vision – Département de Génétique –Identification des défauts génétiques conduisant à des pathologies oculaires progressives ou non-progressives
Identification and functional characterization of gene
defects underlying congenital stationary night blindness
(CSNB)
Par Marion NEUILLE
Thèse de doctorat de Neurosciences
Dirigée par Christina ZEITZ
Présentée et soutenue publiquement le 27 Juin 2016
Devant un jury composé de :
Dr Florian SENNLAUB, DR2, Président du jury Pr Stephan NEUHAUSS, Professeur, Rapporteur Dr Jean-Michel ROZET, DR2, Rapporteur
Pr Shomi BHATTACHARYA, Professeur, Examinateur Dr Isabelle AUDO, MCU-PH, Co-directrice de thèse Dr Christina ZEITZ, DR2, Directrice de thèse
ACKNOWLEDGMENTS-REMERCIEMENTS
First of all, I would like to thank the members of the jury who kindly accepted to take on their time for reading my thesis manuscript, for making constructive comments on my work and for coming to Paris to attend the defense. I specially thank Florian Sennlaub for his precious help, Stephan Neuhauss and Shomi Bhattacharya for their benevolent support during these last four years.
Je tiens à remercier la Fondation Voir et Entendre, la Fondation des Aveugles de France et, à travers elles, tous leurs donateurs qui m’ont offert l’opportunité d’entreprendre mon doctorat. Je remercie sincèrement le professeur José-Alain Sahel de m’avoir accueillie au sein de l’Institut de la Vision. Je réalise la chance que j’ai pu avoir de côtoyer chaque jour des chercheurs et cliniciens de renommée internationale dans un environnement où tous les moyens sont mis en œuvre pour aboutir à une recherche de haut niveau mais toujours à destination du patient.
Un doctorant ne serait pas un doctorant sans son directeur de thèse. Comment te remercier, Christina, d’avoir toujours cru en moi, de m’avoir guidée, accompagnée, encouragée, rassurée et même consolée ? Je te remercie de ta patience, de ta disponibilité, de tes conseils et de ton ouverture d’esprit. Tu m’as ouvert en grand les portes du monde de la recherche en me permettant de communiquer régulièrement mes résultats par écrit ou par oral dans les publications et lors des congrès, de participer à la rédaction des demandes de financement et de collaborer avec les différentes équipes qui m’ont permis de mener à bien mon projet. Merci également de m’avoir laissé la liberté de pratiquer mon sport en compétition.
J’aimerais également te remercier Isabelle d’avoir été ma co-directrice. Malgré tes deux vies, tu as toujours trouvé le temps de me prodiguer de précieux conseils et de nombreuses explications cliniques. Ta passion de la recherche et de la médecine est communicative, elle m’a apporté la conviction que mon travail ne servait pas uniquement à améliorer la connaissance pour la connaissance mais pouvait surtout contribuer à améliorer la qualité de vie de nombreux patients et de leur famille.
Elise B., Thomas, Juliette V., Juliette W. et Diana ! Merci de votre accueil, de votre gentillesse, de votre soutien et de votre bonne humeur au quotidien, je sais qu’il en faut du courage pour subir mes bavardages et mes râleries. Votre amitié m’est précieuse et j’espère qu’on pourra s’organiser un petit quelque chose un de ces jours. Une pensée toute particulière pour Christelle. Merci de m’avoir tenu la main pendant les longues heures de manip in vivo, de m’avoir aidée tout au long de ces 4 ans, d’avoir partagé tous les bons moments (et aussi les moins bons) et d’avoir enduré mes raisonnements qui vont trop vite. A un de ces jours au Moulin ou dans le bois de l’Epine pour un pique-nique !
Je remercie chaleureusement tous les personnels de l’animalerie et des différentes plateformes avec lesquelles j’ai pu travailler et sans qui je n’aurais pas pu faire grand-chose : Isabelle, Béatrice, Léa, Vanessa, Manu, Julie, Quénol, Jennifer, Caroline, Yvrick, Stéphane, David, Marie-Laure, Thibaut, Camille et ceux que j’ai involontairement oubliés. Merci à tous pour votre aide et votre bienveillance.
Je tenais également à remercier les chercheurs, ingénieurs et personnels techniques de l’Institut de la Vision qui ont, de près ou de loin, contribué à la réalisation de ce projet : Xavier Guillonneau, Alain Chédotal, Kim Nguyen-Ba-Charvet, Olivier Goureau, Deniz Dalkara, Serge Picaud, Jonathan Chatagnon. Je remercie particulièrement Romain Caplette qui a grandement participé aux expériences de MEA et Manuela Argentini qui m’a initiée à la spectrométrie de masse. Merci pour votre disponibilité, votre aide et vos conseils avisés. I would like also to thank the amazing people of my office for sharing about scientific (or less scientific!) subjects: Najate, Abhishek, Oriol, Cataldo, Takuma, Hawa, Marcela, Stefania, Nicolas, Pavol, Francesco, Alexandra, Sabine, Kristo.
Chacun son dérivatif pour tenir face au stress. Pour certains c’est le chocolat, pour moi c’est l’équitation (bon, je ne crache pas sur le chocolat non plus). Un grand merci à la fine équipe du samedi 11h (même si on n’a jamais été à l’heure) : Laurence L., Héloïse, François J., Magali, Selma et Céline ; à la merveilleuse team compet’ dressage : Dominique, Laurence B., Sylvie et Patrice, Dalila, Pascal, Vanessa et Marie ; aux supers membres du bureau : Yveline, Edwige, François M., Philippe et Bernard ; et à tous les autres que j’ai eu le plaisir de côtoyer. Merci pour tous ces bons moments qui nous font oublier pour un temps nos ennuis quotidiens et pour votre soutien. Il nous énerve parfois, il gueule beaucoup (c’est justifié mais, chut, faut pas le dire sinon il ne rentrera plus dans ses boots) mais on l’aime bien quand même. Merci
Jean-Phi pour ta patience et pour nous pousser à donner le meilleur (on essaie). Une pensée pour mes deux gros, Nonor et Paulo.
Impossible d’oublier dans ces remerciements ma copine de pogo Sandra, toujours là après plus de 10 ans ! Il s’en est passé des choses depuis le petit salon de coiffure de Fontaine… Et à ma Lennychou, mon petit rayon de soleil. Tata Ionion vous aime fort les filles.
On garde toujours le meilleur pour la fin. Je voudrais donc conclure avec la famille la plus formidable du monde : la famille Neuillé-Poupin. Un très grand merci à vous tous pour votre soutien indéfectible et votre amour inconditionnel durant ces 29 dernières années. A ma petite Maman et mon petit Papa, à Papi Michel et Mamie Nicole, à Mamie Madeleine (j’aurais aimé que tu sois là pour me voir docteur, même si ce n’est pas en médecine), à Tonton Eric et Tata Carole. A ma merveilleuse et courageuse cousine Sophie. A ma Lulu (alias Martin), ce n’est pas facile tous les jours mais ton Bobby sera toujours là. Je vous aime.
TABLE OF CONTENTS
ACKNOWLEDGMENTS-REMERCIEMENTS ... 1
TABLE OF CONTENTS ... 4
LIST OF FIGURES AND TABLES ... 7
LIST OF ABBREVIATIONS ... 9
INTRODUCTION ... 13
I. The visual system in the retina ... 13
A. General considerations about retinal and visual processing ... 13
1. Transmission of the visual signal from the eye to the brain ... 13
2. Histology of the retina ... 14
B. The visual cascade in the retina ... 16
1. Photoreceptors ... 16
a. Types and structure: comparison between human and mouse ... 16
b. Density and localization in the retina: comparison between human and mouse.. ... 17
c. The phototransduction cascade ... 18
d. Glutamate release ... 19
e. Photoreceptor synapses ... 20
2. ON pathways ... 21
a. Different subtypes of ON-BCs and their proximal synapse ... 21
b. The mGluR6 signaling cascade at the ON-BC dendritic tip ... 22
c. The distal synapses of ON-BCs and ON-RGCs ... 23
3. OFF pathways ... 24
a. Different subtypes of OFF-BCs and their proximal synapse ... 24
b. Ionotropic glutamate receptors ... 24
c. The distal synapse of OFF-BCs and OFF-RGCs ... 25
4. Receptive fields of RGCs ... 25
C. Diagnostic tools for retinal diseases: comparison between human and mouse ... 26
1. Visual acuity (VA) ... 26
a. In human: Early Treatment Diabetic Retinopathy Study (ETDRS) chart ... 27
b. In mouse: the optomotor response ... 27
2. Fundus examination ... 28
a. Funduscopy ... 28
b. Fundus autofluorescence (FAF) ... 29
3. Structure of the retina: spectral domain optical coherence tomography (SD-OCT). ... 29
4. Function of the retina ... 30
a. Full-field electroretinogram (ERG) ... 30
b. Multi-electrode array (MEA) ... 32
A. Different forms of CSNB ... 34
1. The Riggs-type of CSNB ... 34
2. The Schubert-Bornschein-type of CSNB ... 35
a. Incomplete CSNB (icCSNB) ... 35
b. Complete CSNB (cCSNB) ... 36
B. CSNB genes and mutations ... 37
1. Gene identification strategies ... 37
2. Riggs-type of CSNB ... 37
3. Schubert-Bornschein-type of CSNB ... 38
a. icCSNB ... 38
b. cCSNB ... 39
C. Animal models for cCSNB ... 39
1. Animal models for Nyx gene defect ... 40
a. Mouse model for Nyx gene defect ... 40
b. Zebrafish model for nyx gene defect ... 41
2. Animal models for Grm6 gene defect ... 41
a. Mouse models for Grm6 gene defect ... 41
b. Zebrafish model for grm6 gene defect ... 42
3. Animal models for Trpm1 gene defect ... 42
a. Mouse models for Trpm1 gene defect ... 42
b. Horse model for Trpm1 gene defect ... 42
4. Animal models for Gpr179 gene defect ... 43
a. Mouse model for Gpr179 gene defect ... 43
b. Zebrafish model for gpr179 gene defect ... 43
D. Pathogenic mechanism(s) of gene defects underlying cCSNB ... 43
1. GRM6/Grm6 mutations ... 44
2. NYX/Nyx mutations ... 45
3. TRPM1/Trpm1 mutations ... 46
4. GPR179/Gpr179 mutations ... 46
III. Objectives of the study ... 49
MATERIALS AND METHODS ... 50
I. Ethics statements ... 50
II. Animal care ... 50
III. DNA constructs and antibodies ... 50
IV. Electron microscopy ... 51
V. Immunohistochemistry ... 51
A. Preparation of retinal sections ... 51
B. Immunostaining of retinal sections ... 52
C. Image acquisition ... 52
VI. ON/OFF ERG ... 52
VII. MEA ... 53 VIII. Analysis of mouse and human LRIT3 in overexpressing cells though mass
A. Cell culture and transfection ... 54
B. Immunoprecipitation and Western blotting ... 54
C. Silver staining ... 55
D. Mass spectrometry analyses: LC-MS/MS acquisition ... 55
RESULTS ... 57
I. Identification of novel mutations in SLC24A1 in the Riggs-type of CSNB ... 57
Next-generation sequencing confirms the implication of SLC24A1 in autosomal-recessive congenital stationary night-bindness ... 58
II. Identification and functional characterization of LRIT3, a novel molecule implicated in cCSNB ... 69
A. Whole-Exome Sequencing Identifies LRIT3 Mutations as a Cause of Autosomal-Recessive Complete Congenital Stationary Night Blindness ... 71
B. Lrit3 deficient mouse (nob6): a novel model of complete congenital stationary night blindness (cCSNB) ... 81
C. LRIT3 is essential to localize TRPM1 to the dendritic tips of depolarizing bipolar cells and may play a role in cone synapse formation ... 95
D. Ultrastructure of the rod and cone synapses in the nob6 mouse model ... 106
1. Rod synapses ... 106
2. Cone synapses ... 107
3. Localization of several ionotropic glutamate receptors and Pikachurin in the OPL… ... 109
E. Functionality of ON- and OFF-pathways in the nob6 mouse model ... 111
1. ON/OFF ERG ... 111
2. MEA ... 112
F. Analysis of mouse and human LRIT3 through mass spectrometry ... 113
1. Mouse LRIT3 immunoprecipitation ... 114
2. Human LRIT3 immunoprecipitation ... 114
3. Silver staining ... 115
4. Mass spectrometry ... 115
III. Other projects ... 117
KIZ identification and characterization project ... 117
Genome editing approaches applied to Rhodopsin mutations project ... 117
mGluR6 gene therapy project ... 118
DISCUSSION AND PERSPECTIVES ... 119
I. Identification of gene defects in CSNB ... 119
II. Functional characterization of new gene defects identified in CSNB ... 120
III. Development of therapeutic approaches for CSNB ... 126
A. Gene therapy for the dominant mode of inheritance ... 127
B. Gene therapy for recessive or X-linked modes of inheritance ... 128
LIST OF FIGURES AND TABLES
Figure 1: Schematic representation of a human eye in cross-section with an enlargement of the retina
Figure 2: Schematic representation of the visual input from the eye to the brain Figure 3: Simple representation of retinal layers
Figure 4: Summary of retinal pigment epithelium functions Figure 5: Schematic structure of rod and cone photoreceptors Figure 6: Rod and cone densities in the human retina
Figure 7: Schematic representation of rod phototransduction
Figure 8: Schematic drawing of the molecular pathways at the first visual synapse between photoreceptors and ON-BCs without considering LRIT3
Figure 9: Organization of the rod spherule Figure 10: Organization of the cone pedicle
Figure 11: The different subtypes of BCs in mouse retina Figure 12: Rod and cone pathways in the mammalian retina
Figure 13: Patterns of iGluRs expressed by the different subtypes of OFF-BCs Figure 14: The receptive fields of RGCs and their behavior
Figure 15: ETDRS chart and table showing ETDRS score with decimal conversion Figure 16: Picture of the dispositive used for the optomotor test
Figure 17: Normal human (left) and mouse (right) fundus Figure 18: Normal human (left) and mouse (right) FAF images Figure 19: Normal human (left) and mouse (right) SD-OCT scans Figure 20: Origin of the a- and b-waves in the dark-adapted ERG
Figure 21: Normal human photopic ERG duration series for 10- to 300-ms flashes to isolate the d-wave
Figure 22: Peristimulus time histogram representing the average response to a full-field flash Figure 23: Normal vision (left and right) compared with what an individual suffering from CSNB sees in dim-light conditions (center)
Figure 24: Representative ERG traces from a patient suffering from the Riggs-type of CSNB (left) compared to a non-affected individual (right)
Figure 25: Representative ERG traces of individuals with cCSNB (top) and icCSNB (middle) as compared to a normal subject (bottom)
Figure 26: Genes implicated in CSNB according to ERG and mode of inheritance at the beginning of my thesis
Figure 27: Schematic drawing of proteins implicated in cCSNB at the beginning of my thesis with identified mutations
Figure 28: Ultrastructure of rod and cone synapses in Lrit3nob6/nob6 mice Figure 29: Serial reconstruction of a cone pedicle in a Lrit3nob6/nob6 retina
Figure 30: Localization of ionotropic glutamate receptors GluR1 and GluR5 and Pikachurin in a Lrit3nob6/nob6 retina
Figure 32: ON- and OFF-responses of RGCs in Lrit3nob6/nob6 retinas
Figure 33: Immunoprecipitation of the murine LRIT3-Myc fusion protein from transfected cell lysates with anti-Myc or anti-LRIT3 antibodies
Figure 34: Immunoprecipitation of the human LRIT3-Myc fusion protein from transfected cell lysates with anti-Myc or anti-LRIT3 antibodies
Figure 35: Silver staining of Myc- and LRIT3-immunoprecipitated protein extracts from non-transfected cells (NT) and cells non-transfected with the human (H) or the mouse (M) LRIT3-Myc construct before (left) and after (right) cutting of bands
Figure 36: Schematic drawing of major molecules important for the first visual synapse between photoreceptors and ON-BCs in light of discovery of LRIT3’s role in the retina
Table 1: Physiological cellular origins of ERG waves under different testing conditions
Table 2: Localization of many known components of the mGluR6 signaling cascade at the dendritic tips of ON-BCs in cCSNB mouse models without considering LRIT3
Table 3: Ultrastructural defects of photoreceptor ribbon synapses in knock-out mice with mutations in different components of the mGluR6 signaling cascade
LIST OF ABBREVIATIONS
Å: Angström
AAV: adeno-associated vector
ABCA4: ATP binding cassette subfamily A member 4
AMPA: α-amino-3-hydroxy-5-methyl-4-isoxazole propionic acid ARVO: Association for Research in Vision and Ophthalmology ATPase: adenosine triphosphatase
BCA: bicinchoninic acid BCs: bipolar cells Bgeo: beta-galactosidase BM: Bruch’s membrane Ca: calcium
CABP4/CABP4: calcium binding protein 4
CACN2B: calcium voltage-gated channel auxiliary subunit beta 2
CACNA1F/CACNA1F: calcium channel, voltage-dependent, alpha 1F subunit CACNA2D4: calcium channel, voltage-dependent, alpha 2/delta subunit 4 cCSNB: complete congenital stationary night blindness
cd: candela
cGMP: cyclic guanosine 3’, 5’-monophosphate CO2: carbon dioxide
CSNB: congenital stationary night blindness Da: Dalton
DAPI: 4',6-diamidino-2-phenylindole DEP: Dishelved, Egl-10, Pleckstrin Dg/DG: dystroglycan
DGC: dystrophin-glycoprotein complex
DHEX: Disheveled, Egl-10, Pleckstrin helical extension DMEM: Dulbecco's Modified Eagle Medium
DNA: deoxyribonucleic acid
DOG: Genetic section of the German Association for Ophthalmology DTT: 1,4-dithiothreitol
ELM: external limiting membrane EM: electron microscopy
ERG: electroretinogram
ETDRS: Early Treatment Diabetic Retinopathy Study EZ: ellipsoid zone
FAF: fundus autofluorescence
FRM: Fondation pour la Recherche Médicale GAP: guanosine 5'-triphosphatase activating protein GCL: ganglion cell layer
GDP: guanosine 5'-diphosphate GFP: green fluorescent protein GGL: G protein gamma-like domain GluR: glutamate receptor
Gnao1/Goα1: G protein subunit alpha o1
GNAT1/Gnat1: guanine nucleotide binding protein, alpha transducin 1 Gnb3/Gβ3: G protein subunit beta 3
Gnb5/Gβ5: G protein subunit beta 5 GPCR: G protein-coupled receptor GPI: glycosylphosphatidylinositol
GPR179/Gpr179/gpr179/GPR179: G protein-coupled receptor 179 GRM6/Grm6/grm6/mGluR6: glutamate receptor, metabotropic 6 GTP: guanosine 5'-triphosphate
HEK: human embryonic kidney HRP: horseradish peroxidase
icCSNB: incomplete congenital stationary night blindness iGluRs: ionotropic glutamate receptors
InDels: insertions/deletions INL: inner nuclear layer IPL: inner plexiform layer IS: inner segments
IZ: interdigitation zone K: potassium
KA2: glutamate receptor, ionotropic, kainate 5 (gamma 2) kb: kilobase
KIZ: kizuna
L-cone: long-wavelength light sensitive cone LF: lipofuscin
LGN: lateral geniculate nucleus
LRIT3/Lrit3/LRIT3: leucine rich-repeat, immunoglobulin-like and transmembrane domains 3 LRR: leucine rich-repeat
LRRCT: C-terminal leucine rich-repeat LRRNT: N-terminal leucine rich-repeat m/z: mass to charge ratio
M-cone: medium-wavelength light sensitive cone MEA: multi-electrode array
mRNA: messenger ribonucleic acid MYO7A: myosin VIIA
MZ: myoid zone NA: numerical aperture Na: sodium
NaCl: sodium chloride NFL: nerve fiber layer
NGS: next-generation sequencing NH4CO3: ammonium carbonate NMDA: N-methyl-D-aspartate nob: no b-wave NYX/Nyx/nyx/NYX: nyctalopin O2: dioxigen
ONL: outer nuclear layer OPL: outer plexiform layer OS: outer segments
P2: post-natal day 2 P30: post-natal day 30 PB: phosphate buffer
PBS: phosphate buffer saline PDE: phosphodiesterase PDE6A: phosphodiesterase 6A
PDE6G: phosphodiesterase 6G PNA: peanut agglutinin
ppm: parts per million
PSD-95: post-synaptic density 95 PSTH: peristimulus time histogram Puro: puromycin
R9AP: regulator of G-protein signaling 9 binding protein RGCs: retinal ganglion cells
RGS: regulator of G-protein signaling
Rgs11/RGS11: regulator of G-protein signaling 11 Rgs7/RGS7: regulator of G-protein signaling 7 RGS9 : regulator of G-protein signaling 9 RHO: rhodopsin
RPE: retinal pigment epithelium
S-cone: short-wavelength light sensitive cone
SD-OCT: spectral domain optical coherence tomography SDS: sodium dodecyl sulphate
SDS-PAGE: sodium dodecyl sulfate polyacrylamide gel electrophoresis SGOF: Société de Génétique Ophtalmologique Francophone
SLC24A1/Slc24a1/SLC24A1: solute carrier family 24, member 1 SLC24A2: solute carrier family 24, member 2
SLO: scanning laser ophthalmoscope Tris: Trishydroxymethylaminomethane
TRPM1/Trpm1/TRPM1: transient receptor potential cation channel, subfamily M, member 1 UV-cone: ultraviolet light sensitive cone
v/v: volume per volume V1: primary visual cortex VA: visual acuity
w/v: weight per volume
INTRODUCTION
I. The visual system in the retina
A. General considerations about retinal and visual processing
1. Transmission of the visual signal from the eye to the brain
The retina is the light-sensitive part of the eye and corresponds to the inner-most layer of the posterior part of the ocular globe. Light enters the eye through the pupil; a circular muscle called the iris controls the diameter of the pupil, and it also gives the eye color. The transparent cornea covers both of these tissues anteriorly. After entering through the pupil, light passes through the crystalline lens and the vitreous chamber before finally reaching the retina. Cornea and crystalline lens accommodation is necessary for the formation of a sharp image on the retina. Moreover, transparency of the lens and vitreous humor is essential for sufficient light transmission to the retina. The retina is part of the central nervous system and is composed of several layers of neurons surrounded by glial cells and interconnected by synapses (Figure 1). The retina lays on a monolayer of epithelial cells, known as the retinal pigment epithelium (RPE).
Figure 1: Schematic representation of a human eye in cross-section with an enlargement of the retina (modified from Webvision)
Once light reaches the retina, photons (elementary particles of light) are captured by rod and cone photoreceptors which transform light into a biochemical signal. This signal is transmitted to bipolar cells (BCs) and then retinal ganglion cells (RGCs) which in turn transform the signal into action potentials. The visual signal is then carried by axons of RGCs that form the optic nerve to the lateral geniculate nucleus (LGN). Finally, the visual signal
where the information is analyzed to create images (Figure 2). A separate part of the brain, the accessory visual cortex, is responsible for image memory and higher visual processing.
Figure 2: Schematic representation of the visual input from the eye to the brain (modified from Webvision). LGN: lateral geniculate nucleus; V1: primary visual cortex
2. Histology of the retina
The retina is composed of 10 different layers, listed below from the inner retina (vitreous side) towards the outer retina (choroid side) (Figure 3):
the inner limiting membrane, a basal membrane associated with Müller glial cell end feet, forming a barrier between the retina and vitreous
the nerve fiber layer (NFL), composed of axons of RGCs that form the optic nerve the ganglion cell layer (GCL), containing ganglion cell bodies
the inner plexiform layer (IPL), formed by vertical synapses connecting bipolar and ganglion cells and horizontal synapses connecting bipolar and amacrine cells
the inner nuclear layer (INL), containing cell bodies of amacrine, bipolar, horizontal cells and Müller cells
the outer plexiform layer (OPL), formed by vertical synapses connecting photoreceptor and BCs and horizontal synapses connecting photoreceptors and horizontal cells
the outer nuclear layer (ONL), containing photoreceptor cell bodies
the external limiting membrane, a zone of adherent junctions between Müller cells and photoreceptor inner segments, forming a barrier between the subretinal space and the neural retina
the photoreceptor layer, which is composed of the inner and outer segments of photoreceptors
Figure 3: Simple representation of retinal layers (modified from Webvision)
Figure 4: Summary of retinal pigment epithelium functions (adapted from (1))
Horizontal cells play an important role in the organization of the spatially opponent receptive fields of BCs and RGCs, which modulate the photoreceptor signal for better light sensitivity and adjust the synaptic gain. Amacrine cells serve to integrate, modulate and interpose a temporal domain to the visual message presented to the ganglion cell. Müller cells are glial cells that are necessary to maintain the correct structure and function of the neural retina. Epithelial cells from the RPE form the hemato-retinal barrier and are essential for the survival of the photoreceptors. They are responsible for the phagocytic cycle of photoreceptor outer segments, the recycling of 11-cis retinal through the vitamin A cycle, protection against oxidative stress induced by light, the supply of nutrients to the retina, the ionic balance and the secretion of trophic factors (1) (Figure 4).
B. The visual cascade in the retina
1. Photoreceptors
a. Types and structure: comparison between human and mouse
Photoreceptors are the first order neurons of the retina. They are located in the outer part of the retina and transform photons (light energy) into an electrochemical signal. In mammals, two types of photoreceptors coexist: rods and cones, which are named according to the shape of their outer segments. Each photoreceptor is composed of an outer and inner segment. The phototransduction cascade takes place in the outer segment. The inner segment contains a lot of mitochondria and ribosomes and is connected to the outer segment through a connecting cilium. The cell body contains the nucleus and the synaptic terminal contacts the second order neurons of the retina (2). The outer segments of photoreceptors are filled with stacks of discs continuously extending from the connecting cilium; these stacks contain visual pigment molecules called opsins (3). Outer segments are also continuously digested by RPE cells, which serve to maintain a consistent length of the outer segments. In rods, the discs are independent from the plasma membrane, which envelops the entire outer segment, whereas in cones, the plasma membrane itself invaginates to form the stacks (Figure 5).
Figure 5: Schematic structure of rod and cone photoreceptors (adapted from (2))
Rods are responsible for vision under dim light conditions at night. They only need one photon to be activated and their function is saturable. Their outer segments contain the pigment molecule rhodopsin, encoded by RHO, with a peak-sensitivity around 500 nm wavelength of light. Cones mediate color vision and function in bright light. There are three types of cones in the human retina defined by the expression of three distinct opsins with
different light sensitivities (4). S-cones express a short-wavelength sensitive opsin that peaks at 437 nm, M-cones express a medium-wavelength sensitive opsin peaking at 533 nm, and L-cones express a long-wavelength sensitive opsin peaking at 564 nm. In contrast to humans, only two types of cones are present in the mouse retina, expressing two different opsins with different light sensitivities. UV-cones express an ultraviolet light sensitive opsin peaking at 370 nm and M-cones express a medium-wavelength sensitive opsin peaking at 511 nm (5).
b. Density and localization in the retina: comparison between human and mouse
Photoreceptors are distributed on the whole surface of the retina except above the optic disc, the nasal zone where the optic nerve fibers leave the eye. The optic disc corresponds to the “blind spot” in the visual field. Although humans are diurnal mammals and mice are nocturnal mammals, the retina of both species is dominated by rods: the human retina is composed of approximately 95% rods and 5% cone photoreceptors (6) and the mouse retina is composed of approximately 97% rods and 3% cone photoreceptors (7). The human and mouse retinas contain a specialized central area known as the macula and area centralis (8), respectively. These regions are highly enriched in cones as compared to the rest of the retina, although rods are still the predominant photoreceptor type in this region. However, the most central part of the macula in humans (but not mice) is a region called the fovea that is composed exclusively of cones (6) (Figure 6); this region is responsible for sharp central vision and maximal visual acuity. Although the murine retina lacks a fovea, the general composition and organization of photoreceptors in murine and human retinas are otherwise comparable (9).
Figure 6: Rod and cone densities in the human retina (adapted from (10))
present on the whole retinal surface, but they are the only types of cones in the fovea. S-cones represent only 10% of cones and are completely absent from the fovea (11). In mice, M-cones localize to the dorsal half of the retina whereas UV-cones localize mainly to the ventral half (12).
c. The phototransduction cascade
As previously described, photoreceptors transform light into a biochemical signal. The first steps of this transformation occur as part of the phototransduction cascade, whereby the capture of a photon leads to the hyperpolarization of the photoreceptor plasma membrane (13) (Figure 7).
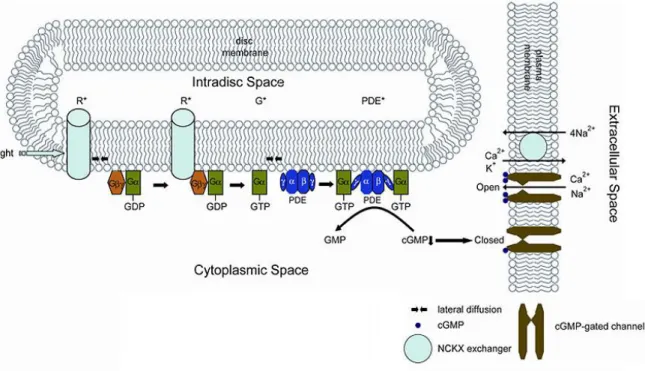
Figure 7: Schematic representation of rod phototransduction (modified from Webvision). R*: activated rhodopsin; G*: activated transducin
Rod phototransduction is a G-protein-signaling cascade. Rhodopsin is the G protein-coupled receptor, anchored in the outer segment discs and associated with the chromophore 11-cis retinal. Photon absorption by 11-cis retinal triggers its isomerization into all-trans retinal and leads to the activation of rhodopsin. Activated rhodospin binds the α-subunit of the heterotrimeric G protein transducin, encoded by GNAT1, catalyzing the exchange of guanosine 5'-triphosphate (GTP) for guanosine 5’-diphosphate (GDP). The activated α-subunit of transducin interacts with the two inhibitory γ-α-subunits of the cyclic guanosine 3’, 5’-monophosphate (cGMP) phosphodiesterase (PDE), encoded by PDE6A, PDE6B and PDE6G, respectively. The catalytic α- and ß-subunits of PDE are released and catalyze the
hydrolysis of cGMP. The consequent decrease in the cytoplasmic free concentration of cGMP leads to closure of the cGMP-gated cation channels located in the plasma membrane of rod outer segments. Consequently, the influx of cations into rod outer segments is inhibited, resulting in their hyperpolarization. During recovery from the photoresponse, transducin is deactivated by hydrolysis of bound GTP, allowing the inhibitory γ-subunits of PDE to rapidly re-inhibit the α- and ß-subunits. Rhodopsin is also deactivated and the all-trans retinal is recycled by RPE cells. In darkness, cGMP-gated cation channels are open and mediate the influx of cations (primarily Na+ but also Ca²+) into the cell (the so-called “dark current”) (14). Sodium ions are actively expelled by a Na/K-adenosine triphosphatase (ATPase) whereas a Na/Ca²-K exchanger, SLC24A1 in rods and SLC24A2 in cones (15), balances the Ca2+ current in photoreceptor outer segments.
d. Glutamate release
In the synaptic terminal of photoreceptors, light stimulus is finally transformed into a biochemical signal. Photoreceptors use the neurotransmitter glutamate to transmit the visual signal to the second order neurons of the retina. Glutamate release at the photoreceptor synapse is controlled by Ca2+ currents and requires a Ca2+ channel (13). Photoreceptors specifically express CACNA1F, which is the α1-subunit of a voltage-dependent L-type Ca2+ channel. This subunit forms the pore of a heteromultimeric protein complex, which transmits the calcium influx across the synaptic membrane. Auxiliary subunits ß, γ and α2δ, the last one being encoded by CACNA2D4, modulate calcium currents and are involved in the correct localization and assembly of the complex at the synaptic membrane. Moreover, CABP4 is a Ca2+ binding protein that is associated with CACNA1F for its modulation. In darkness, photoreceptors’ membrane potential is around -30 mV. CACNA1F is in an open conformation and calcium influx triggers a continuous release of glutamate in the synaptic cleft. Conversely, when the phototransduction cascade is initiated by light, photoreceptors hyperpolarized and glutamate release is reduced (Figure 8).
Figure 8: Schematic drawing of the molecular pathways at the first visual synapse between photoreceptors and ON-BCs without considering LRIT3 (adapted from (16))
e. Photoreceptor synapses
Photoreceptors release glutamate at a specialized chemical synapse, the ribbon synapse, allowing a sustained neurotransmitter release at high rates (17). The ribbon is a large electron-dense plate-like structure that is encountered by a large number of regularly aligned glutamate vesicles. One of the proteins present in the ribbon is ribeye. The number of ribbons differs between rod and cone synaptic terminals. The synaptic terminal of rod photoreceptors is small and is called the rod spherule. It usually contains only one ribbon (Figure 9). The synaptic terminal of cone photoreceptors is larger than the rod terminal and is called the cone pedicle. It may contain between 20 and 42 ribbons (18) (Figure 10).
Figure 9: Organization of the rod spherule (modified from Webvision). Electron micrograph (left) and schematic representation (right) of a rod spherule. The presynaptic ribbon is opposed to the invaginating axons of horizontal cells (HC, yellow) and dendrites of rod bipolar cells (rb, orange)
Figure 10: Organization of the cone pedicle (adapted from (18)). (A) Schematic drawing of a cone pedicle in cross-section. Four presynaptic ribbons flanked by synaptic vesicles and four triads are shown. Invaginating dendrites of horizontal cells (medium gray) form the lateral elements, and invaginating dendrites of cone ON-BCs (light gray) form the central elements of the triads. Cone OFF-BCs dendrites (dark gray) make flat contacts at the cone pedicle base. (B) Reconstruction of the horizontal view of a cone pedicle. The short black lines represent the ribbons. Invaginating cone ON-BC dendrites (light gray) and horizontal cell dendrites (darker gray) form the 40 triads associated with the ribbons. Flat contacts are not shown. (C) Electron micrograph of a vertical section through the synaptic complex of a cone pedicle base. The upper third of the micrograph shows the cone pedicle filled with vesicles. A typical triad containing a presynaptic ribbon (arrowhead), two lateral horizontal cell processes (“H”), and one invaginating bipolar cell dendrite (star) is present in the upper left part. A flat (basal) contact is indicated by an asterisk
Photoreceptor synaptic terminals end in the OPL where they synapse with BCs, the second order neurons of the retina. It is also at this level that ON- and OFF-pathways originate as the two major parallel pathways of the visual system (19). These two distinct pathways extend from the retina to the visual cortex.
2. ON pathways
a. Different subtypes of ON-BCs and their proximal synapse
The term “ON-BCs” comes from the fact that this type of BC depolarizes at the switch from dark to light conditions. This sign-inverting synapse between photoreceptors and ON-BCs exists because of the expression of the metabotropic glutamate receptor 6 (GRM6/mGluR6), which initiates the G protein-signaling cascade, at the dendritic tips of ON-BCs (20-22). In mouse, there are six subtypes of ON-BCs including rod BCs (23) (Figure 11). ON-BCs synapse with photoreceptors in a particular orientation named a triad. One dendrite of one ON-BC invaginates the rod spherule and the cone pedicle in line with a ribbon. Two dendrites of horizontal cells invaginate the photoreceptor terminal laterally to the ON-BC dendrite (24) (Figure 9, Figure 10).
Figure 11: The different subtypes of BCs in mouse retina (adapted from (23)). RBC: rod BCs; IPL: inner plexiform layer
b. The mGluR6 signaling cascade at the ON-BC dendritic tip
As described above, photoreceptors have a resting potential of -30 mV in the dark, continuously releasing glutamate at the ribbon synapse (25). mGluR6 is a G protein-coupled receptor that binds glutamate (20-22) at the dendritic tips of ON-BCs (Figure 8). Following this binding event, mGluR6 catalyses the exchange of GTP for GDP on the splice variant 1 of the α-subunit of its G protein, Go, which dissociates from ßγ-subunits (26-28). Gß3 is proposed to be the ß-subunit and Gγ13 is proposed to be the γ-subunit of this heterotrimeric G-protein (29-31). At the end of the cascade, activated Go inhibits the closure of the transient receptor potential melastatin 1 (TRPM1) cation channel (32-34). A glycosylphosphatidylinositol (GPI)-anchored protein, NYX, has been demonstrated to be essential for the correct localization of TRPM1 at the dendritic tip of ON-BCs (35). Upon light stimulus, photoreceptor glutamate release drops, the G protein-signaling cascade is deactivated, and TRPM1 opens, leading to an influx of cations and to the depolarization of ON-BCs.
It is hypothesized that the Go protein directly acts on TRPM1 (36). According to this hypothesis, both α- and βγ-subunits would bind TRPM1, with the βγ-subunits at the N-terminus and the α-subunit at both the N- and C-termini. When the Go protein is activated, Goα1-GTPwould dissociate from Gß3γ13 at the N-terminus of TRPM1 and would bind the C-terminus of TRPM1, inducing a conformational change of TRPM1 and leading to its closure. When the Go protein is deactivated, Goα1-GDPwould swing from C- to N-terminus of TRPM1 to bind Gß3γ13, inducing a conformational change of TRPM1, leading to its opening (36). The Go protein is able to naturally deactivate, but at a rate that is incompatible with proper visual signal transmission (37). Thus the assistance of regulator of G protein signaling (RGS) proteins of the R7 group is required for the rapid hydrolysis of GTP. At the ON-BC dendritic
tips, these RGS proteins are RGS7 and RGS11 (38-40). In mouse retina, RGS7 and RGS11 are in excess compared to mGluR6, indicating that the deactivation of the G-protein cascade is not a rate-limiting step in generation of the depolarizing response (41).
These RGS proteins contain four distinct structural domains and form heterotrimeric complexes with two binding partners (42). The catalytic domain, also called guanosine 5'-triphosphatase activating protein (GAP), is located at the C-terminus of the molecule and is responsible for the stimulation of GTP hydrolysis on Goα1. The second RGS protein domain, known as the G protein gamma-like domain (GGL), is involved in an interaction with a specific ß-subunit of G protein named Gß5 (40, 43, 44). The Disheveled, Egl-10, Pleckstrin (DEP) and the DEP helical extension (DHEX) domains are located at the N-terminus. These domains are necessary for the interaction of RGS7 and RGS11 with membrane proteins in order to keep them in close proximity to the plasma membrane of the dendritic tips of ON-BCs. Two different anchored proteins have been described at the ON-BC dendritic tips: RGS9 anchored protein (R9AP) and GPR179. R9AP is responsible for the anchoring of RGS11, forming a RGS11/Gß5/R9AP complex (44, 45). GPR179 is responsible for the anchoring of RGS7, forming a RGS7/Gß5/GPR179 complex (46). GPR179 is also responsible for the anchoring of R9AP and therefore, indirectly, for the anchoring of RGS11 (47). However, since GPR179 is a G protein-coupled receptor and because it interacts with mGluR6 (48), it may have another function in addition to the mGluR6 signaling cascade regulation (e.g as a co-receptor) (49).
c. The distal synapses of ON-BCs and ON-RGCs
The mammalian IPL is subdivided into five strata of equal thickness. Between the second and third strata is the boundary between the OFF-sublamina and the ON-sublamina (50) (Figure 11). Axons of ON-BCs end in the inferior part of the IPL, in the ON-sublamina, where they synapse with their specific third order neurons of the retina, the ON-RGCs. They also synapse with ON/OFF-RGCs. ON-RGCs have an increased spiking activity at the light onset (51). Only cone ON-BCs axons directly contact ON-RGCs. Rod BCs first synapse with a subtype of amacrine cells, AII amacrine cells, which in turn form electrical synapses onto the axon terminals of cone ON-BCs (52). Alternative routes for rod pathways have recently been demonstrated including one route through gap junctions that exist between rod spherules and cone pedicles (53, 54) (Figure 12).
Figure 12: Rod and cone pathways in the mammalian retina (adapted from (55)). There are five different rod pathways: 1) rodsrod BCsAII amacrine cellscone ON-BCsON-RGCs; 2) rodsrod BCsAII amacrine cellscone BCsRGCs; 3) rodsconescone ON-BCsON-RGCs; 4) rodsconescone OFF-BCsOFF-RGCs; 5) rodscone cone OFF-BCsOFF-RGCs. There are two different cone pathways: 1) conescone ON-BCsON-RGCs; 2) conescone OFF-BCsOFF-RGCs. OS/IS: outer segments/inner segments
3. OFF pathways
a. Different subtypes of OFF-BCs and their proximal synapse
The name “OFF-BCs” comes from the fact that this type of BC is inhibited by light. This sign-conserving synapse between photoreceptors and OFF-BCs exists because of the expression of ionotropic glutamate receptors (iGluRs) that form integral and non-selective cation channels at the dendritic tips of OFF-BCs (56). In mice, there are five subtypes of OFF-BCs that contact mainly cones (23) but it has been shown that type 3a, type 3b and type 4 OFF-BCs also contact rods (57, 58) (Figure 11). OFF-BCs synapse with photoreceptors by forming flat contacts (Figure 10).
b. Ionotropic glutamate receptors
In the dark, photoreceptors have a resting potential of -30 mV and continuously release glutamate at the level of the ribbon synapse (59). This means that glutamate is not directly released in immediate proximity of OFF-BC dendrites, but rather that it spills over ribbon synapses and diffuses towards the dendritic tips of OFF-BCs, which express iGluRs (25, 60). Two different families of iGluRs are present at the dendritic tips of OFF-BCs: AMPA (α-amino-3-hydroxy-5-methyl-4-isoxazole propionic acid) receptors (GluR1-4) (61) and kainate (2-carboxy-3-carboxymethyl-4-iso-propenyle-pyrrolidine) receptors (GluR5 and KA2) (62, 63). They form heteromeric complexes and act as integral, non-selective cation channels (56). Channels open in response to glutamate binding, leading to OFF-BC depolarization. It has
functionally and anatomically been demonstrated that OFF-BCs express distinct types of dendritic iGluRs in the mouse retina (64, 65) (Figure 13). Moreover, kainate receptors have been shown to mediate transient responses whereas both AMPA and kainate receptors contribute in sustained OFF-BC subtypes (65).
Figure 13: Patterns of iGluRs expressed by the different subtypes of OFF-BCs (adapted from (64)). GluA1=GluR1; GluK1=GluR5; n.d: not determined
c. The distal synapse of OFF-BCs and OFF-RGCs
Axons of OFF-BCs end in the superior part of the IPL, in the OFF-sublamina, where they synapse with their specific third order neurons of the retina, the OFF-RGCs. They also synapse with ON/OFF-RGCs. OFF-RGCs have an increased spiking activity at the light offset (51). Only OFF-BC axons directly contact OFF-RGCs. Rod BCs first synapse with AII amacrine cells, which in turn form inhibitory chemical synapses onto the axon terminals of cone OFF-BCs (52). A third rod-driven OFF-pathway is through gap junctions that exist between rod spherules and cone pedicles (53, 54) (Figure 12).
4. Receptive fields of RGCs
The receptive field of an RGC may be considered as the portion of the visual field in which light stimuli evoke responses in a ganglion cell (51). It corresponds to all the photoreceptors that connect (indirectly) an RGC. The receptive field of an RGC is subdivided into two concentric regions, the center and the surround. Two major types of ganglion cells are thus described: surround and OFF-center/ON-surround RGCs. ON-center/OFF-surround RGCs increase their firing frequency when a spot of light is presented within the center of their receptive field and when the surround remains in the dark. On the contrary, a light stimulus presented in the surround region inhibits the cells’ response at light onset but increases the cells’ response at light offset (Figure 14). OFF-center/ON-surround RGCs have
an opposite behavior. OFF-center/ON-surround RGCs increase their firing frequency when a light stimulus is presented in the surround region of their receptive field and when the center remains in the dark. On the contrary, a spot of light presented within the center inhibits the cells’ response at light onset but increases the cells’ response at light offset (Figure 14) (66). The center-surround organization of the receptive fields allows the RGCs to optimally respond to contrasts rather than only to absolute luminance.
Figure 14: The receptive fields of RGCs and their behavior (modified from: http://lecerveau.mcgill.ca). ON-center/OFF-surround RGCs increase their firing frequency when the light stimulus is presented at the center of their receptive field (left, top), whereas a light stimulus presented in the surround region inhibits the cells’ activity at light onset but increases the cells’ activity at light offset (left, middle and bottom). OFF-center/ON-surround RGCs increase their firing frequency when the light stimulus is presented in the surround of their receptive field (right, top), whereas a light stimulus presented in the center inhibits the cells’ activity at light onset but increases the cells’ activity at light offset (right, middle and bottom). The first dashed line represents light onset, and the second dashed line represents light offset
C. Diagnostic tools for retinal diseases: comparison between
human and mouse
In this part, I will develop only diagnostic tools that have been used in experiments performed during my thesis. Depending on the study, I will compare these tools in human and in mouse.
1. Visual acuity (VA)
Visual acuity (VA) represents the spatial resolving capacity of the visual system or, in simpler terms, the ability of the eye to see fine details. VA can be affected by different factors such as refractive errors and eye movement.
a. In human: Early Treatment Diabetic Retinopathy Study (ETDRS) chart
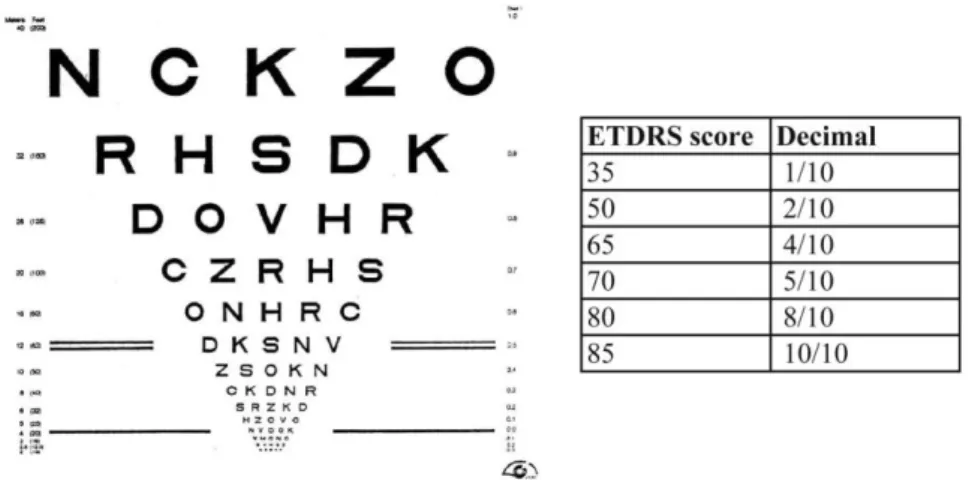
Figure 15: ETDRS chart and table showing ETDRS score with decimal conversion
The Early Treatment Diabetic Retinopathy Study (ETDRS) chart is one of the most commonly used test to evaluate the VA in humans. It is based on the recognition of optotypes, which may be letters or shapes. For this chart, the subject is placed 4 meters away from a sheet of paper covered with lines of letters with different sizes (biggest letters are on the top, smallest at the bottom) (Figure 15). The determination of VA is made based on the number of letters or shapes the subject can correctly identify. The ETDRS score is correlated to the VA expressed in the decimal form (Figure 15).
b. In mouse: the optomotor response
VA assessment using optotypes is not applicable for mice as they are not able to communicate. Thus, it was necessary to develop new tools to evaluate visual function in animals. It has been shown that the optomotor response allows assessment of all components of visual integration in mice in both scotopic (dark-adapted) and photopic (light-adapted) conditions (67). For this experiment, following dark or light adaptation, the mouse is placed in a rotating drum covered with vertical white and black stripes at various spatial frequencies (Figure 16). Normal mice are able to track the rotating stripes by moving their head whereas animals with altered vision cannot. The VA is determined based on the smallest spatial frequency for which the animal fails to follow the rotating drum.
Figure 16: Picture of the dispositive used for the optomotor test (adapted from (67))
2. Fundus examination
a. Funduscopy
Funduscopy refers to the inspection of the structures lying at the innermost part of the globe: the retina, retinal blood vessels, optic nerve head (disc), and (to a limited degree) the subjacent choroid (68). The patient is placed in front of an ophthalmoscope that illuminates the retina, using a magnifying lens to observe the fundus, preferably after pharmacological dilatation of the pupil. The optic nerve head is a yellow-pink disc that is visually distinct from the surrounding retina, which is typically more red, brown, or orange in color and contains photoreceptors. The central retinal artery and vein emerge from the optic nerve and immediately bifurcate into superior and inferior branches, which run parallel with the retinal surface. Arteries appear smaller in diameter and lighter in color than veins. In humans, the macula is located temporally relative to the optic disc (Figure 17).
Figure 17: Normal human (left) and mouse (right) fundus (adapted from (69) and (70)). A, artery; V, vein; arrow, disc; asterisk, central retina
b. Fundus autofluorescence (FAF)
RPE cells play an essential role in photoreceptor survival. RPE cells phagocytose the distal part of photoreceptor outer segments, stimulating their continuous renewal. Lipofuscin (LF) is an autofluorescent pigment that normally accumulates in the lysosomes of RPE cells as a by-product of the degradation of photoreceptor outer segments (71); it can be visualized by the fundus autofluorescence (FAF) of the retina (Figure 18). LF levels increase with age (72). FAF images can be obtained through a dilated pupil with a scanning laser ophthalmoscope (SLO) with an exciting 488 nm-laser and a > 500 nm barrier filter.
Figure 18: Normal human (left) and mouse (right) FAF images (modified from Macula specialists and adapted from (73))
3. Structure of the retina: spectral domain optical coherence
tomography (SD-OCT)
Spectral domain optical coherence tomography (SD-OCT) is a fast non-invasive method that allows the production of high-resolution cross-sectional images of the human and mouse retina. Scans of transverse sections are used to morphologically study and measure the layers of the retina and to dissect the outer retina (Figure 19). The retinal layers include: RPE/Bruch’s membrane (RPE/BM) complex, the hyper reflexive band corresponding to the interdigitation zone (IZ), the photoreceptor outer segments (OS), the ellipsoid zone (EZ), the myoid zone (MZ), the external limiting membrane (ELM), ONL, OPL, INL and a complex comprising IPL, GCL and NFL (IPL+GCL+NFL). The morphology and/or thickness of some layers can be locally or globally affected in retinal diseases (71, 74), so the SD-OCT is a useful tool with which to analyze these changes over time.
Figure 19: Normal human (left) and mouse (right) SD-OCT scans (courtesy from Thomas Pugliese, MD, Centre d'Investigation Clinique des Quinze-Vingts, Paris, France and adapted from (75)). RPE/BM, retinal pigmentary ephithelium/Bruch’s membrane; IZ: interdigitation zone; OS, outer segments; EZ: ellipsoid zone; MZ: myoid zone; ELM, external limiting membrane; ONL, outer nuclear layer; OPL, outer plexiform layer; INL, inner nuclear layer; IPL+GCL+NFL, inner plexiform layer + ganglion cell layer + nerve fiber layer
4. Function of the retina
a. Full-field electroretinogram (ERG)
The full-field electroretinogram (ERG) records the light-induced electrical activity of the retina in response to standardized flashes and is used to assess overall retinal function. The specific parameter that is recorded by ERG is the difference of electrical potential between the retina and the cornea on which an electrode is placed (active electrode). For humans, standardized international recommendations exist for ERG testing (76), but similar recommendations are not available for mice. In humans, after at least 20 min of dark-adaptation to be in scotopic conditions, eyes are submitted to a first flash of 0.01 cd.s/m² (dark-adapted 0.01 ERG) to elicit a rod-driven ERG trace. Then, a second and a third flash of 3.0 (dark-adapted 3.0 ERG) and 10 cd.s/m² (dark-adapted 10 ERG), respectively, are generated to obtain mixed rod-cone-driven ERG traces dominated by the rods which outnumber the cones. The subject is then light-adapted for at least 10 min with a 30 cd/m² background light to be in photopic conditions in which case the rods are saturated. A first flash of 3.0 cd.s/m² (light-adapted 3.0 ERG) elicits a cone-driven ERG trace. Finally, a 30 Hz-flicker (light-adapted 30 Hz Hz-flicker) is applied. The same types of ERG backgrounds and stimuli can be applied to mice with some adaptations (77).
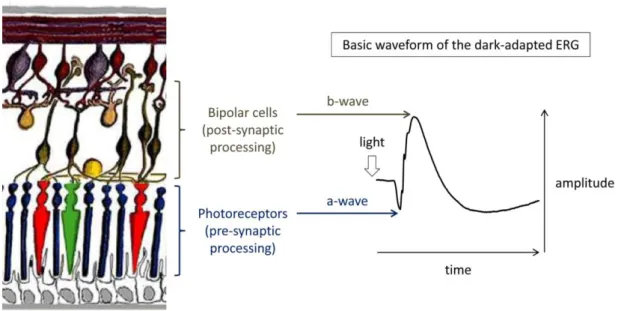
The resulting ERG traces have two major components reflecting the retinal physiology: (1) the a-wave, mainly corresponding to the hyperpolarization of photoreceptors and OFF-BCs, and (2) the b-wave, mainly corresponding to the depolarization of ON-BCs in response to light onset that is counterbalanced by OFF-BCs responses (Figure 20). Further detail about the cellular origins of each ERG wave under different background and flash intensity
conditions is shown in Table 1. ERG study results include considerations of the morphology, implicit time, and amplitude of both a- and b-wave.
Figure 20: Origin of the a- and b-waves in the dark-adapted ERG. A schematic representation of the retina (left, from Webvision) and a representative ERG trace from the mixed rod-cone response (right) are shown. In scotopic conditions, the a-wave originates mainly from the hyperpolarization of rods and the b-wave originates mainly from the depolarization of rod BCs in response to light. Implicit times are measured from the time of the flash to the trough or the peak of the corresponding wave. The amplitude of the a-wave is measured from the baseline to the trough of the wave whereas amplitude of the b-wave is measured from the trough of the a-wave to the peak of the b-wave Table 1: Physiological cellular origins of ERG waves under different testing conditions (adapted from (76))
ERG test Main physiological generator(s)
Dark-adapted 0.01 ERG - no a-wave - b-wave: rod BCs
Dark-adapted 3.0 ERG - a-wave: (mainly rods) with a minor contribution of cone OFF-BCs
- b-wave: ON-BCs (mainly rod-driven) slightly counterbalanced by cone OFF-BCs Dark-adapted 10 ERG - a-wave: (mainly rods) with a minor contribution of cone OFF-BCs
- b-wave: ON-BCs (mainly rod-driven) slightly counterbalanced by cone OFF-BCs Light-adapted 3.0 ERG - a-wave: cones + cone OFF-BCs
- b-wave: cone ON-BCs counterbalanced by cone OFF-BCs Light-adapted 30 Hz flicker - cone-driven ON- and OFF-pathways
In humans, it is also possible to separately assess the ON- and OFF-pathways of the cone visual system. In photopic conditions, when a brief flash is used, the b-wave illustrates both the depolarization of cone ON-BCs counterbalanced by cone OFF-BCs. By using a long-duration flash (> 100 ms), a positive d-wave is generated, reflecting the retina’s response to light cessation and the depolarization of cone OFF-BCs at the light offset (78) (Figure 21). Several studies describe attempts to separately assess the ON- and OFF-pathways of the cone visual system in mice but none of these protocols is currently used in routine (79-83).
Figure 21: Normal human photopic ERG duration series for 10- to 300-ms flashes to isolate the d-wave (courtesy from Graham Holder, PhD, UCL Institute of Ophthalmology, UK Moorfields Eye Hospital, London, UK)
b. Multi-electrode array (MEA)
In mice, ON- and OFF-pathways of the cone visual system may be evaluated by multi-electrode array (MEA), which records light-evoked spiking activity from RGCs from ex vivo isolated flat-mounted retina (84) (Figure 22). A flat-mounted retina is pressed against a MEA composed of 256 electrodes and is continuously perfused with a warmed oxygenated medium to keep it alive throughout the experiment. Light-evoked spiking activity from RGCs is elicited by applying full-field light stimuli of different intensities and wavelengths. Interpretation and analysis of the MEA results includes consideration of the morphology of the responses, their maximum firing frequency, and the time at which the firing frequency is maximal.
Figure 22: Peristimulus time histogram representing the average response to a full-field flash (adapted from (84)). The first dashed line represents light onset, and the second dashed line represents light offset. ON- and ON/OFF RGCs spike at the light onset whereas OFF- and ON/OFF RGCs spike at the light offset
II. Congenital stationary night blindness (CSNB)
The first steps in vision occur when rod and cone photoreceptors transform light into a biochemical signal, which is subsequently processed by the retina. The initial steps occur in photoreceptors (the phototransduction cascade), and are well understood, whereas the process of signal transmission from the photoreceptors to their postsynaptic neurons (e.g. bipolar cells) remains to be further characterized. Our understanding about the phototransduction cascade was obtained by studying the molecular pathophysiology of retinal diseases such as retinitis pigmentosa and Leber congenital amaurosis, two disorders resulting from mutations in specific components of the phototransduction pathway. On the other hand, congenital stationary night blindness (CSNB) is a useful model to characterize the signal transmission cascade from the photoreceptors to postsynaptic neurons. CSNB is a clinically and genetically heterogeneous group of retinal disorders caused by mutations in genes implicated in the phototransduction cascade or in signaling from photoreceptors to adjacent bipolar cells (13, 16). These disorders are non-progressive and non-degenerative, and unlike many other retinal disorders, they are present at the time of birth. The common clinical sign in CSNB patients is either night or dim-light vision disturbance or delayed dark adaptation (Figure 23). The true prevalence of CSNB is unknown (and probably underestimated) because the night vision disturbance may be overlooked in a well-lit urban environment. In addition, CSNB is a clinical diagnosis and requires a clinical examination with specialized equipment that is only available in some hospitals, so many affected individuals may not be identified.
Figure 23: Normal vision (left and right) compared with what an individual suffering from CSNB sees in dim-light conditions (center) (from Retina Suisse)
A. Different forms of CSNB
CSNB can be subdivided into different types according to the pattern of clinical signs present in affected patients, but, in all cases, the full-field ERG is critical for precise diagnosis.
1. The Riggs-type of CSNB
The Riggs-type of CSNB [MIM 610445, MIM 610444, MIM 616389, MIM 163500, MIM 613830] is the less common type of CSNB; only a few cases have been reported. Individuals affected with this type of CSNB display specific ERG abnormalities, as first reported by Riggs (85). These patients exhibit generalized rod photoreceptor dysfunction, with dark-adapted responses being dominated by cone responses, which are normal. Therefore, the a-wave amplitude is reduced in response to a bright flash under dark adaptation, with a possible additional reduction of the b/a ratio and an electronegative waveform due to the photopic hill phenomenon that is characteristic of the cone pathway function (86). Photopic ERG responses are preserved due to the normal cone system function (Figure 24). These CSNB patients exhibit a relatively mild phenotype as compared to CSNB patients affected with the Schubert-Bornschein-type of CSNB. They report night blindness but have normal visual acuity, normal color vision, normal fundus appearance, and no sign of high myopia, nystagmus or strabismus. They have elevated final thresholds on dark-adaptometry, which is compatible with a prolonged dark adaptation phase with normal daylight vision (16).
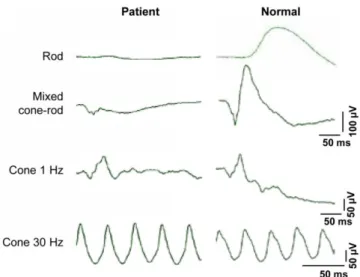
Figure 24: Representative ERG traces from a patient suffering from the Riggs-type of CSNB (left) compared to a non-affected individual (right) (adapted from (87))
2. The Schubert-Bornschein-type of CSNB
Most CSNB patients are affected by the Schubert-Bornschein subtype, and they exhibit characteristic ERG abnormalities as first described by Schubert and Bornschein. In this CSNB subtype, the b-wave amplitude is smaller than the a-wave (which is globally normal) in the dark-adapted bright flash condition (88). This electronegative waveform can be subdivided in two subtypes, complete (c)CSNB [MIM 310500, MIM 257270, MIM 613216, MIM 614565, MIM 615058] and incomplete (ic)CSNB [MIM 300071], characterized by ON- or both ON- and OFF-pathway dysfunction (89, 90), respectively. Patients suffering from the Schubert-Bornschein-type of CSNB display a more severe phenotype as compared to patients affected with the Riggs-type, and they often exhibit additional ocular abnormalities such as reduced visual acuity, myopia, nystagmus, photophobia and strabismus (13, 16). The Schubert-Bornschein-type of CSNB results from a post-phototransduction defect and affecting signal transmission between photoreceptors and BCs.
a. Incomplete CSNB (icCSNB)
icCSNB results from both ON- and OFF-pathway dysfunction. The ERG b-wave is present in response to the dark-adapted 0.01 ERG, but it is of subnormal amplitude, giving the term “incomplete CSNB”. In response to a scotopic brighter flash, the a-wave is normal, confirming normal rod phototransduction, but the b-wave is severely reduced, giving an electronegative waveform (89). Photopic responses are also affected. The light-adapted single flash reveals a reduced b/a ratio. The light-adapted 30 Hz-flicker is markedly subnormal with reduced amplitude and implicit time shift, with most having a distinctive bifid peak. Finally, the photopic long-duration flash confirms both ON- and OFF-pathway defects (Figure 25). Patients suffering from icCSNB may present with little or no night vision disturbances, as only 54% of icCSNB patients report night blindness that actually does impact their daily life (91, 92). Patients with icCSNB have variable degrees of refractive error, from myopia to hyperopia, with a median refractive error of -4.8 D and various degrees of nystagmus and strabismus. Fifty three percent of icCSNB patients report photophobia. In addition, icCSNB patients generally have low visual acuity (median of 20/60) and variable color vision defects despite having normal visual fields; these daylight symptoms are consistent with the involvement of both cone-driven ON- and OFF-pathways in this condition. The fundus examination of icCSNB patients is usually normal apart from myopic changes. However,
changes in retinal structure and thinning of the retina have been reported in icCSNB patients as compared to patients with isolated myopia (93, 94).
Figure 25: Representative ERG traces of individuals with cCSNB (top) and icCSNB (middle) as compared to a normal subject (bottom) (adapted from (16)). DA 0.01, dark-adapted 0.01 ERG; DA 10.0, dark-adapted 10 ERG; LA 3.0 30Hz, light-adapted 30 Hz-flicker ERG; LA 3.0, light-adapted 3.0 ERG; ON-OFF, photopic long-duration flash
b. Complete CSNB (cCSNB)
cCSNB results from ON-pathway dysfunction. In this form of CSNB, the ERG b-wave is not detectable in response to the dark-adapted 0.01 ERG, giving the term “complete CSNB”. In response to a scotopic brighter flash, the a-wave is normal, confirming normal rod phototransduction, but the b-wave is severely reduced, producing an electronegative waveform (89). Under photopic conditions, the single flash response frequently has a normal a-wave amplitude, but with a square shape; the waveform has a sharply rising b-wave and a mildly reduced b/a ratio. The light-adapted 30 Hz-flicker ERG response is of normal amplitude but may have a flattened trough and mild implicit time shift. Finally, the photopic long-duration flash confirms the isolated ON-pathway defect with a normal OFF-response (Figure 25). Patients suffering from cCSNB always present with night vision disturbances (91, 92), and they have variable degrees of myopia (median refractive error of -7.4 D) and nystagmus. Strabismus is also frequently reported. Visual acuity in cCSNB patients (median of 20/40) is generally superior to that of icCSNB patients, and they usually have normal color vision and visual fields. The fundus examination is usually normal apart from myopic changes. However, retinal thinning outside of the foveal region with preservation of the outer
retina has been reported in three cCSNB patients, although the authors do not comment on whether or not the same findings were evaluated in a myopic population (95).
B. CSNB genes and mutations
1. Gene identification strategies
Disease causing variants in many genes associated with CSNB have been identified through classical linkage approaches (96-101) or through candidate gene approaches by comparing the human phenotype to similar phenotypes observed in knock-out or naturally occurring animal models (102-110). One limitation of the linkage approach is the requirement to examine large families. Techniques using massively parallel sequencing of human exons implicated in inherited retinal disorders (targeted sequencing) and all human exons (whole exome sequencing, WES), have successfully identified disease causing variants in known and novel genes underlying many heterogeneous diseases (111, 112), including CSNB (111, 113). WES is an unbiased method to identify the gene defect in families with only few family members available, but data from unaffected family members and proper filtering procedures are crucial to the rapid identification of “the” disease-causing variant in each CSNB family. A first filtering step is performed based on the mode of inheritance and the frequency of the identified genetic variants in the general population. Priorities are then given to frameshift, nonsense, missense and splice site variants as well as in-frame insertions or deletions. Identified amino acid substitutions are evaluated with respect to the evolutionary conservation at that position, as well as pathogenicity predictions and in-silico splice-site predictions. The expression of candidate genes of interest in the eye and retina is evaluated by use of publically available transcriptomic databases. In addition, literature searches are performed for each candidate gene to find further evidence of putative pathogenicity and/or retinal function based on animal models, metabolic pathways, or other supporting experimental of clinical data, including 3-D modeling. The most likely disease causing variants are confirmed by Sanger sequencing and co-segregation analyses. Further patients are screened for mutations in the same gene.
2. Riggs-type of CSNB
The Riggs-type of CSNB has been associated with disease causing variants in RHO [MIM 180380] (110), GNAT1 [MIM 139330] (114), PDE6B [MIM 180072] (96, 115) and SLC24A1