Publisher’s version / Version de l'éditeur:
Lighting Research and Technology, 10, 1, pp. 19-27, 1978
READ THESE TERMS AND CONDITIONS CAREFULLY BEFORE USING THIS WEBSITE. https://nrc-publications.canada.ca/eng/copyright
Vous avez des questions? Nous pouvons vous aider. Pour communiquer directement avec un auteur, consultez la première page de la revue dans laquelle son article a été publié afin de trouver ses coordonnées. Si vous n’arrivez pas à les repérer, communiquez avec nous à [email protected].
Questions? Contact the NRC Publications Archive team at
[email protected]. If you wish to email the authors directly, please see the first page of the publication for their contact information.
NRC Publications Archive
Archives des publications du CNRC
This publication could be one of several versions: author’s original, accepted manuscript or the publisher’s version. / La version de cette publication peut être l’une des suivantes : la version prépublication de l’auteur, la version acceptée du manuscrit ou la version de l’éditeur.
Access and use of this website and the material on it are subject to the Terms and Conditions set forth at
The CIE visual performance system
Levy, A. W.
https://publications-cnrc.canada.ca/fra/droits
L’accès à ce site Web et l’utilisation de son contenu sont assujettis aux conditions présentées dans le site
LISEZ CES CONDITIONS ATTENTIVEMENT AVANT D’UTILISER CE SITE WEB.
NRC Publications Record / Notice d'Archives des publications de CNRC:
https://nrc-publications.canada.ca/eng/view/object/?id=e2ce208b-6d03-4192-be5a-c88c635d014c https://publications-cnrc.canada.ca/fra/voir/objet/?id=e2ce208b-6d03-4192-be5a-c88c635d014c" *- i-, I
H1,
U2\4
\\r
,7Sb
National Research
Conseil national
t. d
I
+
Council
Canada
de
recherches Canada
THE CIE VISUAL PERFORMANCE SYSTEM
AKALYZED-.-.
I.BUlLDlNG
RESEARCH
-
LIBRARY
-
SEP
12
l978
NATKINAL R C S A l C H COUNCILReprinted
from
Lighting Research and Technology
VoL
10,
No.
1, 1978
p* 19
27
DBR
Paper
No. 786
Division of Building Research
SOMMAIRE
La Commission internationale dVEclairage (CIE) a dEveloppE un systeme dlGvaluation des aspects du rendement visuel de l'gclairage. Le systsme et ses concepts sont pr6sentSs en rEfGrant particulierement 2 1'Economie d'gnergie par l'gclairage. On y discute de certains problsmes impliquSs dans l'application du systsme CIE et des donnEes ngcessaires avant qu'une diffusion massive soit possible.
Summary The International Commission on Illumination (CIE) has developed a s y s t e m f o r evaluating the visual performance a s p e c t s of lighting. The system and i t s concepts a r e presented with special reference to lighting energy conservation. Some of the problems involved in the application of the CIE s y s t e m and the data required before widespread application i s possible a r e discussed.
The
CIE visual
performance system
A. W. LEVY
1 Introduction
In an e r a of energy conservation i t i s vital that light- ing energy should b e used efficiently and effectively. Efficiency can be achieved by suitable control, including automatic dimming techniques, sensible switching a r r a n g e m e n t s and efficient s o u r c e s and luminaires. Effectiveness can b e pursued in t e r m s of visibility, resulting in the provision of just- adequate illuminance to meet a l l the visual require- ments of specific activities. Adequate illuminance ini&hs context i s that which i s sufficient f o r a d e s i r e d level of visual performance.
It i s the purpose of this paper to d e s c r i b e the visual performance approach to effective lighting, a s out- lined by the International Commission on Illumina- tion (CIE).1,2 Hereafter this approach will b e termed the Blackvrell system after i t s originator, H. R. Blackwell of Ohio State University. P r o b l e m s associated with the practical application of the Blackwell s y s t e m will b e discussed in an attempt to evaluate the usefulness of the visual performance approach f o r lighting energy conservation program- m e s and, m o r e generally, in specifying recommended illuminances. CIE publications d e s c r i b e a f r a m e - work of methods that enable the illuminating engineer to evaluate the m e r i t s , of different lighting s y s t e m s in t e r m s of visual performance f o r dif- . f e r e n t tasks and different illuminances.
A visual performance approach to lighting deploys both human o b s e r v e r s and photometric equipment to establish psychophysical relations. Such an approach to lighting recommendations and standards is a s e n - sible and scientific one but it i s not a simple proce- dure. In genera1,a.n o b s e r v e r ' s response to a visual signal will depend on t h r e e factors:
' ( a ) the 'photometry' of the lighting installation, i.e.
i t s intensity, directionality etc.;
( b ) the physiology of the visual s y s t e m , e.g. accom- mociation, fixation, adaptation; and
( c ) the mental condition of the observer, including
such f a c t o r s a s intelligence, motivation, pre-informa- tion, training, arousal and central nervous fatigue. The f i r s t two f a c t o r s a r e much m o r e c l e a r l y under- stood than the third. Although i t recognizes the importance of the mental s t a t e of the o b s e r v e r , the Blackwell s y s t e m does not include this factor in the general framework of methods. It i s postulated that the mental s t a t e of the o b s e r v e r may affect the actual performance of t a s k s but h a s no d i r e c t effect on the performance potential of the visual mechanism. The various constituents of this factor, however, must b e controlled o r accounted f o r in visual performance experiments. This paper d e s c r i b e s the application of the s y s t e m to i n t e r i o r lighting f o r stationary two- dimensional tasks.
2 Contrast
F o r an object to b e perceived t h e r e must b e c o n t r a s t in either brightness o r colour between i t and i t s immediate background. F o r an achromatic task, the task contrast, C, can b e defined a s the r a t i o of luminance (objective brightness) difference between task detail, L,, and background L 2 , to the b a d g r o u n d luminance itself ( L z )
This definition p e r m i t s C to take any value f r m z e r o to infinity. In practice L, may b e the luminance of
s o m e detail of a printed ink l e t t e r o r symbol and L, the luminance of the white paper on which i t IS
printed. When the task detail r e ~ r e s e n t s a s m a l l a r e a s e e n against .a much l a r g e r uniform backgromd, the adaptation luminance of the eye is clearly L 2 , the baekground luminance. For the other extreme, con-
s i d e r a grating d equally spaced black and white b a r s of equal width. H e r e c o n t r a s t can b e defined as
D r Levy is with the Division of Building R e s e a r c h ,
where Lm, = luminance of white b a r s , Lmin =
National R e s e a r c h Cowncil of Canada, Ottawa. The
luminance of black b a r s , and L = average a v e r t a s k paper was f i r s t ~ e c e i v e d on 4 October and in revised a r e a = (L,,,
+
~ , ~ , ) / 2 f o r equal a r e a s of both f o r m on 25 November 1977.types of b a r , The adaptation luminance in this c a s e i s taken a s L; in other c a s e s the appropriate value of the adaptation luminance must be established empirically.
Adaptation luminance in this context i s extremely important. A value of c o n t r a s t alone i s insufficient to d e s c r i b e the visual difficulty of a task; the adaptation luminance must a l s o be ~ t a t e d . ~ The visual effect of a given task contrast will a l t e r with luminance. F o r example, the ability to s e e a task of luminance 100 cd/m2 on a background of 10 cd/m2 will be g r e a t e r than that of a task of 10 cd/m2 on a back- ground of 1 cd/m2. Although both t a s k s have identi-
cal contrast values (C = 9) the f o r m e r will be m o r e highly visible because the luminance a t which i t i s
.
seen i s g r e a t e r . ( F o r this r e a s o n , s o m e w o r k e r s u s e the difference ( L I - L 2 ) a s a m e a s u r e of contrast.In the example this yields values of C equal to 90 and 9, respectively. Nevertheless, these values do not reflect the subjective effect and r e f e r e n c e to the adaptation luminance m u s t still b e made).
3 Threshold contrast and c o n t r a s t sensitivity Visibility i s a word generally used to d e s c r i b e how well a s c e n e o r particular object can b e seen. In the Blackwell s y s t e m it takes a m o r e r e s t r i c t e d meaning related to visual performance (the t e r m 'visibility level' i s discussed in Section 6.2). F o r the present, however, the word is used in a generalized fashion associated with the perception of objects and visual details of interest.
Visibility a l s o depends on p a r a m e t e r s other than task c o n t r a s t and adaptation luminance; spatial pattern of luminances in the visual field and their magnitude, s i z e of task, task shape, exposure duration, age of o b s e r v e r , and information requirements a r e all important.
The Blackwell system i s useful in that the effect of these variables on visibility and visual performance may b e quantified by means of a s i ~ g l e - psychophysi- cal p a r a m e t e r , threshold contrast C. C a c t s a s a 'barometer' of task difficulty, increasing a s difficulty i n c r e a s e s owing to changes in task shape, information requirements etc. Threshold c o n t r a s t i s the value of contrast when luminance difference between detail and background i s s o s m a l l that detail is b a r e l y p e r - ceptible; 1.e. i t i s the minimum contrast that can be detected. A number of c r i t e r i a a r e suitable f o r threshold determination, but detection of p r e s e n c e i s b e s t f o r the visibility r e f e r e n c e task ( s e e Section 4).
In practice, the threshold condition is measured by t h e value of t h e stimulus f o r which the required r e s - ponse is 50% correct. F o r example, if a black dot against a uniform white background a t a given adapta- tion luminance can b e detected c o r r e c t l y in 50% of t r i a l s , the o b s e r v e r
is
a t his visibility threshold and the contrast between the dot and the background at the given adaptation luminance i s designated the threshold contrast. Justification f o r using the 50% c r i t e r i o n isthat frequency of detection ( c o r r e c t e d f o r r a t e of guessing) n e a r the threshold a s a function of i n c r e a s - ing stimulus intensity can b e fitted by a normal probability integral (Fig. I); it i s convenient, there- fore, to define the threshold condition a t a probability of 0.5. The reciprocal of threshold contrast is known a s contrast sensitivity, and h a s been chosen in the Blackwell s y s t e m a s the fundamental m e a s u r e of s e e - ing ability f o r a particular lighting situation.
Relative target contrast
Fig. 1 . Sample accuracy curve: response probabilitv data fitted by a normal ogive (reprinted from
Illum inating Engineering, June 1959, with permission).
4 RCS function
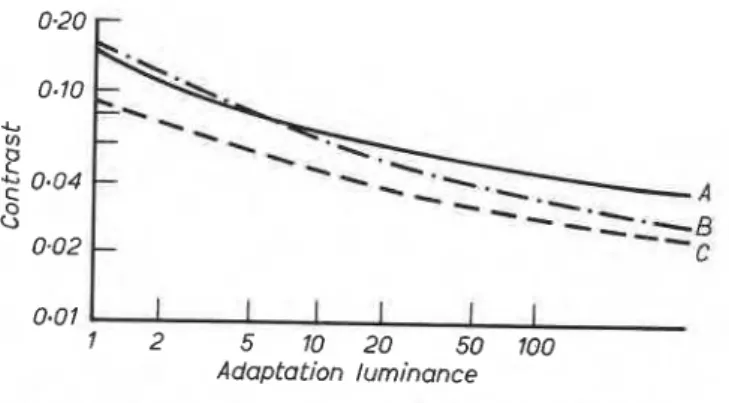
In general, the higher the light intensity ( o r lumi- nance) a t which the eye i s operating, the higher i t s contrast sensitivity, i.e. a s m a l l e r c o n t r a s t i s needed f o r detail to be visible. Typical c u r v e s of threshold contrast a s a function of luminance a r e illustrated in Fig. 2 . If contrast sensitivity instead of threshold contrast w e r e plotted on the ordinate, the curve would simply b e inverted. The interesting and important feature of these c u r v e s i s the flattening off a t higher luminances. This has important implications f o r energy conservation and will be discussed separately. In other experiments the relation between threshold contrast and adaptation luminance h a s been d e t e r - mined f o r different t a r g e t s i z e s , shapes, exposure durations and perceptual c r i t e r i a . The r e s u l t s
indicate that in all c a s e s t a s k s of low contrast r e q u i r e a higher luminance f o r equal visibility (Fig. 2). At low light levels a l a r g e contrast i s n e c e s s a r y f o r detail to b e visible, i.e. contrast sensitivity tends to zero. F u r t h e r , when the data obtained f r o m the v a r i - ous experiments a r e plotted on
a
double logarithmic grid they a r e found to b e approximately p a r a l l e l , especially in the photopic r a n g e (i.e., luminances inthe range of the horizon sky a t twilight to snow i n bright sunlight, s e e Fig. 2).
Variation in absolute values of threshold contrast among s e p a r a t e experiments m e r e l y r e f l e c t s the dif- ference in visibility of the variety of visual tasks
0.01
1 2 5 10 20 50 100 Adaptation luminance
Fig. 2. Tltreshold confrast relntions for the dis- crimimfion of detail (B) and detectios of presence (C)
of a 4' parallel-bar test obiecl compared w i t h that for the detection of a disc (A). Exposure time was 0.2 s. (Reprinted from Tlltsminnling En@neerinq, Jmuarv 1968, with permissz'orz).
5 Effectiveness of various lighting s y s t e m s
1 2 4 10 20 40 700 400 2000 10000 Reference luminance Icd/m21
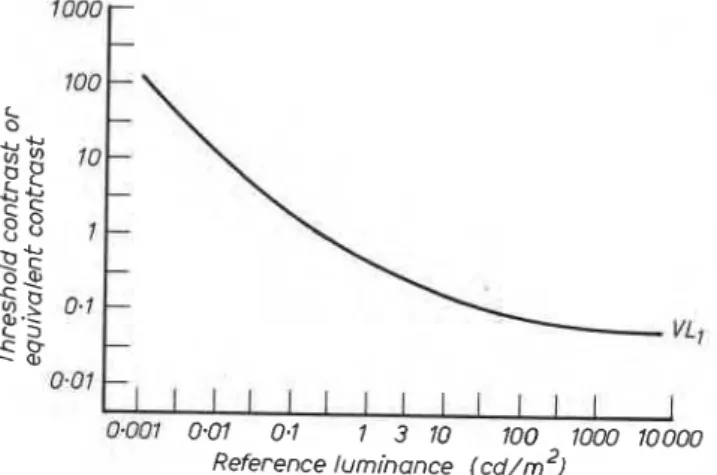
Fig. 3. Relative contrast sensitivitv reference function of luminance.
used. The fact that the c u r v e s a r e s o nearly parallel i s r a t h e r significant and leads to the production of a relative contrast sensitivity (RCS) reference function (Fig. 3 ) . It i s a reference curve of contrast sensitivity plotted against adaptation luminance normalized to a value of unity a t 100 cd/m2. It i s called a reference curve because i t i s obtained using a visual task, method of lighting, and o b s e r v e r c h a r a c t e r i s t i c s deliberately chosen a s reference standards.
Reference lighting was chosen that i s e a s y to specify and reproduce, integrating s p h e r e illumination where illuminance i s diffuse, unpolarized, and t h e r e i s a completely uniform luminance surrounding the task. The visibility reference task was a 4' luminous disc presented f o r 0 . 2 s exposure under r e f e r e n c e lighting conditions; the information criterion was detection of presence.
The reference population comprised approximately one hundred 20 to 30 year old o b s e r v e r s with normal vision. Choice of a 4' luminous disc a s the visibility r e f e r e n c e task was governed by the fact that i t gives absolute values of threshold contrast, which a r e a good average of the variety of visual t a s k s investi- gated. Fortunately, all t a s k s w e r e investigated under lighting conditions closely approximated by those of r e f e r e n c e lighting. This i s why all the c u r v e s in Fig. 2 can be normalized to fit the RCS r e f e r e n c e function.
The RCS reference function directly r e l a t e s seeing ability (measured in t e r m s of contrast sensitivity) to reference luminance. This function i s central to the Blackwell system. It demonstrates that the relative sensitivity of the eye to contrast i n c r e a s e s with luminance and i s independent to task s i z e , shape and exposure duration. Equally important, the shape of RCS reference curve happens to aid the illuminating engineer to conserve lighting energy. The law of diminishing r e t u r n s o p e r a t e s ( s e e Fig. 3). A s light levels a r e increased, t h e r e i s progressively s m a l l e r r e t u r n in t e r m s of visibility. F o r example, increasing the adaptation luminance by a factor of 10 f r o m 1 to 10 cd/m2 i n c r e a s e s the RCS value by 2.7; raising luminance f r o m 100 to 1000 cd/m2 only improves RCS by a factor of 1.4, little m o r e than half the i n c r e a s e obtained a t the lower luminance values. The usefulness of the RCS r e f e r e n c e function in this con- text will b e explored in m o r e detail in Section 5, where the f e a t u r e s of a lighting installation that d i r e c t l y affect contrast sensitivity a r e discussed.
The Blackwell system determines the effectiveness of different lighting s y s t e m s in t e r m s of their ability to reveal contrast, which can be measured in units of RCS. Any m e a s u r e that i n c r e a s e s the value of RCS a t constant luminance i s desirable because i t improves visibility without having to provide m o r e light. (If this can b e achieved a t a lower wattage per unit floor a r e a i t will a l s o s a v e power.)
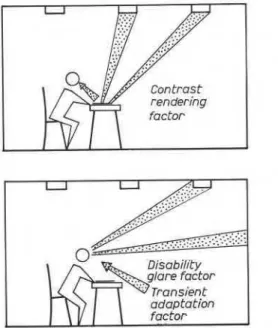
The RCS reference curve demonstrates a fundamental property of the visual mechanism: the relation of contrast discrimination to increasing light levels (which a r e a r b i t r a r i l y categorized in t e r m s of a reference lighting condition). The visibility of a given task contrast in a particular lighting installa- tion will be affected by a number of c h a r a c t e r i s t i c s of that installation, a p a r t from illuminance. By con- sidering such effects a s altering contrast sensitivity, the deviation of any installation f r o m reference light- ing conditions can b e found ( s e e Sections 5. 1 , 5. 2 and 5.3). Lighting characteristics include the direction in which the light f a l l s on the task and the spatial pattern of luminance in the field of view surrounding the task. The effects a r e illustrated in Fig. 4.
5. 1 Contrast rendering
Veiling reflections a r e the minute specular reflec- tions superimposed on diffuse reflections f r o m an object that partially o r totally obscure details by reducing contrast. An e x t r e m e condition e x i s t s where a luminaire can b e seen by reflection in the s u r f a c e of a visual task; this i s reflected glare. The m o r e specular the s u r f a c e the brighter the reflected image and the g r e a t e r the reduction in contrast. Unwanted veiling reflections in a visual task that r e s u l t f r o m a lighting installation a r e quantified by the contrast rendering factor (CRF).
The contrast rendering factor i s a m e a s u r e of the visibility of a task in a given lighting installation, in
Fig. 4. Lighting installation f a c t o r s affecting visibility:
C R F contrast rendering factor; DGF disability g l a r e factor;
T A F transient adaptation factor. Vol. 10 No. 1 1978
comparison with i t s visibility under reference light- ing conditions. Visibility m e t e r s may b e used to obtain CRF values by determining values of relative visibility (RV), defined a s the extent to which
unattenuated task visibility exceeds threshold visibility:
actual task contrast
threshold contrast viewed through visibility m e t e r RV in the r e a l environment divided by RV in the reference s p h e r e equals CRF. Visibility m e t e r s facilitate the diminution of task visibility by contrast reduction a t a constant adaptation luminance. The amount of contrast reduction, determined by the transmittance and reflectance c h a r a c t e r i s t i c s of the instrument, may b e used a s a m e a s u r e of relative visibility. Fig. 5 is a schematic diagram of the operating principle of a visibility m e t e r . The visual task i s viewed through either a monocular o r bino- c u l a r viewing s y s t e m that superimposes a fraction f l of focused light f r o m the task with a fraction f2 of unfocused, diffuse light f r o m a s o u r c e of veiling luminance V. In setting up the instrument the value of unattenuated V i s s e t equal to the adaptation luminance L . The luminance combining device D has the property that the sum of i t s reflectance and transmittance i s a constant a t all settings. The visibility of the task can be reduced by simultane- ously varying the fraction fl of L and f2 of V while the s u m Vl + f 2 ) r e m a i n s constant and visual adaptation i s unaltered.
C R F quantifies unwanted veiling reflections and takes account of the geometry and polarization of the illumination reaching the visual task.
*
These p a r a m e t e r s ultimately affect the physical or luminance c o n t r a s t of t h e task, suggesting that
luminance photometry may be used i n place of the visibility meter procedure to obtain CRF. CRF, then,
may be defined as the ratio of luminance contrast in the actual luminous environment to the value of eon- t r a s t obtained in the sphere.
If Ceff i s the luminance contrast of the visual task in the actual environment and Cref i s the luminance contrast under reference lighting conditions,
Veiling luminance, V
Fig. 5. Dpereting principte of contrast-reduciw visibility meters.
*
If discussian w e r e widened to include visual t a s k s with chromatic contrast, CRF would also account f o r s p e c t r a l composition of illuminance.Values of C R F obtained by luminance photometry will only a g r e e with those f r o m visibility m e t e r readings when t a s k s a r e not too specular and lighting geometry not too directional. In addition, special precautions must b e exercised in luminance photometry t o include optical effects a t the boundaries of task details. These can b e caused by depression of the s u r f a c e of the paper during printing.
Alternatively, with p r e c i s e knowledge of the reflection p r o p e r t i e s of the task and the geometry and polariza- tion of the ilIuminance, C R F values may b e p r e d e t e r - mined by computer calculation. CRF will therefore depend on t h e particular visual task chosen, how i t is
illuminated, and the angle a t which i t is viewed (for a non-matt surface the luminance factor will vary with viewing angle).
Commercial fluorescent lighting s y s t e m s produce C R F values in the range 0 . 8 to 1 . 1 f o r a pencil hand- written task; values g r e a t e r than unity a r e possible because there a r e s o m e veiling reflections in reference s p h e r e illumination.
T o d e s c r i b e the change in visibility of t a s k s placed in r e a l installations where CRF may deviate f r o m unity, the Blackwell s y s t e m evaluates the effect on the RCS reference function. This i s justified by the assumption, discussed in Section 6, that visibility levels, i.e. curves of constant visibility, a r e parallel to the threshold visibility curve.
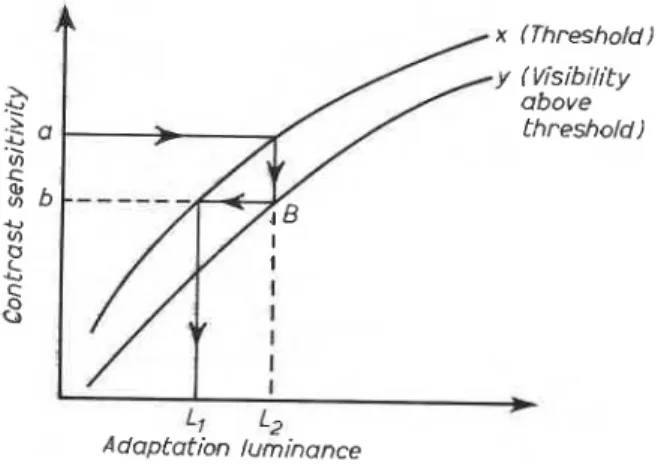
Fig. 6 shows two a r b i t r a r y contrast sensitivity c u r v e s representing different levels of visibility plotted p a r a l l e l to one another. Curve
x
r e p r e s e n t s thresholdvisibility and curve y a higher level of visibility. Consider a task viewed under lighting conditions such that C R F i s l e s s than unity. If the eontrast of the task a t threshold visibility is l / a a t luminance L,, contrast sensitivity is a. If the task i s placed under reference s p h e r e lighting a t L,, where C R F i s by definition unity, i t s visibility is increased above threshold ( t h e r e a r e fewer veiling reflections) and i t s visibility can b e represented by point B on curve y . To bring the task back to threshold visibility the luminance of the sphere must b e reduced to L l , which may be found by determining the intersection of the horizontal line Bb with the c u r v e of threshold visibility x . The value of L1 corresponds on curve
x
to an effective value of contrast sensitivity given by b.If, in fact, curve x i s the RCS reference c u r v e the installation providing a background o r adaptation luminance of L , , with i t s particular low C R F value, i s s a i d to have an effective s p h e r e luminance of L l ,
4
L,?Adaptation luminance
Fig. 6. Two curves of constant visibility to illus2vate significance of contvast rendering factm.
which corresponds to an effective RCS of b . In this way
RCSeff = RCSref x CRF (4)
RCSeff takes inta account the level of contrast sensi- tivity a t the background luminance produced b f the r e a l environment (RCSref) and the level of task visibility due to the physical c h a r a c t e r i s t i c s of actual illuminance in relation to the task s u r f a c e s (CRF)
.
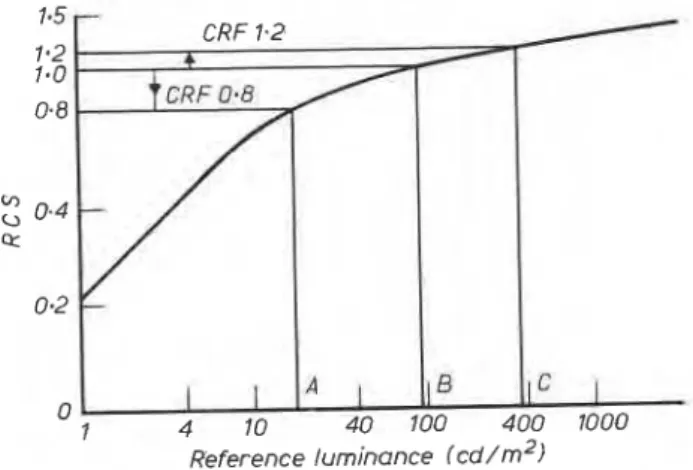
Either effective luminance, Leff, o r effective relative contrast sensitivity,RCSeff, may b e used in the Blackwell s y s t e m to designate a figure of m e r i t f o r alighting installation. Fig. 7 i l l u s t r a t e s t h r e e installa- tions, A, B and C , giving C R F values of 0 . 8 , l . O and
1. 2 , respectively, l o r the s a m e task a t a nominal task luminance of 100 cd/m2. Following eqn. (4) the r e s - p e c t ~ v e RCSPff values f o r A, B and C a r e ( 1 . 0 x 0.8), (1.0 X 1.0) and (1.0 x l . 2 )
1
Installation A produces an RCSeff of 0.8, which is available using only 30 cd/m2 of s p h e r e illumination. Power i s therefore wasted since a nominal task luminance of 100 cd/m2 i s equilavent t o 30 cd/m2 of sphere illumination, i.e. Leff = 30 cd/m2.A
b e t t e r designed installation such a s B o r C should be sought where C R F and hence RCSeff values a r e higher. Ascan be seen from Fig. 7, installation C provides an L,ff of 390 cd/m2 with a nominal task luminance of only 100 cd/m2.
The varying contrast f o r a given task under the three lighting s y s t e m s , a t a lighting level of 100 cd/m2, i s equivalent from the visibility standpoint to a range of 13:l in the amount of light provided.
5.2 Disability g l a r e factor
The pattern of luminance in the visual field surround- ing the task gives r i s e lo two s e p a r a t e effects on visual performance. One i s the disability g l a r e factor, which quantifies the Iuminance veil produced in the eye by the surrounding luminance field. Although the veiling luminance i n c r e a s e s task lumi- nance, i t reduces contrast and therefore visibility. In a c o r r e c t l y designed installation the disability g l a r e factor (DGF) should b e small. In the Blackwell s y s t e m
DGF
i s defined a s the r a t i o of the relative visibiLity of the task in the actual environment to the value under r e f e r e n c e lighting conditions, account being taken of the equivalent veiling luminance of thesurround visual field. T o date,DGF h a s r a r e l y been measured according to this definition, but r a t h e r cal- culated using established formulae. DGF values a r e commonly in the range 1.02 to 1 . 0 3 and do not signi- ficantly affect visibility to the s a m e extent a s CRF.
Reference luminance (cd/rn21
Fig. 7. Effect of CRF on RCS reference function.
F o r completeness, however, DGF i s included in the formula f o r RCSeff.
RCSeff = RCSref x CRF x DGF (5)
5.3 Transient adaptation factor
The transient adaptation factor (TAF) measures tem- p o r a r y l o s s in contrast sensitivity when the o b s e r v e r moves his line of sight f r o m the task to nonuniforrni- ties in the surround luminance of the environment and back to the task again. TAF i s the r a t i o of relative visibility f o r the practical lighting situation to that f o r the uniform r e f e r e n c e field, and is an important factor when task vigilance i s a priority. In this situation
RCSeff = RCSref X CRF X DGF X TAF
The effectiveness of a lighting installation can Ihere- f o r e b e expressed in t e r m s of RCSeff, and the higher the value the b e t t e r the installation. Knowing the actual task luminance, the effective task luminance Leff may b e determined in the manner illustrated in Figs. 6 and 7 and described in Section 5. I.
A s the illuminating engineer normally works in units
of illuminance a s opposed to luminance, it is usual f o r values of Leff to b e expressed in units of equiva- lent s p h e r e illuminance o r ESI (this nomenclature may soon b e altered to ERT, equivalent reference illuminance). ESI i s simply the illuminance required f o r reference s p h e r e lighting to reach the s a m e level of visibility f o r a given task a s that provided by the r e a l o r actual installation.
6 Visual performance
6 . 1 Static and dynamic viewing
The phenomena and methodology outlined s o f a r have dealt solely with situations in which the o b s e r v e r knows exactly where and when to fixate his vision to determine whether the visual task i s visible. Visibi- lity itself h a s been confined to the procedure of detec- tion, that i s to determining whether the task i s p r e - s e n t o r not when displayed f o r a brief period of time (0.2 s f o r the visibility reference task). Most visual tasks, however, r e q u i r e m o r e than simple detection p r o c e s s e s . Identification and recognition a r e a l s o important. F u r t h e r , the majority of visual tasks, by their v e r y nature, r e q u i r e s o m e s e a r c h and scanning, with fixation performing a vital r o l e in a complicated pattern of other eye-movement behaviour. Such tasks a r e performed with what i s t e r m e d dynamic viewing. Visual t a s k s f o r which one knows when and where to fixate, such a s the visibility r e f e r e n c e task, a r e p e r - formed under s t a t i c viewing conditions. The Black- well system r e l a t e s visual performance, a m e a s u r e of visual work, to units of static viewing called visibi- lity levels (VL). The choice of these units i s some- what a r b i t r a r y , but they a r e the most sensible and usefuI to employ since s o f a r they have consistently produced interpretable r e s u l t s .
Visibility levels a r e explained in m o r e detail in Section 6 . 2 and the p a r a m e t e r a!, quantifying dynamic
viewing, in Section 6. 3 . Note that the t e r m visibility level has a confined and s t r i c t definit~on as a m e a s u r e of visibility f o r s t a t i c viewing of brief stimuli. A
fuller discussion of the distinction between s t a t i c and dynamic viewing 1s available elsewhere; 4 i t is men- Vol. 10 No. 2 1978
tioned now only s o that a m o r e p r e c i s e understanding of the t e r m visibility level may b e appreciated. Values of VL do not completely determine the level of visual performance that can b e attained. rr,which c h a r a c t e r i z e s the extent to which an o b s e r v e r has to s e a r c h and scan and view objects off the ocular line of sight, will significantly affect performance level (Section 6.3).
6.2 Equivalent contrast and visibility levels The relation between contrast sensitivity and adapta- tion luminance has been discussed in s o m e detail. Relative contrast sensitivity i s a powerful tool f o r distinguishing the relative visibilities of different t a s k s o r of a given task under different lighting con- ditions. The Blackwell system, however, a l s o enables
the illuminating engineer to predict how well an observer will be able to s e e and perform a particular visual task, in t e r m s of a level of visual performance, as a function of the amount of light provided.
F i r s t two new p a r a m e t e r s a r e required, namely equivalent contrast C and visibility level VL. The RCS reference function was constructed in Section 4
using a visibility reference task, a 4' luminous disc presented f o r 0.2 s exposures, and reference lighting conditions produced by integrating s p h e r e illumina- tion. The Blackwell system postulates that the static visual difficulty of any task may b e measured in t e r m s of the visibility r e f s r e n c e task. The concept of an equivalent contrast C i s used, measured by means of the following procedure.
The visuaI task, illuminated by reference lighting and at a given adaptation luminance, i s viewed through a visibility m e t e r adjusted to bring i t to threshold visi- bility. The task of interest i s then replaced by the visibility reference task (4' disc) in the field of view and the luminance contrast of the reference task adjusted (the disc i s trans-illuminated) s o a s to bring i t to threshold visibility a t the setting of the visibility m e t e r required to b r i n g the r e a l task to threshold visibility. Thus the visibility r e f e r e n c e task and the r e a l taslc a r e equivalent in visibility (both at t h r e s - hold) a t the ataptation luminance of interest.
Numerically, C i s the physical contrast of the visibi- lily r e f e r e n c e task a t the threshold settinp of the meter. T h i s procedure f o r determining C i s intended to cancet individual differences in visibility t h r e s - holds f o r different visibility m e t e r o p e r a t o r s , s i n c e a single operator makes P o threshold determina- tions* f o r each value of C. The concept of an equiva- lent contrast, C, i s the stepping stone from the visibi- lity reference task Lo the r e a l task in much the s a m e way a s CRF, DGF and TAF enable one to proceed from reference i p h e r e illumination to actual lighting environment.
Visibility levels, VL, m e a s u r e units of visibility under static viewing conditions, ie. where no s e a r c h o r scanning takes place. The visibility reference func- tion, VL,, i s a curve representing the luminance con- t r a s t required f o r threshold visibility (50% detection probability) of the visibility r e f e r e n c e task f o r the reference population of o b s e r v e r s a t different levels of adaptation luminance provided by s p h e r e illumina- tion. It i s the i n v e r s e of the RCS reference function adjusted to the absolute values of threshold contrast (Fig. 8). Visibility levels a r e parallel to VL1. The VL number f o r any curve i s the contrast multiplier required to obtain that curve f r o m VL1. F o r example, VL2 r e p r e s e n t s a curve obtained by multiplying each
Reference luminance (cd/rn2)
Fig. 8. Visibility reference function of luminance.
value of contrast, designated C,, on the VL r e f e r e n c e curve by a factor of 2. The VL c u r v e s a r e c o r r e c t l y ranked f o r visibility under static viewing conditions in this fashion, but no significance should b e attached to the magnitude of the contrast multipliers; VL4 does not mean twice the visibility of VL2. The contrast multiplier i s obtained f r o m the r a t i o of C to C,, i.e.
a t a given adaptation luminance when
C
i s measured under s p h e r e illumination. F o r tasks that cannot be placed under r e f e r e n c e lighting conditions,but where DGF and TAF have been accounted f o r , an effective visibility i s introduced:VLeff = VL X DGF x TAF (8)
where
VL = VLref x CRF ( 8 4 [it would have been m o r e logical t o define VFeff =
VLref x C R F to replace eqn. (8a), but unfortunately the CIE publications have adopted the nomenclature above. ]
VLeff i s not only an index of m e r i t f o r different luminous environments ( a s a r e RCSeff and Leff) but can also be related to visual performance, s e e Section 6 . 3 .
*
F o r tasks that cannot be placed conveniently unders p h e r e illumination, f o r example in a roadway lighting situation, the value of C i s a combined a s s e s s m e n t of task difficulty and the physical p r o - p e r t i e s of the illumination (in the absence of DGF and TAF). In this c a s e , no s e p a r a t e determination of CRF can b e made and lighting levels can only b e recommended in t e r m s of effective luminance values r a t h e r than reference values. Thus
and, in general,
where X = L , RCS, VL, and Xref r e f e r s to the value
of the p a r a m e t e r X under reference lighting condi- tions. The t e r m s in b r a c k e t s cannot be separately identified unless the task can b e placed under reference lighting.
6 . 3 Application to lighting standards
Attention i s now turned to the u s e of visual perfor- mance c r i t e r i a to establish lighting recommendations and standards. Previous p a r a m e t e r s such a s RCS and VL m e a s u r e task visibility alone; visual p e r - formance, P, takes into account task visibility and the conditions of observation and response required by the visual task situation. Observation in this context means patterns of ocular s e a r c h and scanning; r e s - ponse r e f e r s to visual information processing, i.e. to the p r o c e s s e s of detection, recognition, and identi- fication. Existing conditions of motivation, training and fatigue, however, a r e ignored.
0 5 10 15 20 25 30 35 40
Effective visibility level
Typical visual performance experiments have involved the identification and marking of Landolt C rings, with b r e a k s in prescribed directions; 5 a
s e a r c h task such a s finding a specific two-digit num- b e r from among 100 randomly arranged numbers on a t e s t card; 6 the detection o r absence of a specific
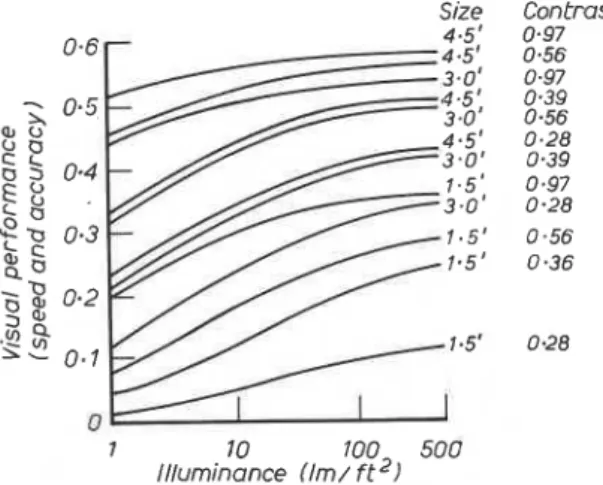
shape (e.g. a square) among a number of different shapes (e.g. c i r c l e s ) . The performance s c o r e i s normally one of speed o r accuracy. Most e a r l y studies concentrated on the relation between p e r - formance and illuminance on the task, varying s i z e , contrast, and exposure duration. Weston in the UK
performed numerous pioneering studies in this field mainly using Landolt ring tasks. A family of his experimental c u r v e s i s shown in Fig. 9. This family of curves can b e reduced to a single one by adopting the procedures of the Blackwell system and plotting the chosen index of performance against the effective visibility level (Fig. 10). Values of VLeff w e r e cal- culated using eqns (7) and (8) and measured values of C. The s y s t e m can therefore offer a g r e a t advan- tage in the analysis of visual performance data in that i t collects, on a single curve, data points ob- tained with t a s k s of different s i z e and contrast, all presented a t different adaptation luminances. Reference 1, which explains the Blackwell system, contains a mean o r average curve of relative visual performance (performance a s a percentage of the maximum achieved) against effective visibility level. This curve provides a good fit to four quite s e p a r a t e s e t s of experimental data and i s regarded a s demon- strating a general relation between visual perform- ance and visibility level. F u r t h e r work by s o m e of the authors of the CIE document has shown, however, that when proper allowance i s made f o r guesswork and chance s u c c e s s the values of performance a r e
Size Contrast
7 10 100 500
Illuminance (lm/ f t 2,
Fig. 9. Family of curves showing relation between speed and accuracy of visual discrimination and illumination on the visual task (reprinted from Light, sight and work, H. K. Lewis, 1962).
Fig. 10. Reduction of family of curves to single curve by plotting performance data a s function of effective visibility level.
considerably different f r o m those used to generate the average curve; no average curve exist^.^ This fact has now been officially a ~ c e p t e d . ~
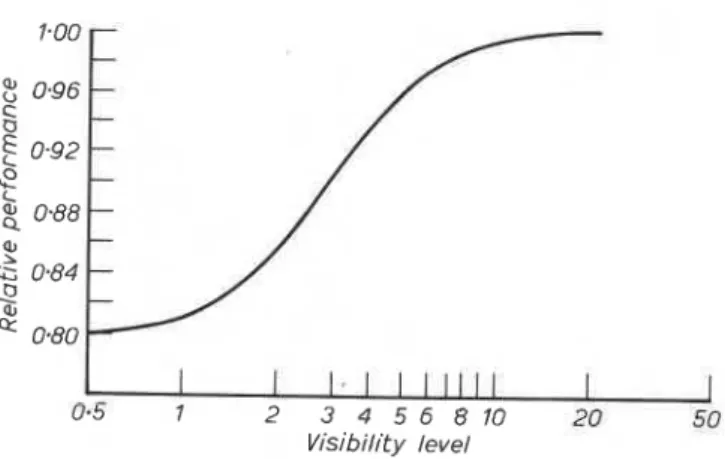
C u r r e n t procedure, which i s s e t out in a draft CIE publication2 a s a sequel to publication 19, i s to plot visual performance, c o r r e c t e d f o r guesswork and chance, a s a function of the logarithm of VLeff (Fig. 11). It has been found that each s e t of data plotted in this manner can be fitted by a member of a family of mathematical functions. The basic mathematical function i s the ogive o r integral of the normal f r e - quency distribution
X
exp { - ( ~ - ~ ) 2 / 2 0 2 ) d~
p
=J-,&
where
p
i s the probability of occurrence of an effect,X
i s a physical m e a s u r e of a cause, M i s the mean value of the normal frequency distribution of X, and02 i s a m e a s u r e of variance of the normal frequency
distribution of X. F o r visual performance data, the performance index i s s e t equal to
p
in eqn. (9) and log VL replaces X. An alternative method of fitting the data to the skew distribution shown in Fig. 11 isto u s e probit analysis and work to a straight line. Results obtained s o f a r indicate that four p a r a m e t e r s , which separately d e s c r i b e the mean value a , , gradient
y
,
maximum value Pm,, and variance v (on the s c a l e of log VL) of the ogive functions, a r e related to each other by 'locked' linear equations s o that the value of any one p a r a m e t e r defines the values of the other three. The p a r a m e t e r a, describing M on the s c a l e of log VL has been found to m e a s u r e the degree of ocular s e a r c h and scan involved in a visual task. Al- though different o b s e r v e r s s e e m to generate ogives with the s a m e gradient y , a! v a r i e s with a normalfrequency distribution of variance v.
a! provides a useful m e a s u r e of the difficulty of con-
ditions of ocular s e a r c h and scanning, and of off-axis information processing. The importance of a in the Blackwell s y s k m - i s almost equal to that of equiva- lent contrast C . C i s a m e a s u r e of intrinsic task difficulty based on s i z e , contrast, configuration and information to b e obtained f r o m the task under s t a t i c viewing conditions. Strictly speaking a, is a m e a s u r e of the dynamic threshold of a visual task and i s expressed in units of log VL. Two further p a r a - m e t e r s d e s c r i b e the proportion of visual component in the visual task and importance of e r r o r s , both important f o r cost benefit analyses.
This latest approach appears to offer considerable insight into the complex components that combine to generate the ogive functions and g r e a t e r precision in prescribing recommended illuminances. It has be- come c l e a r that individual differences in performance and differences in the values of equivalent contrast,
C , f o r various tasks a r e the variables having the l a r g e s t e f f e c t on relative visual performance. Values of a! describing ocular s e a r c h and scanning a r e next
in importance, followed by the respective p a r a m e t e r s describing the proportion of nonvisual component in the task and the importance of e r r o r s . Values of reference illuminance have the l e a s t effect of all the variables considered.
7. Application of Blackwell s y s t e m to lighting design and energy conservation
7 . 1 A r e a s of continuing r e s e a r c h
Some aspects of the Blackwell s y s t e m r e q u i r e further study before general implementation can b e achieved. Of particular concern i s the task dependence of the system. Until recently the ESI concept has been limited a s a practical design tool to the American IES reference pencil handwriting task. With reflec- tance data available now for another four t a s k s the range of visual t a s k s available f o r computer pro- g r a m s for ESI computation has been e ~ t e n d e d , ~ but m o r e data a r e required. It will be interesting to l e a r n whether the relative magnitudes of ESI a t dif - f e r e n t points in an interior a r e independent of the task chosen. If the variation i s not significant, u s e of a standard task f o r a s s e s s i n g lighting installations will become practical and sensible. If i t i s signifi- cant, decisions will b e required with r e s p e c t to the limiting o r average representative task c h a r a c t e r i s - tics.
Another problem is determination of the c o r r e c t adaptation o r background luminance, L, f o r practical tasks. In Section 2 i t was stated that the appropriate value of L must b e established empirically. F o r energy conservation p r o g r a m m e s this situation i s not acceptable, since the shape of the RCS reference function demands that the adaptation luminance b e known accurately. Consider f o r example t h i s page. I s the adaptation luminance the luminance of the white paper, the black print, o r s o m e weighted a v e r - age of the two? Lack of information concerning the problem p r e s e n t s a significant drawback in applying the Blackwell system to common written and printed
1
I
1 ,
1
1
1 1 1 1 1
I
0.5 1 2 3 4 5 6 8 1 0 20 SO
Visibility level
Fig. 1 1 . Logarithmic ogive of relative visual performance against visibility level.
26
visual tasks, although a possible method of determin- ing the background luminance in a s e p a r a t e experi- ment h a s been devised.10
The luminance profile, where task detail m e e t s back- ground, i s an important factor in determining visibility t h r e s h o l d s . l l I t would b e useful to know the relative visibilities of task details with b l u r r e d edges (shallow luminance profile) but high contrast and those with s h a r p edges (steep luminance profile) but low con- t r a s t . The p a r a m e t e r a! characterizing the s e a r c h and scanning pattern required for a visual task affects visual performance. At present a can only be obtain- ed f r o m the experimentally determined performance ogive function. A s e p a r a t e measurement of a! i s needed and although a sophisticated psychophysical measurement technique i s under investigation12 a simple method would b e m o r e practical.
Finally, a means of measuring ESI directly would greatly accelerate both the u s e and acceptance of the Blackwell system. One m e t e r h a s already been developed, but it i s costly and delicate enough to be inconvenient f o r u s e in field s t u d i e s . l 3 A m o r e robust, simple m e t e r i s under development a t the National R e s e a r c h Council of Canada.
7.2 Energy conservation
Sizable savings in the energy used f o r lighting may b e expected if lighting i s selected f o r specific t a s k s r a t h e r than to meet s o m e general specification in t e r m s of a uniform illuminance. The Blackwell s y s - tem provides a means of achieving selective lighting standards and thereby optimizing lighting energy. In the very n e a r future enough data on different tasks and populations of subjects will have been collected to enable the illuminating engineer to design a light- ing scheme on a valid scientific basis.14 It i s sug- gested15 that he f i r s t consider how c r i t i c a l p e r f o r m - ance e r r o r s a r e f o r each task; and secondly decide what level of performance i s n e c e s s a r y f o r i t s opera- tion and the cross-section of worker population in- volved. Using the Blackwell s y s t e m to calculate a visibility level, he can then a r r i v e a t a p r e s c r i b e d reference illuminance ESI. His a i m i s to design a lighting installation s o that the r a t i o of ESI divided by actual illuminance is a s l a r g e a number a s possible and preferably equal to o r g r e a t e r than unity.
Examples follow where the Blackwell system has been used to obtain significant power savings. In all
instances the non-uniform lighting concept has been employed, s o that illumination of the c o r r e c t quality and quantity i s concentrated a t work stations and illuminances in circulation a r e a s significantly r e - duced in intensity. In this context the local desk lamp becomes a highly attractive proposition. In fact, the Blackwell s y s t e m has already been used in designing a desk lamp with a light output distribution that h a s the c o r r e c t intensity and directionality f o r good visibility. l 6
Cuttle and Slater17,18 offer a low energy approach to office lighting by means of local fluorescent desk lamps (each containing a 600 mm, 20 W fluorescent lamp) mounted over the ends of office d e s k s and r e - ducing the level of background lighting, which i s automatically switched on and off by a photo-electric control situated outdoors. The original installation of r e c e s s e d fluorescent ceiling luminaires with flush prismatic panels provided a desk-top illuminance of 550 lux but (using a printed paper task a s a standard) only 330 lux ESI. Local desk lights alone give 280
lux on the desk and an ESI of 570 lux. Supplemented by reduced background lighting, these values i n c r e a s e to 410 lux and 740 lux ESI respectively. A t r i a l in- stallation has been metered f o r 129 working days, July to December, and shows a total lighting energy con- sumption of 968 kwh. Assuming u s e a t full capacity,* the original installation would have consumed 5625 kwh, indicating that the t r i a l installation reduced con- sumption by approximately 83% while increasing ESI by a factor of m o r e than 2.
L a n g e l g h a s conducted experiments in a conference room and two offices in the New York City Municipal Building. Existing conventional luminaires w e r e replaced by twin-beam distributions providing high ESI by illuminating t a s k s f r o m the side, thus minimiz- ing veiling reflections. The power saving i s derived f r o m the fact that a t luminances typically found in i n t e r i o r s , a 1% l o s s in task contrast r e q u i r e s an in- c r e a s e in illuminance of between 10 and 15% to maintain the s a m e level of visibility. The r e s u l t s of changing to twin-beam distribution luminaires a r e
as follows:
Conference room: total wattage was reduced from 2000 to 1400 W with ESI on the conference table increasing f r o m 240 to 390 lux;
Large office: a power reduction from 1200 to 600 W was achieved while maintaining ESI a t 480 lux; Small office: a new lighting system reduced power f r o m 400 to 300 W, with ESI on the desk increasing f r o m 140 to 240 lux.
In each a r e a visibility was maintained o r increased and a significant reduction in power consumption achieved.
At a recent Federal Energy Agency Symposium in Washington, King20 of the General S e r v i c e s Admini-
stration outlined the non-uniform illumination con- cept (derived f r o m the Blackwell s y s t e m ) , explaining that i t conserves energy while providing adequate, comfortable lighting a t work stations. Adhering to the GSA 50/30/10 standard, t l a m p s w e r e removed o r de-energized where this standard was obviously exceeded; each room was visited to e n s u r e that the standard was accomplished in such a way a s to p r o - vide an acceptable environment. The previous uni- f o r m illuminance concept in the interior was replaced by a m o r e uniform ESI level throughout the task a r e a . With removal of over 3 million fluorescent lamps in
10 000 buildings, a reduction in energy of 445 x l o 6 kwh was achieved.
*
A pilot study c a r r i e d out a t the UK Building Re- s e a r c h Establishment has shown that in l a r g e open- plan offices 80'1~ of the maximum possible lighting usage o c c u r s (private communication by D. R. G. Hunt).-f 50 ft-c (approximately 500 lux) in working a r e a s (on the desk top); 30 ft-c (-300 lux) in the general office environment; 10 ft-c (-100 lux) in hallways, c o r r i d o r s and seldom occupied a r e a s .
8 Conclusion
The Blackwell system provides a unified framework of methods in which the relations between illumination and visual performance and visibility can b e expres- sed in a quantitative fashion. Some of the problems of application and the data required before wide5- spread application i s possible have been discussed. At present the system p e r m i t s the monitoring of visibility, an extremely important aspect where light- ing energy conservation p r o g r a m s a r e enacted. Lack of data and convenient means of implementation and application, however, may prevent the u s e of the s y s - tem f o r prescription of recommended lighting levels. Acknowledgements
The author thanks J. B. Collins and V. H. C. C r i s p for their participation in most helpful discussions during the e a r l y preparation of this paper a t the UK Building Research Establishment, and H. R. Blackwell (Institute f o r Research & Vision, Ohio State University) f o r h i s patient explanation of many of the concepts. The paper i s a contribution f r o m the Division of Building R e s e a r c h , National R e s e a r c h Council of Canada, and i s published with the approval of the Director of the Division.
References
1 A unified framework of methods f o r evaluating visual performance a s p e c t s of lighting, CIE publication 19 (1972).
2 Implementation procedures f o r evaluating visual performance a s p e c t s of lighting, CIE preliminary fifth d r a f t (1976).
Hopkinson, R. G., and Collins, J. B., The ergono- m i c s of lighting (Macdonald Technical &
Scientific, London, 1970),p. 53.
Levy, A. W., L t g Des. & Applic., 7,23 (1977). Weston, H. C., Industrial Health R e s e a r c h Board Report 87, Medical Research Council (1945). Bodmann, H. W.,Internat. L t g Rev., 13,41 (1962). Boynton, R. M., and Boss, D. E., Illum. Engng, 66, 173 (1971).
Blackwell, H. R., and Scott, D. E., J. Illum. Engng SOC., 2 (4), 445 (1973).
Lewin, I., J. Illum. Engng Soc.,6 ( I ) , 44 (1976). Levy, A. W. (to b e published).
Blackwell, H. R., Illum. Engng, 58,161 (1963). Blackwell, H. R., Proceedings of CIE Session, London, 1975, CIE publication 36 (1976), p. 253. Ngai, P. Y., Zeller, R. D., and Griffith, J. W., J. Illum. Engng Soc., 5 ( I ) , 58 (1975).
Blackwell, H. R., Ltg Des. & Applic., 6 ( I ) , 17 (1976).
Dorsey, R. T., and Blackwell, H. R., L t g Des. &
Applic., 5 (2), 13 (1975).
Slater, A. I., Light Ltg, 69, 162 (1976).
Cuttle, C., and Slater, A. I., Light Ltg, 68,20 (1975). Cuttle, C., and Slater., A. I., Proceedings of CIE Session, London, 1975, CIE Publication 36 (1976), p. 24.
Lange, A. W., Ltg Des. & Applic., 6 (2), 10 (1976). King, J., Ltg Des. & Applic., 6 (1), 52 (1976).