Publisher’s version / Version de l'éditeur:
Vous avez des questions? Nous pouvons vous aider. Pour communiquer directement avec un auteur, consultez la première page de la revue dans laquelle son article a été publié afin de trouver ses coordonnées. Si vous n’arrivez pas à les repérer, communiquez avec nous à PublicationsArchive-ArchivesPublications@nrc-cnrc.gc.ca.
Questions? Contact the NRC Publications Archive team at
PublicationsArchive-ArchivesPublications@nrc-cnrc.gc.ca. If you wish to email the authors directly, please see the first page of the publication for their contact information.
https://publications-cnrc.canada.ca/fra/droits
L’accès à ce site Web et l’utilisation de son contenu sont assujettis aux conditions présentées dans le site
LISEZ CES CONDITIONS ATTENTIVEMENT AVANT D’UTILISER CE SITE WEB.
Building Research Note, 1985-11
READ THESE TERMS AND CONDITIONS CAREFULLY BEFORE USING THIS WEBSITE.
https://nrc-publications.canada.ca/eng/copyright
NRC Publications Archive Record / Notice des Archives des publications du CNRC :
https://nrc-publications.canada.ca/eng/view/object/?id=8afe9439-61b0-46bb-b283-389ad4403405 https://publications-cnrc.canada.ca/fra/voir/objet/?id=8afe9439-61b0-46bb-b283-389ad4403405
NRC Publications Archive
Archives des publications du CNRC
This publication could be one of several versions: author’s original, accepted manuscript or the publisher’s version. / La version de cette publication peut être l’une des suivantes : la version prépublication de l’auteur, la version acceptée du manuscrit ou la version de l’éditeur.
For the publisher’s version, please access the DOI link below./ Pour consulter la version de l’éditeur, utilisez le lien DOI ci-dessous.
https://doi.org/10.4224/40000478
Access and use of this website and the material on it are subject to the Terms and Conditions set forth at Uniform derivation of optimum conditions for speech in rooms
Ser TH1 w2 no. 239 c. 2 BISG
National Research Conseil national
19
Council Canada de recherches Canada Division of Division desBuilding Research recherches
en
GtirnentBuilding
Research
Note
Uniform Derivation
of
Optimum
Conditions
for Speech
in
Rooms
by
J.S. Bradley
BRN
239
UNIFORM DERIVATION OF OPTIMUM CONDITIONS FOR SPEECH
I N
ROOMSANALYZED
by
J.S.
BradleyNoise and Vibration Section Division of Building Research
BRN
239E S N 0701-5232
Ottawa, November 1985
TABLE
OF CONTENTSABSTiUCT,k.E
'sdM,
~&
. . .
1 INTRODUCTION. . .
2PROCEDURE
. . . * . . .
3 RESULTS. . .
4Criteria from Single Measures
. . .
4Combinations of S/N(A) and
RT
. . .
7Optimum combinations of background level and
RT
. . .
11CONCLUSIONS
. . .
17ABSTRACT
The data from two previous studies of speech intelligibility in rooms are used to derive values of acoustical measures that would correspond to optimum conditions for speech in rooms. Optimum values of the A-weighted s ignal-to-noise ratio, the articulation index, the speech transmission index, and the 0.080-second useful-to-detrimental ratio were first determined as the point beyond which no increase in mean speech intelligibility score would be expected. Combinations of optimum reverberation time and background noise level were
calculated from equal useful- to-detrimental ratio contours. These optimum reverberation time and background noise levels are presented as simple design contours.
L'auteur utilise les donnkes de
deux
etudes antbrieures sur I'intelligibilitd de la parole dansles salles pour determiner des valeurs de mesures acoustiques qui correspondent aux con-
ditions optimums de transmission de la parole en salle. Les valeurs optimums du rapport signal-bruit de valeur pondCrke A, de l'indice d'articulation, de l'indice de transmission de la parole et du rapport utilenuisible de 0,080 seconde ont d'abord Ct4 dbtermin6es
cornme constituant le point au-delk duquel on ne peut esp6rer augmenter l'indice moyen
d'intelligibilitk de la parole. Les cornbinaisons du temps
de
rCverbQation et du niveaude bruit de fond optirnums ont &ti! calculkes k partir des 6quicontours du rapport utile- nufsible, Ces temps
de
rCverbkration et niveaux de bruit de fond optimums sont prhentkINTRODUCTION
A large number of rooms are intended
for
speech communication between one talker anda group of listeners. Such rooms vary in size from clssroons and small meeting room to large auditoria. It is essential that such rooms be designed so that the listeners experience
the highest possible level of speech intelligibility. Poorly designed classrooms may lead
to decreased levels of academic achievement, while unsatisfactrrry speech intelligibility in other rooms may lead to a Iass of revenue to the owners. In
all
cases poor conditions for speechwill lead
to less precise and more strained communication between talkerand
listener,
A number of acoustical quantities may
be
used to define ideal conditions for speechin
rooms. Traditionally, the signal-to-noise ratio and room =oust ics aspects of the problem
have
been considered separatelyin
terms of a maximum background noise leveland
an optimum reverberation time(RT)
.
More recently, two types of measures havebeen
devised that combine both aspects of the problem into one quantity. One of these, useful-to-detrimental sound ratios, was first developed by Lochner and Burger [I1 after considerable experimental study of the response of the hearing system for conditions with a variety of reflection sequences, as are
found in
rooms- Recently useful-bdetrimentd ratios havebeen evaluated in both the original form and in an even more successful simpIified form [2,3].
The
other type of measure, the speech transmission jnda (STI) is more arbitraryin
its derivation and is calculated from modulation t r a d e r functions, and speech and noise levels 141.
There is presently little information concerning optimum conditions for speech in terms of the two new types of measures,
A
range of valum for optimumRT
and maximumback-
ground levels can be found in various textbooks. Unfortunately it is usnally difficult to trace the origin of these values, so that their validity cannot always be thoroughly evalu- ated, and the interpretation of such values is not always clear.
For
example, background noise level criteria, can be 'maximum tolerable levels', one step frum disaster, or 'ideal maxima', low enough t o provide truly optimum conditions. The difference could easily correspond to a range of 10 to 15 dB(A)What is now needed is a unified procedure for deriving optimum conditions for speech in rooms, including a complete description of how the final values are obtained.
This
report includes such a derivation basedon
the combined data of two- previous studies ofspeech
intelligibility in rooms [P,3]. Optimum values were determined for both of the newer types of quantities, as
well
as for the articulation index (AI) and A-weighted signal-twnoise ratios (SIN (A)). Optimum combmatiam ofRT
and A-weighted background level (BG(A)) were derived from usefu 1-to-detrimental ratios, as these most successfully combineboth
room acoustics and signal-to-noise ratio aspects ofthe
overall problem. Optimum d u e s forST1
and Uso can be presented as single numbers, Ideal maximum background levels are presented as functions of both the speech sourcelevel
and room volume, while optimumPROCEDURE
The analyses in this paper were performed by combining the data from two previous studies in which acoustical ~rleasurements were obtained from the computer processing of pistol shot recordings. A large number of acoustical quantities were calculat-ed for comparison with speech intelligibility test scores obtained at the same locations in the same rooms. Using the combined data provided a broader range of acoustical conditions on which to
base
the
derivation of optimum conditions. The data included measurements at 80 source-
receiver combinations in 15 room with volumes from 253 to 20,000 m3 andRT
valuesfrom 0.39 to 3.8 seconds. Although the data were taken from two different studies, the two sets of data exhibited similar overall trends 131.
The
speech inteIligibility scores were produced using a Fairbanks rhyme test with thetest words embedded in a carrier phrase. The tests were performed using tape recorded material reproduced at known source levels through a loudspeaker with directional prop- erties similar to a human speaker. For each source - receiver combination, four different speech source Ievels were
used. Thus with
four source levels and 80 measurement positions, acousticaf measurements and group-averaged speech intelligibility scores were obtained for 320 conditions.Acoustical measures were calculated in the standard octave bands from 125 to 8000 Hz. They included the reverberation time
(RT)
and Cso (the early-to late-arriving sound ratio with a 0.080-second early time limit). Background noise levels were measured from one-minute recordings at each receiver position and
the
speech levels at each position were calculated from the source level, the reverberation time, the source - receiver distance,and
the source directionality. 'Uao values, the useful-t* detrimental sound ratios with a0.08&second early sound limit, were calculated from the corresponding early-to-Iate ratio (Cso) and
the
speech and noise levels at each position.--
10 10g{C~0/(1+ (Cso+
1)r , / I a ) )
where C80,the
linear early-twlate ratio, is givenby the
following:where I, / I 8 is the ratio of A-weighted steady state background noise and speech intensities. Modulation transfer functions were also calculated from the recorded pulse responses using a technique described by Schroeder 151.
By
combining these values with speech and back- ground noise levels according to the procedure proposed by Houtgast et al. [4], ST1 values were produced. Further details of the measurement techniques can be obtained from the published accounts of the original studies [2,3,6].Criteria from Single Measures-
Four independent acoustical quantities were first considered. Optimum conditions were defined as the point at which 100% speech intelligibility was reached by the mean trend
of the rhyme test results or where
the
mean trend showed no furkher increase in speech intelligibility score. Others have chosen lower criteria and there is necessarily some abi- trariness to such a limit. However, with a simple test such as theFairbanks
rhyme test,the
mean trendshould
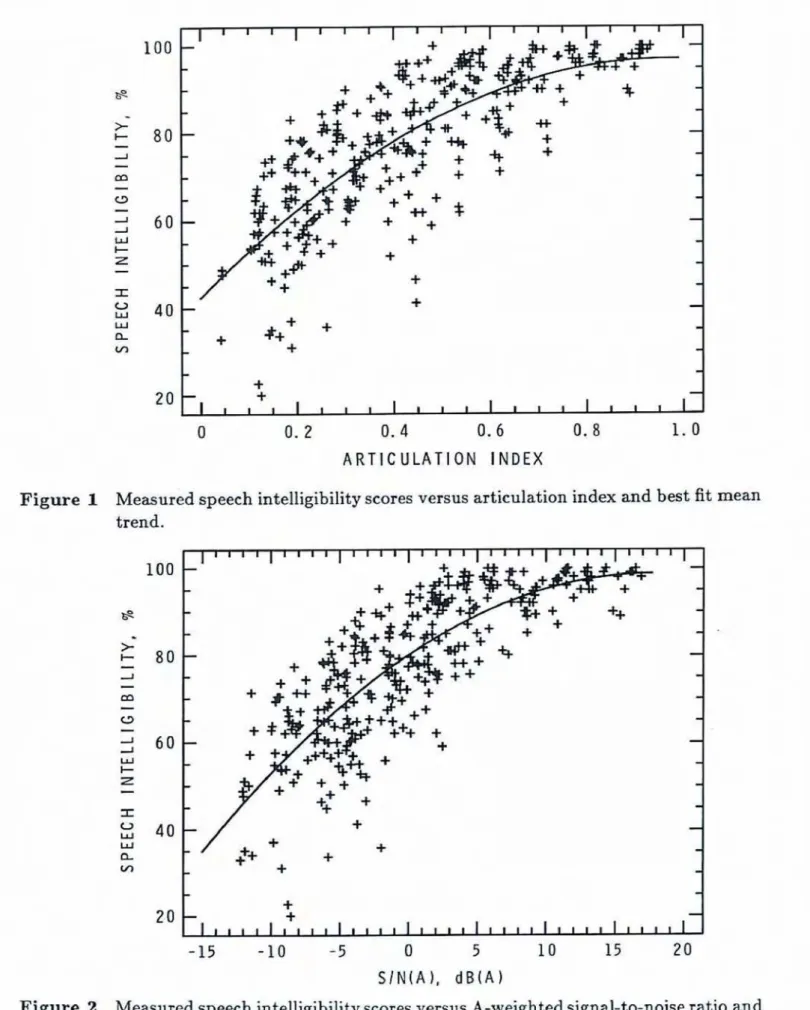
approach 100% under optimum conditions.Figures 1 and 2 plot speech intelligibility scores
(SI)
vmus the articulation index (AI) and the A-weighted signal-to-noise ratio (S/N(A)
)
respectively.Both
are signal-&noise ratio type quantities and do notinclude
the
influence of room acoustics factors. Figure1
shows no substantial improvementin
SI above anAT
value of approximately 0.9.Similarly,
Figure 2 indicates
that above
15 dB(A) S/N(A) there is nofurther
improvementin
SI
scares. Ignoring room acoustics factors, one can conclude that an
A1
of 0.9 or m SIN( A) of 15 dB(A) or greater represent optimum conditions for speech-The A1
or S/N(A) values couldbe
combinedwith
RT
values to produce a compound predictorthat
would relateSI
scoresto
a combined signal-twnoise ratio and room acousticsmeasure.
This
was done in two previous studies [2,3] using multiple regression analyses.The
disadvantage of this approach is that without some other knowledge,the
form of the combination of termsis
arbitrary, and the resulting prediction equation is influenced bythe
rangeand
distribution ofeach
variablein
the
available data. It is much more satisfactory to use a measure that combiiesboth
aspects of the problemin
a form based onindependent previous research. Us&-to-detrimentd sound ratios, based on consider able laboratory research by Lochner and Burger, are certainly such a measure. The speech transmission index is also a m u r e
that
has received extensive evaluation as a predictor of speech intelligibility by its developers in the Netherlands. Thus ST1 and Uso representtwo cambinations of both a signaI-t o-noise ratio and a room acoustics measure From
which
ideal conditions for speech in rooms can be examined more completely.
Figures 3 and 4 plot measured
SI
scores againstST1
and 1kHz
Uso values, respective& From Figure 3 maximum speech intelligibility corresponds t o an ST1 of app~oximately 0.55,while
Figure 4 indicates that optbum conditions occur for a 1 kHz UBo ofabout
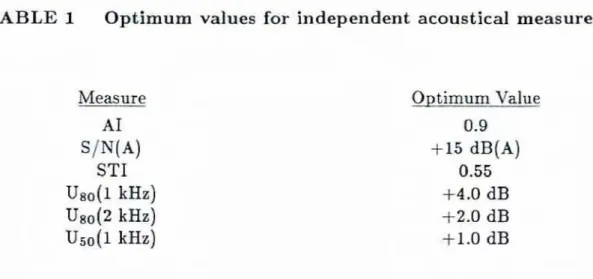
+4-0 dB. Table 1 s u r m d m s the obtained optimum values of these m u s t i d measures, as well as those for the 2
kHz Uso
andthe
1kHz
Um
values.
The
2kHz Uso
isincluded
because it was faund to
be
more strongly related to speech intelligibility scores thanthe
other measures.
U50
is the usehl-tt~ detrimental ratio derived from an early-%*late ratiowith
a 0.050-second early sound limit, and is included because the 0.05O-second early time limithas
been used for speech by a number of other researchers.20
0 0. 2 0.4 0 . 6 0.8 1.0
A R T I C U L A T I O M I N D E X
Figure 1 Measured speech intelligibility scores versus articulation index and best fit mean trend.
-15 - 1 0 -5 0 5 I 0 15 20
S I M I A
1,
d B ( A 1Figure 2 Measured speech intelligibility scores versus A-weighted signal-to-noise ratio and
Figure 3 Measured speech intelligibility scores versus ST1 values and
best fit
mean trend.- 2 0 - 1 5 - 1 0 - 5
a
op
d 6Figure 4 Measured speech intelligibility scores versus 1 kHz USo values and best fit mean
TABLE f Optimum values for independent acoustical measures 0 p t imum Value 0.9 +15 dB(A) 0.55 +4.0 dB t2.0 dB t1.0 dB
An optimum S/N(A) of 15 dB(A) has been found in other recent studies 171, and an A1 value of 0.9 is generally considered to represent excellent conditions for speech. Houtgast 171 has labelled an ST1 of 0.6 as 'good'; this is only slightly larger than the optimum of 0.55 from this study-
Combinations of S/N(A) and
RT
Clearly the best way to evaluate a room for speech is to measure UHO or ST1 values directly. Until equipment to do
this
is readily available and in widespread use, it is still of interest to rdate an optimumUso
or ST1 value to related combinations of S /N(A) andRT
values. Also an understanding of how S/N(A) andRT
values combine to produce optimum conditions is valuable to better understand the inherent trade-offs in the design process. Finally, the values of S/N(A) andRT
that are found to lead to optimum conditions c a n be compared to established values in the literature.Houtgast et al. havedemonstrated how
ST1
canbe
calculated from S/N(A) and RT values and have published equal ST1 contours on a plot of S/N(A) versusRT
[4]. These are reproduced as the dashed lines on Figure 5 for ST1 values of 0.4, 0.6, and 0.8. Thus allcombinations of S/N(AJ and
RT
that lie on one of these contours should correspond to equal speech intelligibility and the contours illustrate the trade-off between S/N(A) andRT
that can be used in designing to achieve a particular level of speech intelligibility. As given inEq.
(I), Us0 c a nbe
calculated from Ggo and S/N(A) values.To
associate Uso values with combinations of S/N(AJ andRT
values it is necessary to relate Cso values toRT
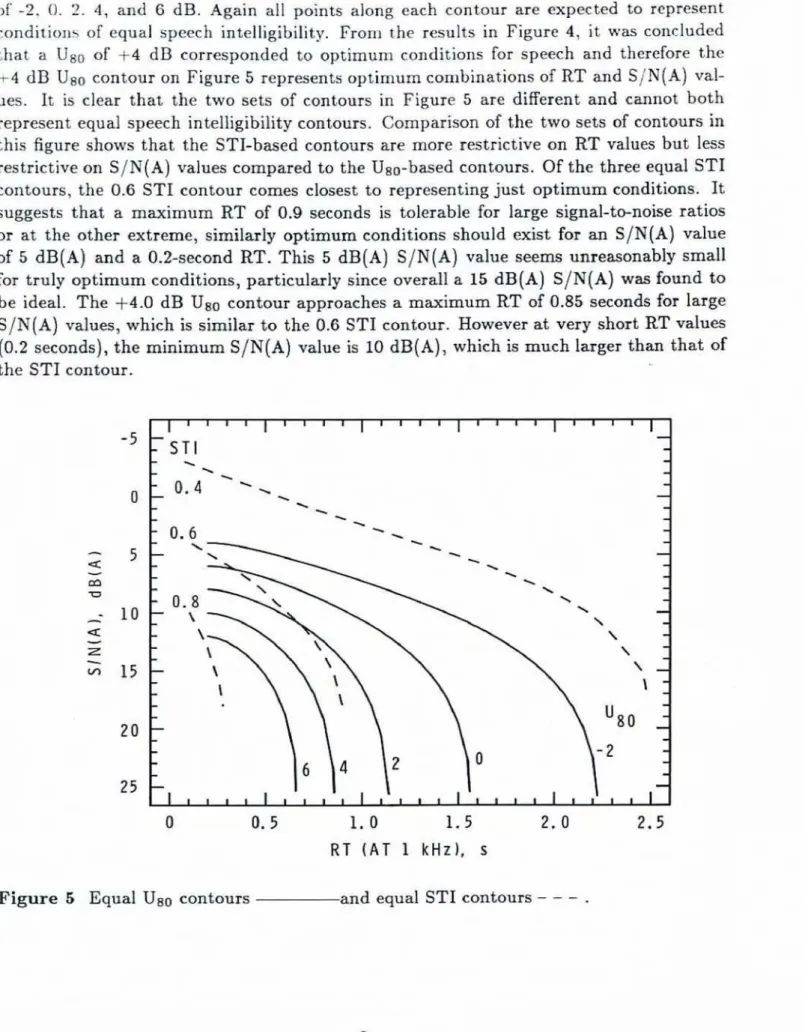
values. This can be done approximately by assuming ran ideal continuous exponential decay. Then the linear Cso can be calculated as foiIows:With this approximate relationship one can calculate equal Uso contours from combina- tions of S/N(A) and 1
k H z
RT
values. These are also shown on Figure 5 for Uso valuesof -2, 0. 2. 4, and 6 dB. Again all points ala~ig each contour are expected to represent conditions of equal speech intelligibility. From the results in Figure 4, it was concluded that a
Us0
of +4 dB corresponded to optimum conditions for speech and therefore the+
4 dBUse
contour on Figure 5 represents optimum combinations ofRT
and S/N(A) val-ues. It is clear that the two sets of contours in Figure 5 are different
and
cannot both represent equd speech intelligibility contours. Comparison of the two sets of contours inthis figure shows that the STT-based contours are more restrictive on
RT
values butless
restrictive on S/N(A) value. compared to the
Use-based
contours. Of the three equd ST1 contours, the 0.6 ST1 contour comes closest to reprsenting just optimum conditions. Itsuggests that a maximum
RT
of 6.9 seconds is tolerable for large signal-t-noise ratios or at the other extreme, similarly optimum conditions should exist for an S/N[A) value of 5 dB(A) and a O.ZsecondRT.
This
5dB(A)
S/N(A) value seems unreasonably smallfor truly optimum conditions, particularly since overall a 15 dB (A) SIN( A) was found to be
ideal.
The
+4.0dB
iJBo contour approaches a maximumRT
of 0.85 seconds for largeS/N
(A) d u e s ,which
ksimilar
tothe
0.6ST1
contour. However at very shortRT
values (0.2 seconds),the
miniurnS/N(A)
value is 10-(A),
which & much larger than that of theST1
contour.0 0.5 1 . 0 1 . 5 2.0 2- 5
R T ( A T 1 k H z ) ,
s
For a number of reasons it was judged better to derive optimum cornbinatior~s of
RT
and S/N(A) values from equal Uso contours. As discussed above, the equal Uao contours of Figure 5 seem intuitively more reasonable than the equal ST1 contours. The ns~ful-to- detrimental sound ratio concept is Founded on extensive laboratory research by Lochner and Burger thatestablished
a thorough understanding ofhow the
hearing system reponds to speechin
rooms. From analyses with the present combined data, UgO was found to beas
good as or betterthan all
other acoustical measures tested as a predictor of speech intelligibility scura. Finally ITso values are conceptually more satisfying in that one can readily comprehend the beneficial resultsof
stronger early reflections and speech levels orthe detrimental effects of increased late reflections or background noise.
Both sets
of
contours on Figure 5 were derived assumingideal
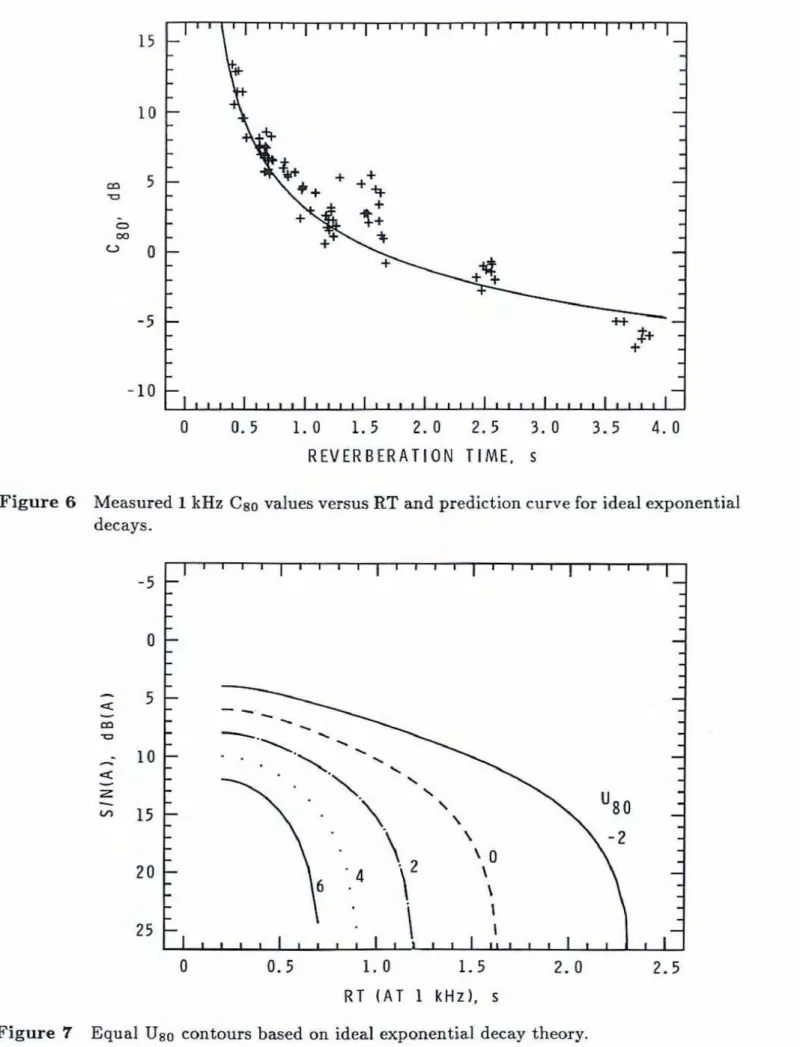
continuous exponential decays. Figure6
plots measured Cso value versusRT
values dong with the prediction curve of Eq. (3) for an ideal exponentid decay. This figure illustratesthe
approxhak natureof
this prediction, showing that errors of up to 5 dB between measured and predictedCso values secured. Of course, the fact that one cannot accuratdy predict Cso values from
RT
value done further d m n s t r a hthe
need for newer measures such as UHO. Barron 181 has derived a more complete method for p~edicting Cso values from theRT,
the room volume, and the source - receiver distance, which predicted the Cso values in the present study with an RMS errorof
1-20 dB, compared to the RMS error of 1.75dB fur
the exponential theory.If
one uses afixed
typical source - receiver distance, the estimation of CEO values can bebased
onboth
RT
andthe
morn volume.Figure 7 presents equal USo contours on a plane of
S
/N(
A) versus 1kHz
RT
values similar to Figure 5 but withRT
values estimated from Cso values using Barroa'sEq.
(7) for amorn volume of 1 0m3. A source - receiver distance of 10 m was used. The contours of Figure 7 for a
rmm
volume of 1000 m3 are very similar ta those of Figure 5 arid for practical applications eitherwmld be
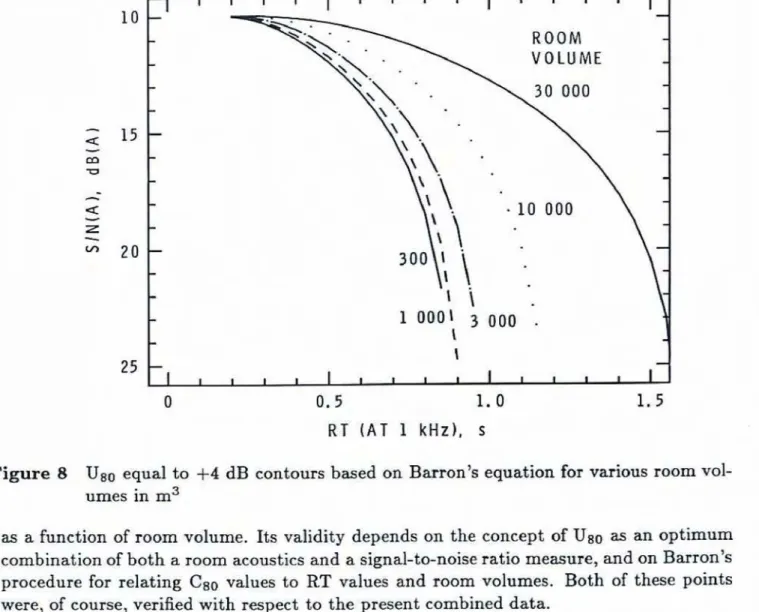
satisfactory.Figure 8 illustrates
the
influence of room volume on calculated +4 dB Uso contours. In this case the CgOvalus
were estimated using Barron b Eq. (7). Ruom volume has a Iarge effect on the calculated contours only for quite large moms (greater than 3000 m3 in volume]. Figure 8implies
that
for larger rooms, longer reverberation times canbe
accepted as giving optimum resulk- for speech. This would agree qualitativelywith
current practice such as Knudsenand
Harris's[Q]
plotof
optimum reverberation time for speech as a function of room volume.The
increased optimum reverberation time relative to a 1000 m3 room indicated by Figure 8 canbe
calcuIated quite accuratelyby
an equation derivedfrom
this figure.This
equation was obtainedby
fitting a regrasion line to theET
values versus room volumefor
an S/N(A) of 15 dB(A) on Figure 8.The
resulting equation is:where
V
is the room volume in m3, andRT,
is the optimumRT
for a 1000 m3 room. This. equation thus provides a simple procedure for determining opfimumRT
values for speech0 0.5 1.0
1.5
2.0 2.5 3 . 0 3.5 4 . 0 R E V E R B E R A T I O N TIME. sFigure 6 Measured 1
kHz
Cso values versusRT
md predict ion curve for ideal exponentialdecays.
1 . 0 1.5 R T ( A T 1 kHz),
s
0 . 5 1.0 R T ( A T 1 kHz),
s
Figure 8 Uso equal to +4 dB contours based on Barron's equation for various room vol- umes in m3
as a function of room volume. Its validity depends on the concept of USo as an optimum combination of both a room acoustics and a signal-to-noise ratio measure, and on Barron's procedure for relating Cs0 values to
RT
values and room volumes. Both of these points were, of course, verified with respect to the present combined data.Optimum combinations of badground level and
RT
As
a final result, it is desirable to derive both optimumRT
and optimum A-weighted background noise levels (BG(A)J as a function of both the speech source level and the room volume. Equation (4) permits one to calculate optimum RT's once an optimumRT
for a 1000 rn3 room has been obtained. One can calculate optimum BG(A) values in a manner similar to
that
used to obtain Figures 5 and 7, afterf i ~ t
calculating expectedspeech Ievels in the room.
To
do this, representative speech source Ievels are required. Data by Pearsons et al.[lo]
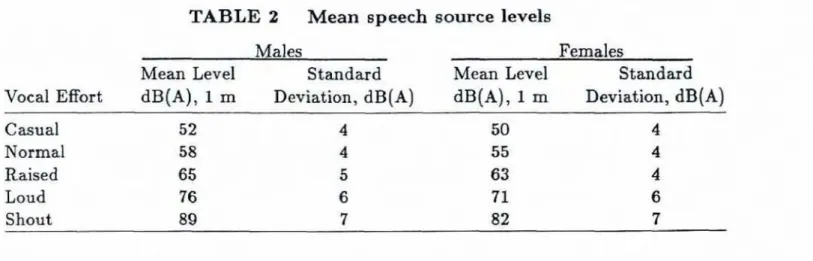
represent an extensive modern evaluation of this problem. They determined long term average speech levels for talkers at various levels of vocaleffort, dong with the standard deviation of the groups of talkers. They produced such data separately for males, females, and children. Table 2 gives their group mean values and standard deviations for males and females. It was judged that in small rooms (300 m3), subjects should
be
able to communicate with a 'normal' voice level, but in larger rooms subjects would reasonably expect to use a 'raised' voice level. It was also decided thatoptimum canditims should be optimum for the large majority of talkers. Thus it
is
not satisfactory t o design only for the mean talker source level. Accordingly, in subsequent calcutatiom of optimum conditions,the
mean female speech source levels less 1.0 standard deviation, as obtained from Pearsons et al., were used.TABLE
2Mean
speech sourcelevels
Males
FemalesMean Level Standard Mean Level Stmdard
Vocal Effort dB(A)
,
1 m Deviation, dB(A) dB(A), 1 m Deviation,dB(A)
Casual 52
Normal 58
Raised 65
Loud 76
Shout 89
Knowing the speech levels at a distance
of
1.0 m f h mthe
source given in Table 2, one cancalculate the reverberant field speech levels in a room of given volume and reverberation time. Combining this with the calculations used to
obtain the
equalUsa
contours of Figure 7, one can calculate equalUso
contours on a plane of BG(A) versusRT
for various combinations of room volumeand
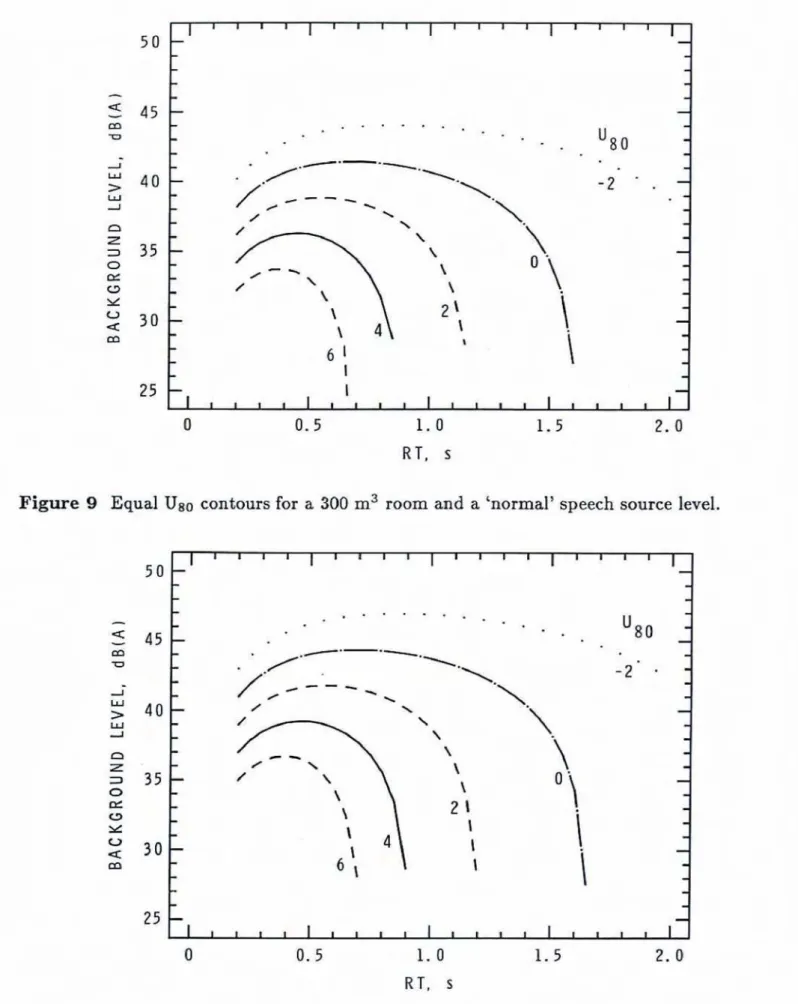
speech source level, Figures 9 and 10 repmsent two of many possible plotsfrom
this
procedure, Figure 9is fm
a 300 m3room
and a 'normal' speech source level (55-4 dB(A)). Figure 10 is for s 1000 m3 room with a 'raised' voice s m elevel
(63-4dB(A)).
From these plots one can arrive at combinations of BG(A) andRT
that wouldbe
expetted to produce optimum conditions for speech from the +4 dB Us0 contour.To avoid presenting a large number of such plots it is desirable t o derive a shnplified scheme for predicting optimum conditions from these plots.
From
Figure 10 one can select as a starting pointthe
condition of 0.7 secondsRT
and 37.5 dB(A) background level on the +4 dBUaO
contour. Other pointson
this contour would alsobe
expected to correspond to optimumconditions,
but for practical reason6 this paint approximates a, good designgoal.
For much
higher
RT
values
on this contour considerably lower background levels arenecessary; fur much
lower
RT
values little is
gained in termsof
less stringent backgmundlevels, and considerable
expensewould be
required f ~ rthe
absorptive treatmmtto obtain
these shorter
RT
values.In
addition, itw w l d
bedifficult
toadd
enough absorptive tAt-
ment to greatly reduce the reverberation time without destroying necessary strong early rdections.
Thus
the combined values of 0.7 secondsRT
and 37.5dB(A)
represent 8 rea- sonableinitial
design point for this case of a 1CMM m3room
and a 'raised' voice sourcelevel.
Such a design point repmwnts the largestRT
d u e that does not significantly increasethe
restriction
on
acceptablebackground
noise leveb.The corresponding design points for other room v o l and ~ speech ~ source levels can
readily be determined. The optimum RT
values
for other room volume c a nbe obtained
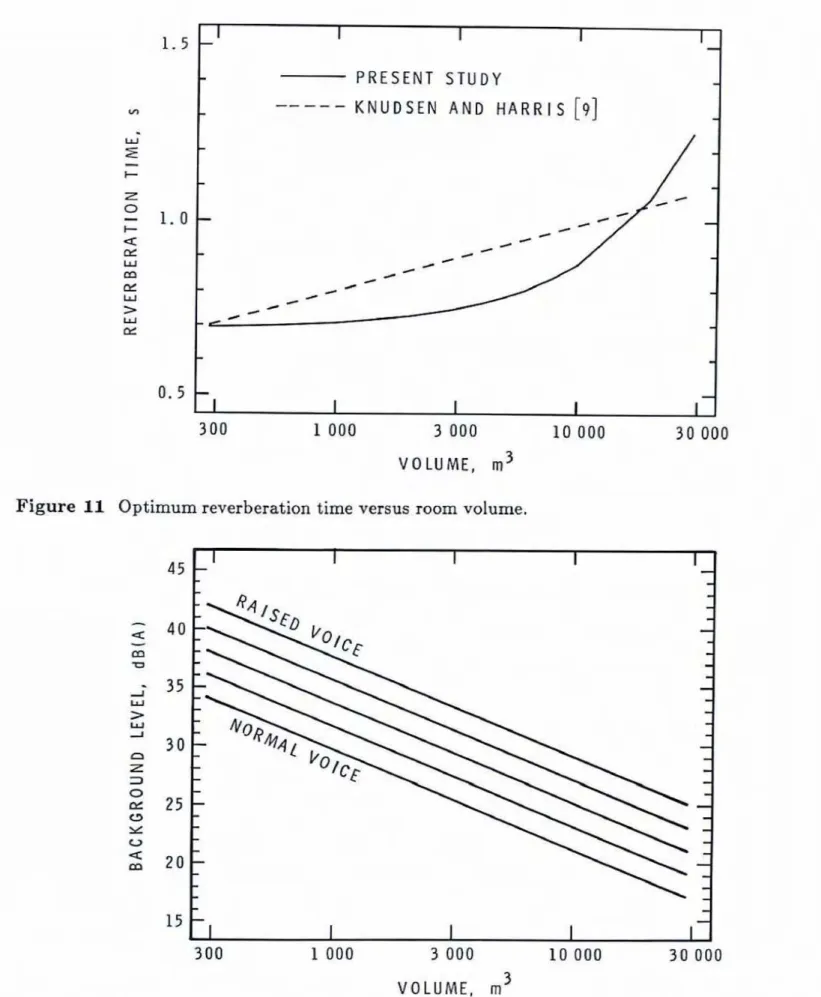
from Eq. (4). These are plotted versus the logarithm of the room volume on Figure 11.0 0 - 5 1 . 0 1 . 5 2 . 0
R T ,
s
Figure
9 Equal Uso contours for a 300 m3 room and a 'normal' speech source level.0 0.5 i . 0 1.5 2 . 0
R T .
s
Far comparison Knudsea and Harris's optimum Iine for speech is also given. Although tbe new results are not 1inea.r with the logarithm of the volume as are Knudsen and Harris's, for most room volumes the two approaches agree within about 0.1 second.
Once the optimum
RT
values far various room volumes had been determined using Eq. (41, the optimum BG(A) values were then read oKthe plots of BG(A) versusRT
from the +4 dB Uso contours. These optimum BG(A) values are plotted versus room volume in Figure 12. The upperT i
is for a 'raised' voice source level (63-4 dB(A)), while the lowestline
is fora 'normal' voice source
level
(55-4dB(A)j. The
intermediate lines corrwpond t o 2dg(A)
increments in speech source level.
Thus
Figure12
summarizesthe
calculated optimum background noiselevels
for opt h u m speech conditions for combinationsof room volume
and
speech source level between 'normal' and 'raised' voice sourcelevels.
Combiming Figures I1 and 12 one can thus arrive at optimumRT
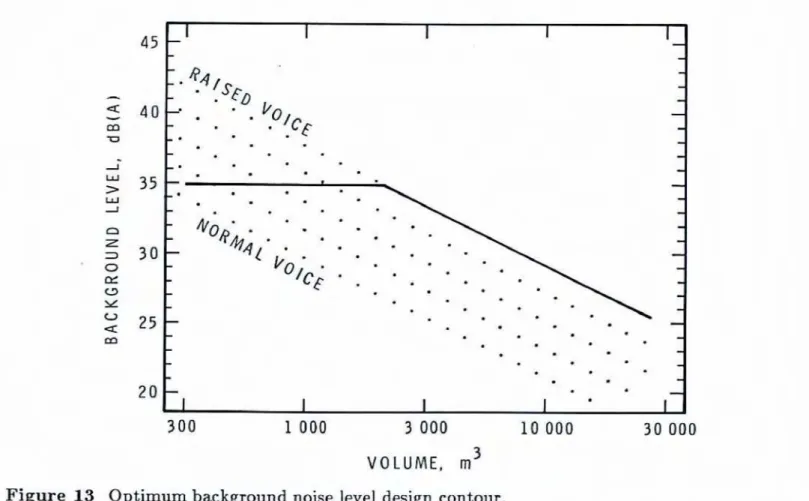
and BG(AJ values for speech for a wide range of room volumes and speech source levels.The results of Figure 12 can be reduced t o one design contour.
In
smaUa rooms, such as classrmms and small meeting rooms, one expects t o communicate with a 'n0rm~1' voicelevel, but
in
larger rooms one would expect to use a stronger vocal effort.This
gradually increasing vocal effort with room siae canbe
appmxXhnated by drawing a horizontal line on the contours of Figure 12, as has been done on Figure 13. A maximum BG(A) value of 35dB
(A) has been selected because it approximates the value calculated for a 300 m3 room and a 'normal' vocal &rt. It wasjudged
that no more than a 'raised' vocd effortwas acceptable in any room volume; thus the design contour wen tually follows
the
'raised' vocal effort lime for larger room volumes. For very large roam volumes the design contour requires v q low background levels, or alternatively, electronically amplified speech. Figures 11 and 13 provide an easy-to-use procedure for determining optimum conditions for speechin
twms ofthe well
known acoustical measures ofRT
and backpund noise level.Their
derivation has been presented in detail so that possible Zitations may be filly appreciated, axid sothat
where judgements have beenmade,
others may makesmdl
adjustments to suit their own particular situation.
The optimum
RT
values of Figure 11 have b m compand with the wellknown
optbum values of-Knudsenand
Harris, and while the new results suggest smaller d a m for in- termediate room volumes, theactual
difference~ are quite s d l .Although
the results of some research studies have suggested that speech intelIiiiElity continues to improve asRT
is
decreased to sera (113, such laboratory studies ignore the beneficial effects ofRT.
Thus the
contours of Figures 9 and 10 peak atRT
mlu-
greaterthan zero,
because some reverberation isdesirable
to provide increased speech levels.Also
arguments based on reverberation ignorethe
value of reflecting surfaces to provide strong early reflections.It
is more difficult t o comparethe
optimum BG[A) values of this studywith
published results because previousdata do
not explicitly specify BG(A) values as a function of room volume.The
present resalts are derived from speech inteligibility tests involving subjects repraentative of am average audience.It
is knownthat
certain gmupsof
liiteners1 i I I I
-
-
-
P R E S E N T S T U D Y-
--
---
-
K N U D S E N A N D H A R R I S [9]-
-
-
-
-
-
-
-
4 * / - # C / C-
/ C-
/ / d / #-
-
-
-
I I I I 1 +Figure 11 Optimum reverberation time versus room volume.
3 00 1 0 0 0 3 000 1 0 000 3 0 000
V O L U M E , m3
Figure timum background noise level design contour.
require improved conditions for similarly optimum inteliigibility [11,12]. In particular younger children (under about 13 years old), older adults, and hearing- impaired subjects require more restricted conditiom, including Eowm
BG
(A) value and more controlled reverberation times.To
accommodate the younger and older liiteners withnormal
hearing one s hodd probably consider a further 5dB
[A) reduction in background levels. For special spaces such as large theatres, itis
not always adequate to have satisfactory intelligibility with a 'raised' voice level; it may bedesirable
for lower voice levels t o be intelligible sa that desired dramatic effects c a n be preserved. Recommended levels of 29 to 46 dB(A) were found inthe
literature for clas~rooms 131. The Swedish National Building Code requim that sf eady-state noise levelsin
classrooms from continuous n o d should notexceed 30
dB(A)-
Berenek
(13) recommends 2130dB(A)
for large theatres, up to 42dB(A)
for small auditaria, and 38 to 47
dB(A)
for meeting roomsand
classrooms. Thus manydesign criteria
in
the literature, according to the present study, would not provide optimum conditions for speech. The present results ~ e e m to differ most for smaller rooms, where much lower background levels are required. It is not possible to trace the source ofall
such criteria, or t o verify whetber these criteria are intended to produce truly optimum
conditions.
In
many cam^ they may represent no more than a good g u m at an upper bound, rather than an ideal goal,9. Knudsen, V.O. and Harris, C.M. Acoustical Designing in .4rchitecture. John 12-iley
& Sons, New York, 194 (1965).
10. Pearsons, K.S., Bennett,
R.L.,
andFidell,
5. Speech Levels in Various Noise Envi- ronments. Bolt Beranek and Sewman h c . Report to USEPA, Pg-270-053, Canoga Park, CA (May 19771,11. Nabelek,
A.K.
and Pickett, J.M. Reception of Consonants in a Classroom asAf-
fected by Monaural and Binaural Listening, Noise, Reverberation,and
Hearing Aids. J. Acoust. Soc. Am. 56(2}, 628-639 (1974).12. NabeZlek, A.K, and Robinson,
P.B.
Monaural and Binaural Speech Perception in Reverberation far Listeners of Various Ages. J. Acoust. Soc, Am. 71(5), 1242-1248 (1 982).