HAL Id: hal-02175501
https://hal.archives-ouvertes.fr/hal-02175501
Submitted on 5 Jul 2019
HAL is a multi-disciplinary open access
archive for the deposit and dissemination of
sci-entific research documents, whether they are
pub-lished or not. The documents may come from
teaching and research institutions in France or
abroad, or from public or private research centers.
L’archive ouverte pluridisciplinaire HAL, est
destinée au dépôt et à la diffusion de documents
scientifiques de niveau recherche, publiés ou non,
émanant des établissements d’enseignement et de
recherche français ou étrangers, des laboratoires
publics ou privés.
AN OCCUPANT BEHAVIOR MODEL BASED ON
ARTIFICIAL INTELLIGENCE FOR ENERGY
BUILDING SIMULATION
Mathieu Bonte, Alexandre Perles, Bérangère Lartigues, Françoise Thellier
To cite this version:
Mathieu Bonte, Alexandre Perles, Bérangère Lartigues, Françoise Thellier. AN OCCUPANT
BE-HAVIOR MODEL BASED ON ARTIFICIAL INTELLIGENCE FOR ENERGY BUILDING
SIMU-LATION. IBPSA, 2013, Chambéry, France. �hal-02175501�
AN OCCUPANT BEHAVIOR MODEL BASED ON ARTIFICIAL INTELLIGENCE
FOR ENERGY BUILDING SIMULATION
Mathieu Bonte, Alexandre Perles, B´erang´ere Lartigue, and Franc¸oise Thellier
Laboratoire PHASE (EA 3028), Universit´e Toulouse III - Paul Sabatier
118 route de Narbonne, 31062 Toulouse
ABSTRACT
Occupants have influence on buildings performances due to their presence and their behavior towards in-door environmental conditions controls. However, most building energy models consider occupants in an over-simplified way. Many experiences feedbacks have shown that this assessment leads to huge dif-ferences between simulation results and actual energy consumption. In this paper we propose a new method aiming at reducing this uncertainty. It embeds mainly two models: a two-node thermophysiological model that calculates thermal sensation of a human being and an occupant behavior model based on artificial intelli-gence. Results of this new method are then presented and compared with actual data from field studies.
INTRODUCTION
Occupants interact with their environment and make personal adjustments in order to maintain their com-fort. Human being is able to adapt to his thermal envi-ronment through three adaptive mechanisms (Parsons, 1993): physiological, behavioral and psychological responses.
Physiological response is a mechanism of uncon-scious reactions which permit the body to thermally adapts in the short term (vasomotion, shivering, sweat-ing, etc) and in the long term (acclimatization). Behavioral response is the set of actions which per-mit the occupant to adapt to his thermal environment (taking off clothes, opening windows, increasing tem-perature setpoint etc.) depending on opportunities and constraints in the environment.
Psychological responses lie on complex and little known phenomenons. For instance, studies have demonstrated occupants differently tolerate indoor en-vironmental conditions depending on their state of mind toward the building where they live or they work (Leaman and Bordass, 2000) (Deuble and de Dear, 2012).
Among those three mechanisms, behavioral adapta-tion is considered as the most important one. Indeed Chatonet and Cabanac stated that ’behavioral ther-moregulation is well-developed in man and becomes preponderant and tends to supplant other forms of thermoregulation’ (Chatonnet and Cabanac, 1965). Moreover, it has been shown that occupants behavior
has a huge influence on energy building performances (Socolow, 1978)(Schipper et al., 1989).
Mainly two comfort fields influence occupants behav-ior in buildings: thermal comfort and visual comfort. Whereas there is no model for visual comfort, many studies have been undertaken regarding modelling of thermal comfort. The most well known model is Fanger’s (Fanger, 1970). It determines the ’Predicted Mean Vote’(PMV) and the ’Predicted Percentage of Dissatisfied’ (PPD). It has been widely accepted un-til, decade ago, studies showed a huge discrepancy be-tween actual comfort vote in surveys and ’Predicted Mean Vote’, especially for naturally ventilated build-ings during summer (de Dear and Brager, 2002). On the contrary, the J.B. Pierce two-node model of human thermoregulation (Gagge, 1971) is still widely accepted for homogeneous thermal environment. At first, this model permitted to carry out physiological calculation for naked body. Further works have per-mitted to take into account clothing insulation and have related physiological calculation to sensation vote (Galeou, 1991).
Despite the good accuracy of this model in homoge-neous thermal environment, it does not take into ac-count the behavioral responses, which is the most in-fluential mechanism on buildings performances. That is why researchers have developed a new theory of thermal comfort in the late 1970’s. This approach was based on statistical results from field surveys data and was called ’adaptive approach’ since it is based on the fundamental principle: ’If a change occurs such as producing discomfort, people would react in ways which tend to restore their comfort’ (Humphreys, 1997). Many of human behaviors have been studied following this approach. In this paper, we propose to focus on two behaviors: adjustment of clothing insu-lation and temperature set point.
The Clothing insulation has been well studied, not least as part of a mission of the American Society of Heating, Refrigerating and Air-Conditioning Engi-neers (ASHRAE) aiming to develop an adaptive model of thermal comfort (de Dear, 1998). This survey lead to the creation of the RP-884 database including about 22,000 sets of data collected across 160 differ-ent buildings. Numerous of regression relationships have been derived from the RP-884 database. One of
them links clothing insulation and mean indoor opera-tive temperature (Equation 1).
Icl = 15.63 × Top−0.9647 (r 2
= 0.2459) (1) Where Icl is the clothing insulation in clo and Topis
the mean indoor operative temperature in◦C.
Regarding comfort temperature set point multiple sur-veys have been undertaken over past few years. How-ever we focus on one result in particular. It comes from the thermal comfort surveys of SCAT project (McCart-ney and Nicol, 2002). It has been lead in many build-ings in order to create a European database for ther-mal comfort. From this database, researchers have de-veloped an ’adaptive control algorithm’ (ACA) with the aim of proposing an alternative to fixed temper-ature set point controls within buildings. Eventually, they managed to propose different regression relation-ships for the comfort temperature Tcacross five
coun-tries (England, France, Greece, Portugal and Sweden). These relationships are based on an exponentially-weighted running mean of the daily mean outdoor temperatures (Humphreys, 1973). This series of tem-perature is defined by Equation 2.
Trm = (1 − α) ∞
X
i=1
αi−1× Tod−i (2)
Where Trm is the running mean outdoor temperature
and Tod−ithe daily mean outdoor temperature. α is a
constant between 0 and 1 which describes the speed of response of the running mean to the outdoor temper-ature. Usually α is taken equal to 0.80 because it is the value which offers the best correlation between the exponentially weighted running mean temperature and the comfort temperature Tc (Nicol and Humphreys,
2002).
As mentioned before, regression relationships were found by the SCAT project. Equations 3 and 4 shows the ones for France.
TC= 0.049Trm80+ 22.58 ∀ Trm80< 10◦C (3)
TC= 0.206Trm80+ 21.42 ∀ Trm80> 10◦C (4)
Where TCis the comfort temperature and Trm80is the
the running mean outdoor temperature with α = 0.80. In spite of the wide data bases and statistical anal-ysis works, a lot of uncertainties remain. Indeed, regression relationship are always correlated with one physical variable whose regression coefficient is often low. This lack of accuracy comes from the complexity of thermal comfort and human behavior and we think that statistical approach reaches its limits for this field. In this paper, we present a new method aiming at im-proving forecasting of clothing insulation and temper-ature setpoint. It embeds a two-node
thermophysio-logical model that calculates thermal variables of a hu-man being and his thermal sensation according to per-sonal characteristics, environmental conditions, cloth-ing, activity, and skin temperature. Then, in order to forecast occupant actions on building systems, an oc-cupant behavior model based on artificial intelligence is added. It uses a reinforcement learning algorithm (Q-learning). Thus the occupants in the building sim-ulation learn what actions allow them maintaining or improving their comfort level depending on their ther-mal preferences. Thereby, occupant behavior will be specified during the learning process by the algorithm itself, not by the simulation tool user. The simulated occupants are able to act on thermostat and personal clothing. The entire system is modeled with TRNSYS simulation program.
METHODOLOGY
Following the example of many behavioral interac-tions in daily life, use of thermostat and adjustment of personal clothing are based on complicated deci-sive processes. This decision process comes from a learning process grounded on past experiences and in-teractions known as ’trial-error’. Thus, when an indi-vidual faced a situation of discomfort, he knows what action to perform. Indeed he is able to anticipate the future potential results of different actions he has the opportunity to perform because he already tried them out.
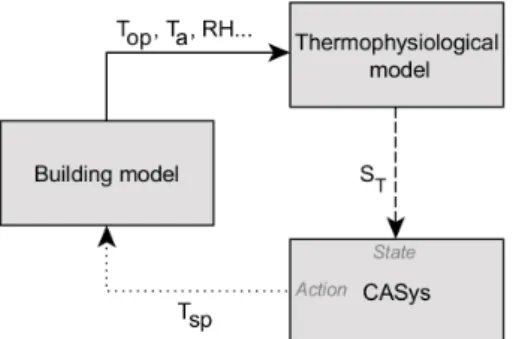
Figure 1: Modelling of two occupant behaviors Our current work is intended to reproduce this com-plex process regarding thermal behavior of occupants in a building simulation. Our methodology rests upon mainly three models (Figure 1):
• the building model
• the thermal sensation model • the decision-making process
We use a building model to calculate the thermal en-vironment of the occupant. Then a model permits to calculate the thermal sensation ST of the occupant.
From his thermal sensation and his thermal profile, the occupant decides what action to perform. We define the thermal profile of an occupant as his preferences towards his thermal sensation. For instance an occu-pant could prefer to feel ’slightly warm’.
Building Model
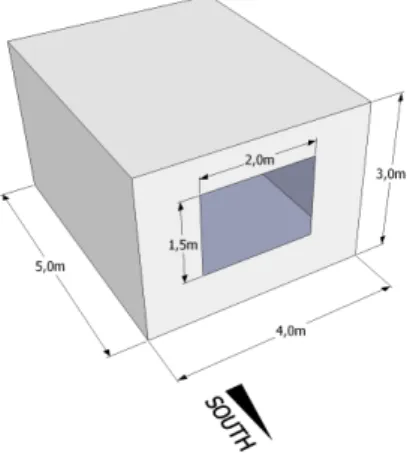
The building used in the present study is a simple room, corresponding to a usual office. It is modeled in a basic way in order to bring out occupant behav-iors. We chose not to simulate an entire building since we focus only on one occupant. The geometry is given in Figure 2.
Figure 2: Building model geometry
The roof and the floor are in contact with zones at the same temperature as the office. Thus, there is no heat flux through these walls. Vertical walls and window are in contact with exterior. Physical characteristics of wall and window are given in Table 1. The solar fac-tor g of the window is equal to 0.589. Internal gains from lighting and occupation are added depending on a working schedule over a week.
Table 1: Main characteristics of walls and window SURFACE U-VALUE W.m−2.K−1
Wall 0.238 Window 1.4 Roof and floor 0.244 Occupant thermal modeling
Since thermal environmental variables are calculated on a single node in the building model, a two-node thermophysiology model is adequate. The thermal transfers between the environment and the body and all physiological reactions are calculated with the J.B. Pierce 2-node model representing the human body to which has been added a layer for clothing. The mean skin temperature and heat fluxes are calculated taking into account physical variables (air temperature and velocity, mean radiant temperature and vapor pressure) and parameters depending on the body (metabolic heat production and clothing insulation).
Thermo physiological unconscious reactions are cal-culated; vasomotion, shivering and sweating. The thermal balance is calculated at each time step of one minute leading to internal and skin temperature calcu-lation. Thermal sensation ST is then calculated on the
ASHRAE seven-point scale from-3 very cold to +3 very hot) thanks to regression relationships with mean skin temperature that have been described in (Galeou, 1991).
Usually it is considered that there is no main discom-fort for a thermal sensation close to 0 (neutral). Thus thermal comfort can be reached. This is one of the strongest assumptions in this field study. In a previ-ous study (Endravadan et al., 2004) we considered that the actions of the occupant, on temperature or clothing control, were only based on thermal sensation. For ex-ample, if the occupant was slightly warm he was tak-ing off a small amount of clothtak-ing.
In this study, the occupant decision is driven by a much more complex process and based on his thermal profile (i.e. thermal preferences).
Decision-making process model
Contextual Actions System (CASys) is a model in-tended to forecast the actions of building occupants. It is based on an artificial intelligence algorithm called Q-learning. It belongs to the family of reinforcement learning algorithms. They are inspired by the idea that we learn from interaction with our environment and are characterized by a trial-and-error search and a delayed reward (Sutton and Barto, 1998). CASys is coded in JAVA and coupled with TRNSYS via a C++ interface. CASys design is based on a the following items (Figure 1):
• Behavioral actions • State
• Profile
Behavioral actions a are the actions that an occupant can perform in the simulation. Any actions can be set up provided that their physical consequences are modeled in TRNSYS. Each action gets a minimum, a maximum and a step. For instance, an occupant could increase or decrease the temperature set point of 0.5◦C (step) between 18◦C (minimum) and 24◦C
(maximum). Besides classic actions (increasing tem-perature set point, decreasing clothing insulation etc.) there is another one permitting to the occupant to do none action.
The state s defines the context in which the occupant is. It includes the occupant sensations and the state of the different actions he is able to perform.
The profile represents the preferences of an occupant towards his sensations. It is defined by a mathematical functionC called ’criticality function’. It is made up of two sigmoid functions (Equation 5 and 6).
C = 100
C = 100
1 + e−a(x−p)+b ∀x > p (6)
Where C is the criticality, x is the sensation of the occupant, p is his preferred sensation, a and b are co-efficients.
Figure 5 shows how criticality function can define the profile of an occupant. It represents two profiles: a neutral profile whose preferred thermal sensation p is equal to 0 and a sensitive to cold profile whose pre-ferred thermal sensation p is equal to 0.3. The higher criticality, the lower the preference towards the con-sidered sensation.
TRNSYS coupled with CASys runs in two different steps:
• learning step • exploitation step
The learning step is intended to map states to actions. A former TRNSYS simulation is run over some years, depending on the complexity of the mapping (number of sensations and actions). During this simulation run CASys (set up in learning mode) performs a random action at each time step. On the following time step, the scoreQ(st−1, at−1) is evaluated as per Equation
7.
Q(st−1, at−1) ←Q(st−1, at−1) − ∆Ct (7)
With
∆C = C (xt) −C (xt−1) (8)
Where Q(st−1, at−1) is the score of the action
per-formed at the previous time step regarding to the state at the previous time step,C (xt) andC (xt−1) are the
criticalities of sensation x, respectively at the current and previous time step, calculated following Equations 5 and 6.
At the end of the learning simulation, each score of actions regarding states is divided by his occurrence in order to get an average score. This value is called ’expected score’ and writtenEas. It traduces the
ex-pected gain or loss of criticality when an action a is performed in a state s. Thus, the occupant modeled by CASys will know what is the best action to perform in given state during the exploitation step.
Once the learning step achieved, a second TRNSYS simulation is run over the period of interest (e.g. a year). This time CASys is set up in exploitation mode. For now on, actions of the occupant are laid down by the mapping between states and actions: at each time step, the action getting the higher expected scoreEas
is chosen. Thus, occupant adapts to his environment thanks to behavioral actions in order to maintain his preferred condition. During exploitation step (once learning is over), CASys outputs the actions. Thus, in order to model the action of adjusting clothing in-sulation, the output of CASys is linked to the clothing insulation input of the thermo-physiological model. In
the case of using thermostat, output of CASys is linked to the temperature input of the building model.
RESULTS AND DISCUSSION
First, we propose to compare results from learning step and exploitation step in order to illustrate the mech-anism of CASys. Then we propose to show results from CASys in two case studies: adjustment of cloth-ing insulation and use of thermostat. Those results are compared to results based on field studies (de Dear, 1998)(McCartney and Nicol, 2002) through Equations 1,3 and 4. For both case studies, learning step duration is 10 years and time step of simulation is 0.5 hour. Comparison between learning step and exploita-tion step
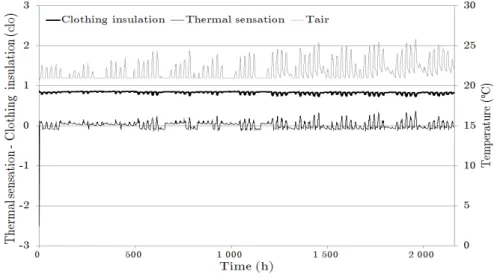
Figure 6 shows how the occupant adjusts his clothing insulation during the learning step. On we observe that the occupant makes wide adjustments (from 0.5 to 1.1 clo) on his clothing since clothing insulation varies randomly.
Thank to the randomness of the action, the occupant experiments a lot of different states and thus enrich the data mapping between states and action. We notice a large variation in thermal sensation due to the range of the action which can vary from 0.5 to 1.1 clo.
It shows how much clothing insulation is important in the thermal balance of a human being and so how it is essential to have an accurate estimation of it when we want to embed active occupants in simulation. Figure 7 shows how the occupant adjusts his cloth-ing insulation once he has learned. Occupant is now able to anticipate the result of his actions and to main-tain his thermal preference regarding his thermal pro-file. The thermal sensation slightly varies around zero, which the occupant’s preferred thermal sensa-tion (p = 0) given that he has been configured as a neutral profile.
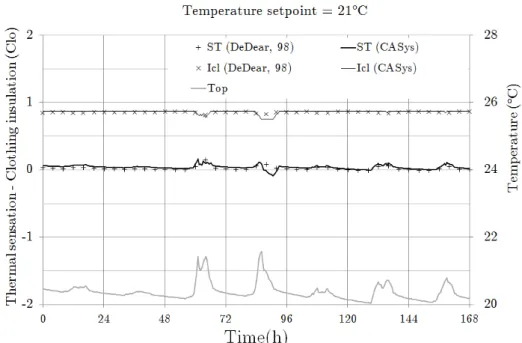
Comparison between TRNSYS/CASys results and RP-884 database: clothing insulation
We propose to investigate a former theoretical case study (case study n◦1) in which occupant can only act on his clothing insulation. Characteristics of the simu-lations are presented in Table 2.
During the first simulation, clothing insulation of the occupant is estimated based on Equation 1 from RP-884 database (de Dear, 1998). From this clothing in-sulation, the thermal sensation of the occupant is cal-culated thanks to the thermophysiological model. Then, during the second simulation, clothing insula-tion Icl and thermal sensainsula-tion ST are calculated based
on interactions between CASys and the thermophysi-ological model (Figure 3).
Figure 3: Interactions between CASys and the thermo-physiological model during the simulation (case study n◦1)
Results from the two simulations are presented over a week of winter in Figure 8. We observe that CASys gives close results to the RP-884 database. It seems to be able to predict the clothing insulation of an oc-cupant even if no rules have been determined by the simulation tool user. Just as an actual person, the simulated occupant has learned from its interactions with the simulated environment and then is capable to maintain its thermal sensation according to its profile. Comparison between TRNSYS/CASys results and Adaptive Control Algorithm (ACA): temperature setpoint
In order to compare results of CASys and ACA, we propose a second case study (case study n◦2) in which occupant can only act on temperature set point. Char-acteristics of the simulations are presented in Table 2. During the first simulation, temperature setpoint is cal-culated based on Equations 3 and 4 from the ACA. The thermal conditions are input to the thermophysiologi-cal model in order to thermophysiologi-calculate the thermal sensation ST.
Then, during the second simulation, temperature set-point Tsp and thermal sensation ST are calculated
based on interactions between building model, ther-mophysiological model and CASys (Figure 4).
Figure 4: Interactions between CASys and the thermo-physiological model during the simulation (case study n◦2)
Results from the two simulations are presented over a week of winter in Figure 8. We observe that the re-sults from CASys match with rere-sults from ACA. In-deed, the occupant sets a temperature close to the one
given by the Adaptive Control Algorithm. Occupant has learned what temperature to set depending on the environment. Though, occupant has no idea on the running mean outdoor temperature. He performs ac-tions only regarding to his personal experience within the building indoor conditions.
CONCLUSION
In the context of energy saving modeling occupants interactions becomes a major goal; we propose a new method to predict human behavioral actions in build-ing simulation. The results from our model CASys match with actual data collected from field studies, regarding preferred ambient temperature or clothing. The next step is to add the modeling of other actions such as actions on windows, lights, blinds and fans. To do this, a better modeling of thermal environment (air velocity) and a modeling of visual environment are needed. CASys has been designed to be flexi-ble and would allow us to add other sensation models such as visual sensation or economic/ecologic sensi-tivity and their related profiles. The final goal of this study is to simulate different kinds of behavioral ac-tions which could influence buildings energy perfor-mance and comfort. CASys in a simulation of an oc-cupied building will allow forecasting energy demand with more accuracy and designing robust buildings to the occupants behavior thanks to the modeling of a large panel of occupants profiles.
ACKNOWLEDGMENT
This work is supported by research federation Occupant-Building System of University of Toulouse. The authors would like to thank M.P. Gleizes, P. Glize of IRIT- SMAC team (Cooperative multi-agent sys-tems) for their valuable advices and comments.
REFERENCES
Chatonnet, J. and Cabanac, M. 1965. The perception of thermal comfort. International Journal of Biome-teorology, 9:183–193.
de Dear, R. 1998. A global database of thermal com-fort field experiments. ASHRAE Trans, 104:1141– 1152.
de Dear, R. J. and Brager, G. S. 2002. Thermal comfort in naturally ventilated buildings: revisions to ashrae standard 55. Energy and Buildings, 34(6):549 – 561.
Deuble, M. P. and de Dear, R. J. 2012. Green occu-pants for green buildings: The missing link? Build-ing and Environment, 56(0):21 – 27.
Endravadan, M., Thellier, F., and Bedrune, J. P. 2004. Modelling of occupant-controlled global heating in buildings. In Proceeding Windsor Conference, Post Occupancy Evaluation±Closing the Loop.
Fanger, P. 1970. Thermal comfort : analysis and appli-cations in environmental engineering. Danish Tech-nical Press.
Gagge, A. P. 1971. An effective temperature scale based on a simple model of human physiological regulatory response. ASHRAE Trans., 77:247–262. Galeou, M. 1991. La sensation thermique de l’homme
dans son habitat: des grandeurs physiques et physi-ologiques aux sensations. PhD thesis, Universit´e de Toulouse.
Humphreys, M. 1997. An adaptive approach to ther-mal comfort criteria. Naturally Ventilated Build-ings: Buildings for the senses, the economy and so-ciety, pages 129–139.
Humphreys, M. A. 1973. Clothing and comfort of sec-ondary school children in summertime. In Proceed-ings of CIB Symposium W, volume 45.
Leaman, A. and Bordass, B. 2000. Productivity in buildings: the killer variables. Creating the produc-tive workplace, pages 167–91.
McCartney, K. J. and Nicol, J. F. 2002. Developing an adaptive control algorithm for europe. Energy and buildings, 34(6):623–635.
Nicol, J. F. and Humphreys, M. A. 2002. Adaptive thermal comfort and sustainable thermal standards for buildings. Energy and buildings, 34(6):563–572. Parsons, K. C. 1993. Human Thermal Environments: The Effects of Hot, Moderate, and Cold Environ-ments on Human Health, Comfort, and Perfor-mance. Taylor & Francis.
Schipper, L., Bartlett, S., Hawk, D., and Vine, E. 1989. Linking life-styles and energy use: a matter of time? Annual review of energy, 14(1):273–320.
Socolow, R. 1978. Saving energy in the home. Prince-ton’s Experiments at Twin Rivers, Cambridge. Sutton, R. S. and Barto, A. 1998. Reinforcement
learn-ing: An introduction, volume 1. Cambridge Univer-sity Press.
Figure 5: Two profiles
Figure 6: Clothing insulation and thermal sensation over three months during learning step
Table 2: Simulation set up for Case studyn◦1 and Case study n◦2
CHARACTERISTIC CASE STUDY N◦1 CASE STUDY N◦2 Sensations Thermal sensation
Profile Neutral profile (p = 0)
Constant parameter T setpoint = 21◦C Clo. insulation = 0.75 clo Action Clothing insulation Temperature set point min/max/step 0.5/1.1/0.025 clo 18/24/0.5◦C
Figure 8: Thermal sensationST and clothing insulationIcl vs. time over a week of winter calculated with CASys
and Equation 1 (de Dear, 1998) for a fixed temperature setpoint
Figure 9: Thermal sensationST and Air temperatureT vs. time over a week of winter calculated with CASys and