HAL Id: hal-01253622
https://hal.archives-ouvertes.fr/hal-01253622
Submitted on 11 Jan 2016
HAL is a multi-disciplinary open access
archive for the deposit and dissemination of
sci-entific research documents, whether they are
pub-lished or not. The documents may come from
teaching and research institutions in France or
L’archive ouverte pluridisciplinaire HAL, est
destinée au dépôt et à la diffusion de documents
scientifiques de niveau recherche, publiés ou non,
émanant des établissements d’enseignement et de
recherche français ou étrangers, des laboratoires
Co/Mo2C multilayer as x-ray mirror: optical and
thermal performances
Yanyan Yuan, Karine Le Guen, Jean-Michel André, Zhanshan Wang,
Haochuan Li, Jingtao Zhu, Christian Mény, Angelo Giglia, Stefano
Nannarone, Philippe Jonnard
To cite this version:
Yanyan Yuan, Karine Le Guen, Jean-Michel André, Zhanshan Wang, Haochuan Li, et al.. Co/Mo2C
multilayer as x-ray mirror: optical and thermal performances. physica status solidi (b), Wiley, 2014,
251 (4), pp.803-808. �10.1002/pssb.201350082�. �hal-01253622�
Co/Mo
2
C multilayer as x-ray mirror: optical and thermal
performances
Yanyan Yuan,1* Karine Le Guen,1 Jean-Michel André,1 Zhanshan Wang,2 Haochuan Li,2 Jingtao Zhu,2 Christian Mény,3 Angelo Giglia4, Stefano Nannarone4,5, Philippe Jonnard1
1 Laboratoire de Chimie Physique-Matière Rayonnement, UPMC Univ Paris 06, CNRS UMR 7614, 11 rue Pierre et
Marie Curie, F-75231 Paris cedex 05, France
2 Institute of Precision Optical Engineering, Department of Physics, Tongji University, Shanghai 200092, China
3 Institut de Physique et Chimie des Matériaux de Strasbourg, UMR 7504 CNRS-Université de Strasbourg, 23 rue du
Loess, F-67034 Strasbourg, France
4 : CNR-Istituto Officina Materiali, I-34149 Trieste, Italy,
5: Dipartimento di Ingegneria E. Ferrari, Università di Modena e Reggio Emilia, I-41125, Modena, Italy
Keywords: Co/Mo2C multilayer, x-ray mirror, standing wave
Abstract
We combined soft x-ray reflectivity and x-ray standing wave enhanced fluorescence to study the optical performance and the thermal induced interface behaviour of Co/Mo2C nanometric multilayers, designed to work in the soft x-ray range close to the Co L3
absorption edge. Grazing x-ray reflectivity measurements were performed at 0.154 nm (Cu Kα line) and at two wavelengths in the soft x-ray range, 1.59 nm and 1.33 nm, close to and far from the Co L3 edge. In the fluorescence experiment the intensity of the Co
Lα emission was measured by standing wave method within Co/Mo2C stack. We found that the Co/Mo2C multilayers presents good
optical performance in the soft x-ray range up to 600°C annealing temperature. Indeed the reflectivity value in the soft x-ray range at a grazing angle of 11° is 25% for the as-deposited sample, then slightly varies with annealing and is still 20% after annealing at
600°C. This demonstrates the good thermal stability of Co/Mo2C multilayer. We used a simplified two-layer model and modified
optical indices of the Co nanofilms to fit the experimental x-ray reflectivity curves. The same modified values of the optical indices are used to fit the x-ray standing wave curves, confirming the usefulness of the model of the stack.
1. Introduction
Periodic multilayer mirrors systems play an important role as optical components in the x-ray and extreme ultraviolet (EUV) spectral ranges for applications such as space telescopes, x-ray microscopes, EUV photolithography and synchrotron radiation beamlines [1–4]. Among them, Co-based multilayer mirrors could achieve high reflectivity, for example the Co/Mg multilayer has reflectivity higher than 50% at 25 nm wavelength at the angle of 45° [5,6]. In order to meet the needs of light sources working in the soft x-ray range, the Co/Mo2C multilayer is proposed. Its theoretical
reflectivity is 45% at 778 eV close to the Co L3 absorption edge.
In addition, it has been reported that Mo2C layer was inserted into the Mo/Si multiyear as barrier layer to improve its
thermal stability up to 600°C [7]. Recently the optical properties of the B4C/Mo2C multilayer have been studied [8] and
have given evidence of abrupt interfaces with respect to the B4C/Mo multilayer where interlayers were detected. The
standard enthalpies of formation of α-Mo2C compound was found to be ΔHfo(298.15 K) = -(6.37 ± 0.73) kcal.mol−1 [9].
This indicates that Mo2C possesses a good thermal stability and is a good barrier candidate in the multilayer stacks.
We characterize the optical performance of Co/Mo2C multilayer with the combination of three methods: (1) grazing
incidence x-ray reflectometry (GIXR) at 0.154 nm to determine the structural parameters of multilayer; (2) soft x-ray reflectometry (SXR) at 1.59 nm and 1.33 nm, i.e. close to and far from the Co L3 absorption edge, to investigate the optical performance; (3) enhanced fluorescence by x-ray standing wave (EFXSW) to confirm the usefulness of the stack model. The value of the EUV optical index of nano-films in the vicinity of the absorption edges of the components is well known to have a large uncertainty. In fact, its accurate determination is required in order to calculate the optical performance of various optical films such as the proposed Co/Mo2C one. Thus, in addition to studying the optical
performance of Co/Mo2C multilayers in both hard and soft x-ray regions, we show in the present work that it is possible
to determine the optical index (n-ik) of a Co nanofilm in the Co/Mo2C multilayer system near the Co L3 edge by
combining these three methods.
While x-ray reflectometry is a well-established technique to determine the characteristics (thickness, density, optical index) of thin films [6], EFXSW in the soft-x-ray range is only at its early stages compared to hard-x-ray SW [10]. Recently some of us have developed a model based on the emission of a radiating dipole embedded in a multilayer structure to describe the EFXSW [11]. This model will be used in this work.
2. Sample fabrication and preparation
The Co/Mo2C multilayers were prepared by direct-current magnetron sputtering method. The substrates were sliced and
polished Si (100) wafers, with surface roughness of 0.4 nm rms. The based pressure was 10-5 Pa before deposition. The
sputtering gas was argon (99.999% purity) at a constant working pressure 0.1 Pa. The powers applied to sputtering target were 40 W and 60 W for Co and Mo2C, respectively. The aimed period was equal to 4.1 nm and ratio of the Mo2C
thickness to the period, known as a Γ ratio, was 0.36, resulting in Co and Mo2C thickness of 2.6 nm and 1.5 nm,
respectively. Six samples with an area of 20 x 20 mm2 were deposited separately on the Si wafer in the same conditions.
From one sample to another a small variation of the period can exist. The bi-layer number for each sample was 30. A 3.5 nm thick B4C capping layer was deposited onto the top to prevent oxidation. To evaluate the thermal behaviour of
Co/Mo2C multilayer, five samples were annealed at the temperature of 200°C, 300°C, 400°C, 500°C and 600°C for 1 h
in a furnace with a base pressure of 3.0×10⁻⁴ Pa, respectively. After annealing, the samples were cooled down to the room temperature naturally.
3. Results and discussion
3.1 X-ray reflectivity measurements
Reflectivity measurements were carried out in both hard and soft x-ray regions. GIXR was performed using the Cu Kα emission line (0.154 nm, 8048 eV) while reflectivity curves at the Cu Lα emission line (1.33 nm, 930 eV), close to the application energy but far enough from the Co L3 edge, were measured with the MONOX apparatus [12]. The fitting procedure of the GIXR curves were performed with Bede Refs software (genetic algorithm). The multilayer structure model is substrate/[Co/Mo2C]30/B4C with layer thicknesses and their interface roughness variable in the fitting
procedure [13]. The fit can provide the value of the structural parameters (thickness and roughness) of the layers while measurements at 1.33 nm allow checking and refining these values.
SXR measurements in the Co L3 region (1.59 nm, around 778 eV) were performed at the BEAR beamline [14] at the Elettra synchrotron radiation centre using s-polarized light. The photon energy was calibrated by x-ray photoemission spectroscopy using as a reference the Au 4f5/2 binding energy of 87.6 eV. Since in the vicinity of Co L3 absorption edge
the refractive index of the Co nanofilm may be strongly modified with respect to the tabulated bulk value, the real and imaginary parts of the Co refraction index have been considered as variables in the SXR fitting.
GIXR curves of as-deposited and annealed from 200 to 500°C are presented in Fig.1. Four well-defined Bragg peaks are observed in the probed range. There is no significant change of the Bragg peaks between room temperature and 400°C, which indicates that the Co/Mo2C multilayer is stable up to 400°C. The intensity of the 4th Bragg peak is low
and varies, especially in the high annealing temperature range. At 500°C there is no more 4th Bragg peak.
10-7 10-6 10-5 10-4 10-3 10-2 10-1 100 101 102 103 104 105 106 Intens ity (a.u. ) 5 4 3 2 1 0
Incidence grazing angle (°)
as-deposited 300°C 400°C 500°C 200°C experimental data fit
Figure 1 Reflectivity curves measured at 0.154 nm of Co/Mo2C multilayers annealed at different temperatures. Data of the samples
annealed at 200, 300, 400 and 500°C are shifted vertically for the sake of clarity.
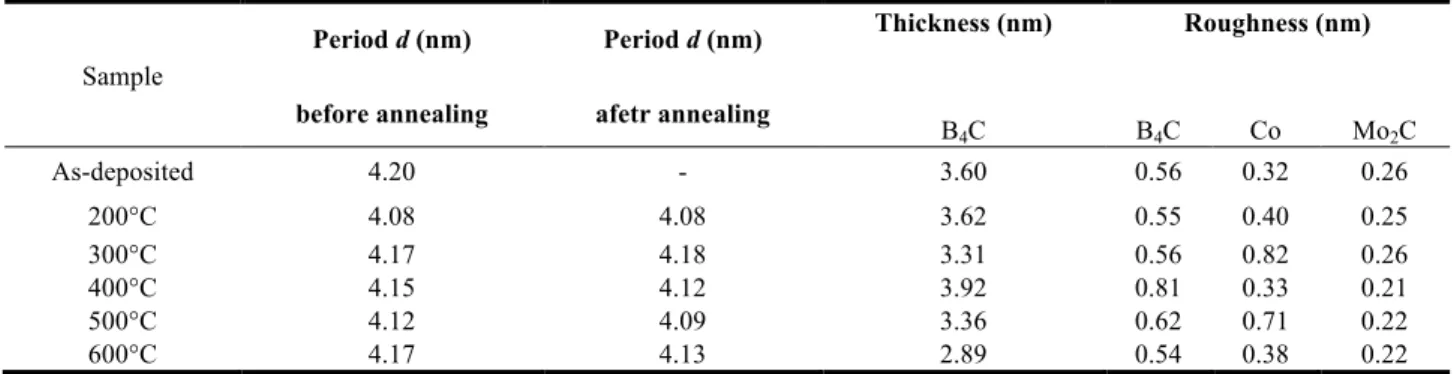
Table 1. Structural parameters extracted from the fit of the GIXR curves measured at 0.154 nm.
Sample Period d (nm) before annealing Period d (nm) afetr annealing Thickness (nm) Roughness (nm) B4C B4C Co Mo2C As-deposited 4.20 - 3.60 0.56 0.32 0.26 200°C 4.08 4.08 3.62 0.55 0.40 0.25 300°C 4.17 4.18 3.31 0.56 0.82 0.26 400°C 4.15 4.12 3.92 0.81 0.33 0.21 500°C 4.12 4.09 3.36 0.62 0.71 0.22 600°C 4.17 4.13 2.89 0.54 0.38 0.22
Structural parameters such as the period and interfacial roughness, deduced from the fitting of the GIXR curves, are listed in Table 1. These fits were done using the bi-layer model, by considering only Co and Mo2C layers in the stack.
The measured periods are in good agreement with the aimed value of 4.10 nm but vary slightly from one sample to another (see the column before annealing) because the samples have been prepared separately. The roughness of Mo2C
layers is small, around 0.25 nm, and independent of the annealing temperature. The fitted value of the roughness of Co layer fluctuates largely with the annealing temperature between 0.3 and 0.8 nm, which is considered to be large with
respect to the thickness of the Co layer 2.60 nm. This means that Co-on-Mo2C and Mo2C-on-Co interfaces are
asymmetrical. This asymmetry has also been reported in Co/Mg and Mo/Si systems [15–18].
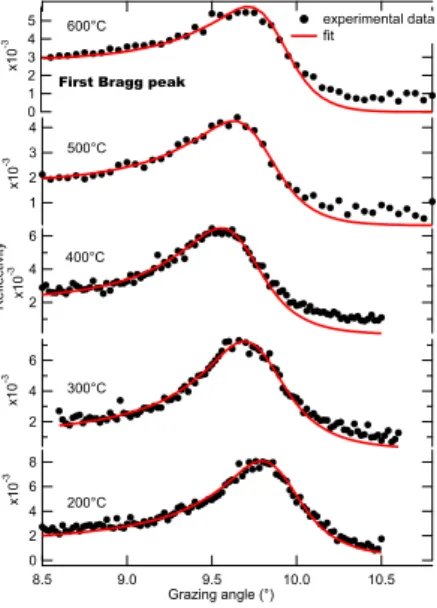
To confirm the description of each layer (thickness and roughness), reflectivity measurements around the first Bragg peak for samples annealed from 200 to 600°C temperatures were performed at 1.33 nm and are presented in Fig.2. It can be noticed that the maximum position varies to some extent with the annealing temperatures, as has already been observed in the hard x-ray range, Fig.1. Within the experimental uncertainty, the values of period and roughness deduced from the fit of the curves obtained at 1.33 nm are in agreement with those from the curves measured at 0.154 nm.
Fig.3 shows the SXR curves measured at 1.59 nm for all the samples up to the fourth Bragg peak. The photon energies are chosen according to the maximum of the photon energy scan measured at 11°, see reference [19], and change slightly from one sample to another. The thermal stability of the multilayer is good because the reflectance at the first Bragg peak goes from about to 0.25 for the as-deposited sample to about 0.20 for the sample annealed at 600°C.
8 6 4 2 0 x1 0 -3 10.5 10.0 9.5 9.0 8.5 Grazing angle (°) 6 4 2 x1 0 -3 6 4 2 x1 0 -3 4 3 2 1 x1 0 -3 5 4 3 2 1 0 x1 0 -3 Ref lect ivi ty 200°C 300°C 400°C 500°C 600°C experimental data fit First Bragg peak
10-5 10-4 10-3 10-2 10-1 Ref lect ivi ty 50 40 30 20 10 Grazing angle(°) As-deposited 777.3 eV Annealed at 200°C 778.3 eV Annealed at 300°C 778.5 eV Annealed at 400°C 778.0 eV Annealed at 500°C 777.9 eV Annealed at 600°C 777.6 eV
Figure 3 Reflectivity curves at 1.59 nm as a function of the annealing temperature.
In Fig.3, the reflectivity curves are presented on a logarithmic scale. It can be seen that the difference between samples in terms of Bragg peak reflectivity and position increases with the grazing angle. Reflectivity of the fourth Bragg peak for all samples is less than 0.1%. In addition, except for the first peak, the others three Bragg peaks are surrounded by shoulders. This phenomenon is due to some contribution of the diffuse scattering. This was checked on one sample: in the same experimental condition, we used a detector with a smaller angular acceptance than the one to measure the sample annealed at 200°C and obtained the reflectivity curve without shoulders (not shown).
The structural parameters of the stacks are taken from the fits of the reflectivity curves (both at 0.154 and 1.33 nm). The SXR curves are fitted by adjusting the optical indices, real and imaginary parts, of cobalt considering only a bi-layer system, i.e. Co and Mo2C, without interlayers. The optical constants of the other materials Mo2C and B4C are kept fixed
to their tabulated values [20] since these materials have no absorption edge in this spectral region.
10-7 10-6 10-5 10-4 10-3 10-2 10-1 Ref lect ivi ty 50 40 30 20 10 Grazing angle (°) 10-8 10-7 10-6 10-5 10-4 10-3 10-2 10-1 As-deposited experimental data fit 600°C
Figure 4 Comparison between soft x-ray reflectivity curves (black line) and fit (red line) using the parameters from XRR fit for
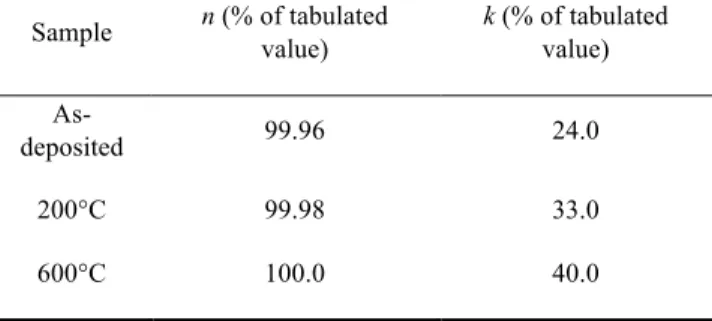
The corresponding reflectivity curves and fit results are presented in Fig.4 for the as-deposited and 600°C-annealed samples. The variations of optical indices n and k of Co with respect to the CXRO database [20] are listed in Table 2. As can be seen, the imaginary part k for both samples has to be modified significantly to obtain a good agreement, while the real part n is almost equal to the value from the CXRO database and needs only to be adjusted slightly. The same has been done for the reflectivity curve of the 200°C-annealed sample. This leads to a 33% reduction of the imaginary part of the Co index, see Table 2. This means that the absorption in Co layers is much smaller than expected from the tables.
Table 2. Variations of the optical complex index n-ik of Co, with respect to the CXRO database required in order to fit the soft x-ray reflectivity curves obtained around 778 eV.
Sample n (% of tabulated value) k (% of tabulated value) As-deposited 99.96 24.0 200°C 99.98 33.0 600°C 100.0 40.0
Indeed it can be seen in Fig.5 that the database value does not take into account the fine structure of the absorption coefficient in the vicinity of the Co L2,3 edge; in the database the absorption profile is represented by a single jump and the L2 edge does not exist. It is surprising to see that the imaginary part of the index deduced from the absorption experiment [21] should be higher than that from the database while in our analysis it is the contrary. However, the experimental curve in Fig.5 is obtained for bulk Co and is probably not fully representative of Co nanofilm owing to some possible change of density or of chemical state if some intermixing exists with the Mo2C layers. Let us note also,
that a slight error in the photon energy calibration can lead to very a different imaginary part of the Co index.
0.000 0.002 0.004 0.006 0.008 770 780 790 800 X-ray absorption measurement CXRO database k
Figure 5. Comparison of the imaginary part of the Co optical index in the vicinity of the L2,3 edge, deduced from absorption
measurement (dotted line) and from the CXRO database (solid line). The two vertical bars indicate the photon energies used to perform the XSW measurements (right: sample annealed at 200°C; left: sample annealed at 600°C).
The reflectivity curves are well reproduced by the fits only towards low angles, Fig 4. This is probably owing to the fact that the simulations are made by considering the bi-layer model without interfacial compound. Actually, formation of an interfacial compound should be considered as one reason for the variation of the imaginary part of Co upon annealing (see Table 2).
3.2 Enhanced Fluorescence by XSW
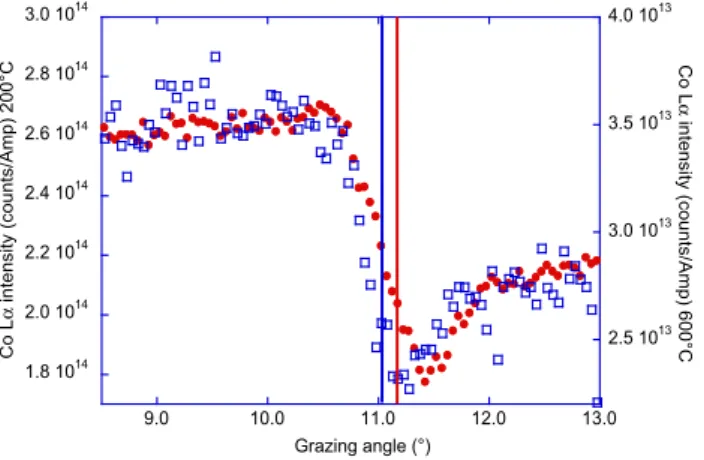
EFXSW is based on the system of standing waves obtained within a periodic multilayer structure in the regime of Bragg diffraction. The peaks of electric field intensity can be localized in the regions of interest of the multilayer structure by adjusting the grazing angle of the incident excitation radiation. This radiation can give rise to fluorescence radiation coming mainly from the regions of the intensity peaks of the excitation radiation. This kind of experiment can be carried out with different geometries. In the present work we have adopted the so-called de Boer configuration [22] where only the incident excitation radiation undergoes Bragg diffraction. In our experiment the excitation radiation is around 778.3 eV for the 200°C annealed sample and 777.6 eV for the 600°C annealed sample. With a SDD detector [23], we record the intensity of the Co Lα emission line at 776.4 eV versus the grazing angle in the range 8-13° around the first Bragg peak (11°). The results are displayed in Fig.6. Curves of the samples annealed at 200 and 600°C are obtained at different incident photon energies and thus show different intensities. Indeed for the sample annealed at 600°C the absorption coefficient is low, as indicated by the vertical bars in Fig.5, thus leading to a low generation of Co L3 ionizations and consequently a lower number of Co Lα transitions. Another effect is the small angular shift of the first Bragg peak, as indicated by the vertical bars in Fig.6, leading to a small angular shift of the XSW curves.
1.8 1014 2.0 1014 2.2 1014 2.4 1014 2.6 1014 2.8 1014 3.0 1014 9.0 10.0 11.0 12.0 13.0 2.5 1013 3.0 1013 3.5 1013 4.0 1013 Co L ! in te n si ty (co u n ts/ Amp ) 2 0 0 °C Co L ! in te n si ty (co u n ts/ Amp ) 6 0 0 °C Grazing angle (°)
Figure 6 EFXWS curve of the samples annealed at 200 and 600°C versus the grazing angle; the recorded radiation is the Co Lα line.
Full red circles: sample annealed at 200°C; open blue squares: sample annealed at 600°C. The vertical bars indicate the position of the first Bragg peak. Red bar: sample annealed at 200°C; blue bar: sample annealed at 600°C.
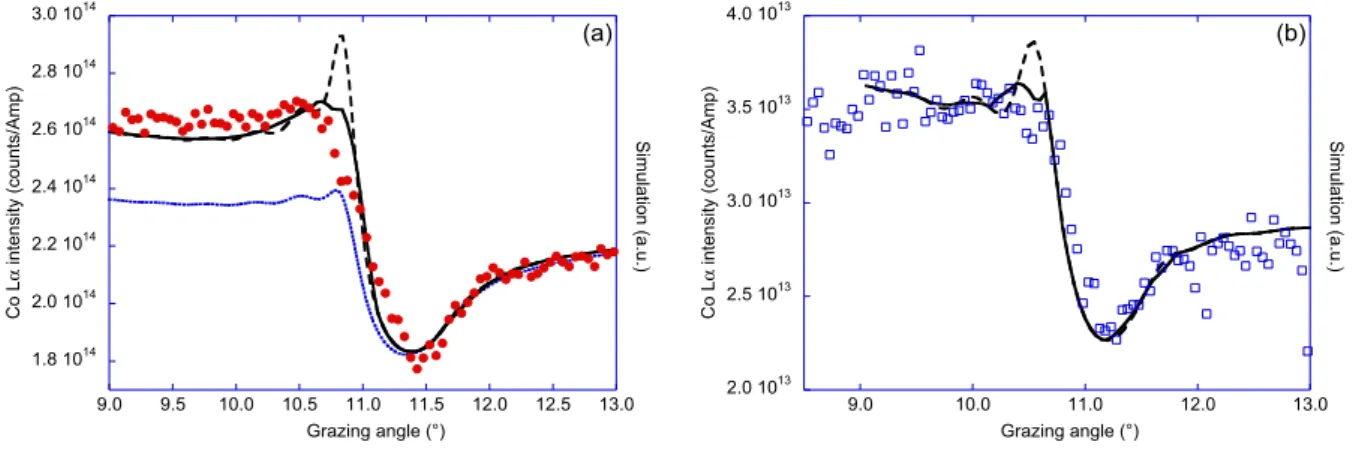
By means of the model given in Ref. [11], we have fitted the EFXSW curves using a bi-layer model as for the reflectivity fitting. Fig.7 shows the results: for the 200°C-annealed sample, Fig.7a, using the tabulated value of the Co refractive index, does not allow us to fit the experimental curve while using the tabulated value of the real part of the refractive index and 25% of the tabulated value of the imaginary part allows us to obtain an agreement provided one smoothes the theoretical results to take into account the aperture of the detector. This analysis is in agreement with the results of the reflectivity measurements. The same fitting procedure was performed with the 600°C-annealed sample, Fig.7b, and once again the best fit, in agreement with the results of the reflectivity measurements, is obtained when 40% of the tabulated value of the imaginary part of the Co optical index is used.
1.8 1014 2.0 1014 2.2 1014 2.4 1014 2.6 1014 2.8 1014 3.0 1014 9.0 9.5 10.0 10.5 11.0 11.5 12.0 12.5 13.0 Co L ! in te nsi ty (co un ts/ Amp ) Si mu la tio n (a .u .) Grazing angle (°) (a) 2.0 1013 2.5 1013 3.0 1013 3.5 1013 4.0 1013 9.0 10.0 11.0 12.0 13.0 Co L ! in te nsi ty (co un ts/ Amp ) Si mu la tio n (a .u .) Grazing angle (°) (b)
Figure 7 Comparison of the experimental (points) and simulated EFXSW curves (lines) for the samples annealed at 200°C (a) and
600°C (b); simulation with tabulated optical index of Co (blue dotted line); simulations with the imaginary part deduced from reflectivity measurements, without smoothing (black dashed line) and smoothing (black solid line).
Let us note that the simulation for the 600°C annealed sample seems better than the one for the 200°C annealed sample. This is probably due to the fact the simulations are made by considering the bi-layer model without interfacial mixing as also suggested in section 3.1. Actually, formation of an interfacial compound could be considered as one reason for the variation of the imaginary part of Co upon annealing (see Table 2).
4. Conclusion
The optical properties of Co/Mo2C multilayers are studied by the combination of hard and soft x-ray techniques, x-ray
reflectivity measurements in the hard and soft x-ray ranges, and enhanced fluorescence by x-ray standing waves. The optical performance of the system depends a little on the annealing temperature up to 600°C showing the good thermal stability of the Co/Mo2C multilayer: the reflectivity value in the soft x-ray range at a grazing angle of 11° is 25% for the
stack derived from the fit of the XRR curves (both at 0.154 and 1.33 nm) show a good agreement between experimental and aimed periods, and a limited variation of period and interfacial roughness after annealing. The convergence between the analysis by reflectivity and by fluorescence, requiring the use of the same modified optical indices of the Co layers, confirms the description of stack. Let us note that the thermal stability of the first layers, including the B4C
capping layer, of the structure was confirmed by XPS induced by XSW [24].
Acknowledgments
This work was performed in the framework of the international ANR-NSFC COBMUL project (ANR #10-INTB-902-01 and NSFC #11061130549). Dr. F. Bridou from Institut d’Optique in Palaiseau is thanked for fruitful discussions regarding XSW.
References
[1]. D. G. Stearns, R. S. Rosen, and S. P. Vernon, Appl. Opt. 32, 6952 (1993). [2]. E. Ziegler, Opt. Eng. 34, 445 (1995).
[3]. I. A. Artioukov, A. V. Vinogradov, V. E. Asadchikov, Y. S. Kas’yanov, R. V. Serov, A. I. Fedorenko, V. V. Kondratenko, and S. A. Yulin, Opt. Lett. 20, 2451 (1995).
[4]. L. Golub, M. Herant, K. Kalata, I. Lovas, G. Nystrom, F. Pardo, E. Spiller, and J. Wilczynski, Nature 344, 842 (1990).
[5]. K. Le Guen, M.-H. Hu, J.-M. André, P. Jonnard, S. K. Zhou, H. C. Li, J. T. Zhu, Z. S. Wang, and C. Meny, J. Phys. Chem. C
114, 6484 (2010).
[6]. K. Le Guen, M.-H. Hu, J.-M. André, P. Jonnard, S.-K. Zhou, H.-C. Li, J.-T. Zhu, Z.-S. Wang, N. Mahne, A. Giglia, and S. Nannarone, Appl. Phys. Mater. Sci. Process. 102, 69 (2011).
[7]. T. Feigl, H. Lauth, S. Yulin, and N. Kaiser, Microelectron. Eng. 57–58, 3 (2001).
[8]. F. Choueikani, F. Bridou, B. Lagarde, E. Meltchakov, F. Polack, P. Mercere, and F. Delmotte, Appl. Phys. 111, 191 (2013). [9]. G. K. Johnson, W. N. Hubbard, and E. K. Storms, J. Chem. Thermodyn. 9, 1021 (1977).
[10]. M. K. Tiwari and K. J. S. Sawhney, J. Phys. Condens. Matter 22, 175003 (2010).
[11]. J.-M. André, K. Le Guen, and P. Jonnard, Spectrochim. Acta Part B At. Spectrosc. 85, 55 (2013).
[12]. J.-M. André, A. Avila, R. Barchewitz, R. Benbalagh, R. Delaunay, D. Druart, P. Jonnard, and H. Ringuenet, Eur. Phys. J. Appl. Phys. 31, 147 (2005).
[13]. M. Wormington, C. Panaccione, K. M. Matney, and D. K. Bowen, Philos. Trans. R. Soc. Lond. Ser. Math. Phys. Eng. Sci. 357, 2827 (1999).
[14]. S. Nannarone, F. Borgatti, A. DeLuisa, B. P. Doyle, G. C. Gazzadi, A. Giglia, P. Finetti, N. Mahne, L. Pasquali, M. Pedio, G. Selvaggi, G. Naletto, M. G. Pelizzo, and G. Tondello, AIP Conf. Proc. 705, 450 (2004).
[15]. K. Le Guen, M.-H. Hu, J.-M. André, S. K. Zhou, H. C. Li, J. T. Zhu, Z. S. Wang, C. Meny, A. Galtayries, and P. Jonnard, Appl. Phys. Lett. 98, 251909 (2011).
[16]. S. Yulin, T. Feigl, T. Kuhlmann, N. Kaiser, A. I. Fedorenko, V. V. Kondratenko, O. V. Poltseva, V. A. Sevryukova, A. Y. Zolotaryov, and E. N. Zubarev, J. Appl. Phys. 92, 1216 (2002).
[17]. G. A. Valkovskiy, M. V. Baidakova, P. N. Brunkov, S. G. Konnikov, M. A. Yagovkina, and J. M. Zadiranov, Phys. Status Solidi -Appl. Mater. Sci. 208, 2623 (2011).
[19]. Y.-Y. Yuan, K. Le Guen, J.-M. André, Z.-S. Wang, H.-C. Li, J.-T. Zhu, and P. Jonnard, Proc, SPIE 8550, 85501U (2012). [20]. http://henke.lbl.gov/optical_constants/.
[21]. http://forge.epn-campus.eu/projects/ppm. [22]. D. de Boer, Phys. Rev. B 44, 498 (1991).
[23]. http://www.elettra.trieste.it/images/Documents/BEAR/files/guide_fluorescence_detector.pdf.
[24]. A. Giglia, S. Mukherjee, N. Mahne, S. Nannarone, P. Jonnard, K. Le Guen, Y.-Y. Yuan, J.-M. André, Z.-S. Wang, H.-C. Li, and J.-T. Zhu, Proc SPIE 8777, 87770I (2013).